Comparison of Carotid Plaque Score and Coronary Artery


 events better than carotid wall thickness")

 is a longitudinal prospective,")


 u Carotid plaque score analyzed as:")
 61. 6")
 36. 6 (1, 812)")
 10. 5")
 had CAC • Mean score of 270. 6")


- Slides: 22
Comparison of Carotid Plaque Score and Coronary Artery Calcium Score for Predicting CVD Events in MESA Adam Gepner, MD University of Wisconsin School of Medicine and Public Health
DISCLOSURES: NONE
Abstract
Background u CAC predicts coronary heart disease (CHD) events better than carotid wall thickness and carotid plaque presence u CAC scoring may not detect non-calcified plaques u CAC may underestimate stroke/transient ischemic attack (TIA) risk compared with carotid plaque u Comparative efficacy of CAC score & carotid plaque score for CVD risk prediction is unclear
Objective To compare and describe the abilities of CAC score and carotid plaque score to predict CVD events in a large, multiethnic cohort with long-term follow-up
Participants and Design u The Multi-Ethnic Study of Atherosclerosis (MESA) is a longitudinal prospective, cohort study u Participants were 45 -84 years old and free of known CVD at baseline (20002002) u CVD events (CVD death, CHD, and stroke) and TIAs adjudicated
CAC and Plaque Methods u CAC detected by computed tomography and Agatston scores determined u Carotid plaque detected by B-mode US • Focal abnormal wall thickness (IMT >1. 5 mm) • Focal thickening >50% of the IMT u Carotid plaque score calculation • # of plaques in the common, bifurcation, and internal carotid arteries • Range 0 -12
Plaque Score Examples: Right internal carotid artery Left carotid bifurcation Left external carotid artery Left common carotid artery Right carotid bifurcation Right external carotid artery Right common carotid artery
Statistical Analysis u CAC score analyzed as ln(CAC+1) u Carotid plaque score analyzed as: • ln(score +1) • Untransformed u SD units u Predictive values compared • Cox proportional hazards models, C-statistics, NRIs u Models factors adjusted for traditional CVD risk
Baseline Demographics Complete Cases* All Participants** 4, 955 6, 783 Age (years) 61. 6 (10. 1) 62. 2 (10. 2) Male sex, % (n) 47. 2 (2, 339) 47. 16 (3, 199) 38. 8 (1, 924) 38. 5 (2, 614) 12. 4 (614) 11. 8 (801) Black 26. 0 (1, 288) 27. 7 (1, 880) Hispanic 22. 8 (1, 129) 21. 9 (1, 488) 28. 3 (5. 5) Mean (SD) unless noted Analytic sample size (n) Race/ethnicity, % (n) White Chinese Body-mass index (kg/m 2)
Baseline Demographics Complete Cases All Participants Former smoker, % (n) 36. 6 (1, 812) 36. 7 (2, 486) Current smoker, % (n) 12. 86 (636) 13. 1 (885) LDL cholesterol (mg/d. L) 117. 3 (31. 5) 117. 8 (31. 5) HDL cholesterol (mg/d. L) 50. 8 (14. 8) 51. 0 (14. 8) Lipid-lowering medication, % (n) 16. 1 (796) 16. 3 (1, 102) Systolic blood pressure (mm. Hg) 126. 2 (21. 6) 126. 6 (21. 5) Diastolic blood pressure (mm. Hg) 71. 9 (10. 3) Antihypertensive medication, % (n) 36. 4(1, 803) 37. 3 (2, 528) Untreated diabetes mellitus, % (n) 2. 5 (125) 2. 6 (179) Treated diabetes mellitus, % (n) 9. 5 (468) 9. 9 (672) Mean (SD) unless noted
Events Complete Cases* All Participants** 4, 955 6, 783 9. 8 (487) 10. 5 (709) 2. 1 (102) 2. 1 (143) 7. 0 (348) 7. 3 (498) 1. 3 (63) 1. 2 (84) Stroke, % (n) 2. 7 (136) 2. 7 (200) Stroke + TIA, % (n) 3. 5 (175) 3. 9 (262) Analytic sample size (n) CVD event, % (n) CVD death, % (n) CHD event, % (n) CHD death, % (n)
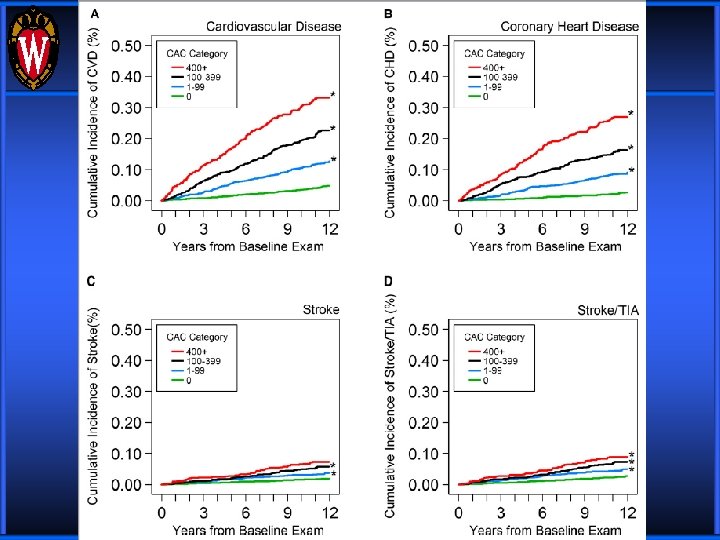
Results u 2, 424 (48. 9%) had CAC • Mean score of 270. 6 (519. 9) u 2, 516 (50. 8%) had carotid plaque • Mean score of 2. 6 (1. 8) u 11. 3 (3. 0) years follow-up u CAC and carotid plaque scores improved risk prediction compared with traditional CVD RFs u CAC score was a stronger predictor than carotid plaque score for both CVD and CHD
Questions?
Adjusted Models
Discussion u CAC score and carotid plaque score improved prediction of CVD and CHD events compared to traditional CVD risk factors u Adjusted HRs, C-statistics, and NRI values consistently were higher for CAC score than for carotid plaque score u For stroke and TIA events, CAC and carotid plaque score performed similarly
Limitations u Subset of the entire MESA cohort • Possible survivorship bias • Small number of stroke and TIA events u Units of CAC score and carotid plaque score are not equal or equally spaced • CAC score ranges from 0 to infinity; carotid plaque score from 0 -12 • Regression coefficients presented in SD units of the measure to permit a more direct comparison
Conclusions u CAC score improves prediction, discrimination, and reclassification of CVD and CHD risk better than carotid plaque score u CAC and carotid plaque scores had similar prediction and weaker discrimination and reclassification for stroke/TIA events
Funding Sources Contracts N 01 -HC-95159 through N 01 HC-95169 from the NHLBI, grant ES 015915 from the NIEHS, grant R 831697 from the US EPA, grants UL 1 -RR 024156 and UL 1 -RR-025005 from the NCRR, and by a T 32 HL-07936 Ruth L. Kirschstein National Research Service Award from the NHLBI to the University of Wisconsin-Madison Cardiovascular Research Center
Acknowledgements u James Stein u Rebekah Young u AIRP Lab • Claudia Korcarz • Kristin Hansen • Jo. Anne Weber • Jessica Horn u Co-Authors u MESA Steering Committee
Questions ?