Comparing Transcranial Magnetic Stimulation Direct Electric Stimulation An


![Above: Precentral Gyrus [3] Figure A: Points of DES in one subject [2]. Figure](https://slidetodoc.com/presentation_image_h/b961092d55561b0a7e27648059399bca/image-10.jpg "Above: Precentral Gyrus [3] Figure A: Points of DES in one subject [2]. Figure")


![Figure A: 5 different tissue types shown in FEM model and spherical model [2].](https://slidetodoc.com/presentation_image_h/b961092d55561b0a7e27648059399bca/image-13.jpg "Figure A: 5 different tissue types shown in FEM model and spherical model [2].")

 • Noticed from DES electric field distribution (Figure C) that")
 • Treated electric field distribution maps as mass distribution maps")


![Results: COG Comparisons [2]](https://slidetodoc.com/presentation_image_h/b961092d55561b0a7e27648059399bca/image-21.jpg "Results: COG Comparisons [2]")


:")

- Slides: 25
Comparing Transcranial Magnetic Stimulation & Direct Electric Stimulation: An Application of the Finite Element Method Brandi Henry Mathematics Department, Temple University December 7, 2017
What is Transcranial Magnetic Stimulation? • An insulated coil generates a magnetic field that passes unimpeded through skin and bone. • The magnetic field induces an electrical current in the neurons. • One pulse of the magnetic field can cause visible effects to the motor and visual cortex. • Continual magnetic field pulses, known as repetitive TMS or r. TMS, can induce unobservable effects [1]
Why TMS? • Adrian Pollacsek and Berthold Beer were the first to introduce the idea of using electromagnetic fields in brain therapy in the early 1900’s when studying depression. • TMS devices as we know them now were invented by Anthony T. Barker and colleagues in England to use on spinal cords. • Repetitive TMS can excite or inhibit certain functions or regions in the brain. This has a multitude of applications: inhibiting the region of the brain that causes seizures, activate regions to enhance memory and learning, an alternative to electroconvulsive therapy for patients with depression, simulating brain lesions in healthy patients, LTD and LTP [1].
Questions about TMS • While TMS seems very promising, there aspects to the practice that are still unknown: How vast an area of the brain is stimulated by the magnetic field and which neurons are affected [1], [2] The sequence of events post-stimulation [1] How far the electric field extends to other regions of the brain [2] Which region of the brain is actually causing the desired effect due to the stimulation (no output indicating strength or efficacy in regions besides motor and visual cortex) [2] Optimal strength of magnetic field and placement of coil [1]
Introduction to the Paper • “Validating computationally predicted TMS stimulation areas using direct electrical stimulation in patients with brain tumors near precentral regions” by Alexander Opitz et al. • Compared TMS stimulation with the gold standard of DES stimulation. • Used finite element modeling to explore spatial reach of TMS and DES stimulation [2].
Method: Subjects & MR Imaging • Six patients with tumors in the vicinity of the motor cortex 3 men and 3 women Ages 44 -79 with mean of 63. 5 • Magnetic resonance images were taken for diagnosis and for neuronavigation during surgery • Used a Mag. Pro X 100 stimulator with a C-B 60 coil • Neuronavigation system constantly tracked and recorded coil position and orientation to the scalp [2]
Method: TMS Motor Mapping • Moved coil around patient’s head to determine “motor hotspot” – the point at which the greatest MEPs were consistently detected. • Constructed 5 cm x 5 cm grid on the scalp centered around the hotspot. • Determined resting motor threshold (RMT) by finding the intensity of a pulse that induced at least 5 of 10 MEPs of amplitudes of at least 50 µV in the first dorsal interosseous. • Then 10 pulses of 120% RMT were applied at each grid point. MEPs at the FDI were recorded with electrodes. Average of MEP amplitude for each grid position calculated. MEP map constructed. • Coil was angled at approximately 45° to midline during experiment [2].
Figure A: 5 cm x 5 cm grid over primary motor cortex. Blue arrows indicate 45° orientation of coil [2]. Figure B: 10 MEPs for two positions overlaid. MEP map constructed from averages of MEP amplitudes [2].
Method: Intraoperative DES • Craniotomy operation to access tumor regions during which intraoperative neuromonitoring was implemented. Locates neural structures, tests functionality, detects injury • In a 2 -4 cm 2 area, a single anodal square pulse was induced at 9 different points on the precentral gyrus. • Two other reference points about 2 cm from the original 9 points were also stimulated. • MEPs [2]. of the FDI resulting from the DES were recorded
Above: Precentral Gyrus [3] Figure A: Points of DES in one subject [2]. Figure B: Illustration of DES performed with neuronavigation software. Cross hairs indicate target of stimulation [2]. Figure C: Simulated electric field distribution for DES for one point [2].
Method: Realistic FEM Model • Finite element method models were constructed using Sim. Nibs and the MR images for each subject in a process developed by Windhoff et al [4], [5]. • The following isotropic conductivities were used in the electric field simulations: σskin = 0. 465 S/m, σskull = 0. 010 S/m, σCSF = 1. 654 S/m, σGM = 0. 276 S/m, and σWM = 0. 126 S/m. Tumor conductivity was set to surrounding white matter. Tested varying conductivities of tumor in one patient. • Simulated electric fields using Sim. Nibs for each coil position that was used during TMS, from which a MEP weighted mean electric field distribution was determined [2].
Method: Spherical Model • A 5 layer spherical model was developed using the ordinary least squares method. The model was fitted to the upper half of the skin surface and the following radii were used: rskin = 88. 8 ± 3. 9, rskull = 84. 8 ± 4. 1, r. CSF = 77. 8 ± 4. 4, r. GM = 74. 0 ± 4. 8, r. WM = 69. 8 ± 5. 0. • Simulated electrical field distributions using this model for each coil position. A MEP weighted mean electrical field distribution was calculated. • The resulting electrical fields from the FEM model and the spherical model were interpolated by inserting the GM and WM values from the spherical model into the FEM model [2].
Figure A: 5 different tissue types shown in FEM model and spherical model [2]. Figure B: Sample electric field distribution at one coil position in FEM model and spherical model [2].
Method: DES Simulation • The Direct Electrical Stimulation that occurred during the operation was also simulated using the FEM model with a Dirichlet boundary condition. • Again, an average MEP weighted electrical field was calculated for the simulation [2]. Figure C: Example of a DES electric field distribution for one point [2].
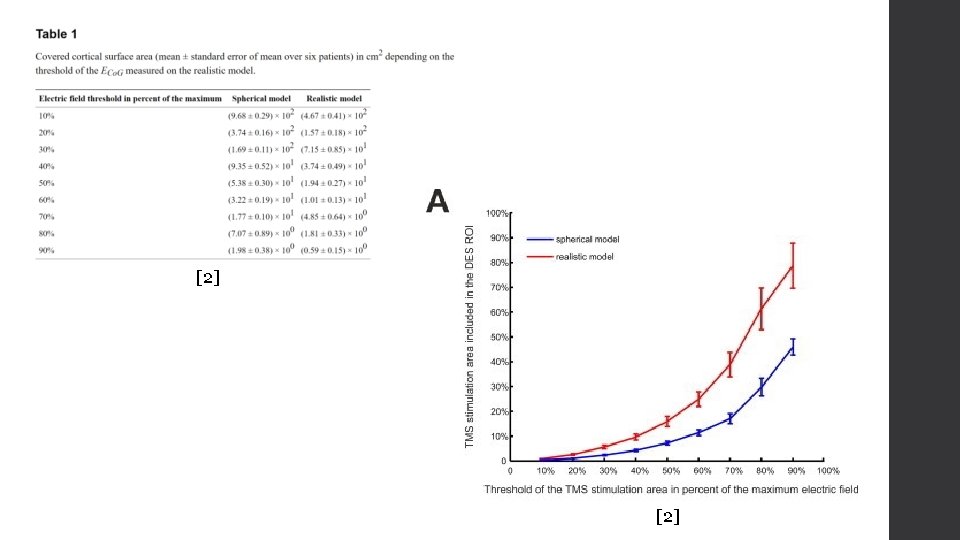
Method: TMS-DES Comparison (Area) • Noticed from DES electric field distribution (Figure C) that at less than 30% of maximum electric field, the strength of the electric field drops off quickly. Noted area of this region of interest. • For thresholds from 10 -90% of electric field maximum in 10% steps, found the area of the region with electric field above that threshold in both the FEM and spherical model. • Computed the percentage of each of the areas above covered by the area of the region of interest [2]. Figure A: Electric field for FEM model [2]. Figure B: Electric field for spherical model [2]. Figure C: DES electric field [2]. Figure D: Example region of interest (>30% max) [2].
Method: TMS-DES Comparison (COG) • Treated electric field distribution maps as mass distribution maps and calculated center of gravity for DES map at threshold of 30% and for FEM and spherical maps at 10 -90% thresholds in 10% steps. • Found Euclidean distance from the point of center of gravity for the DES map at 30% threshold to each point of center of gravity for the different thresholds for the FEM and spherical maps. • Also approximated a simple model free center of gravity for DES by assuming the tip of the electrode during stimulation causes a point-like excitation. Calculated Euclidean distances again with this value for the DES center of gravity [2].
Results: Model Comparisons • First, note that the area of stimulation is larger in the spherical electric field than the FEM electric field and the DES electric field. • Also, note that the high electric field in the FEM model is restricted to the crowns of the gyri, whereas the high electric field maintain their strength going deeper into the folds in the spherical model [2]
Results: Area Comparisons • For both the FEM model and the spherical model, increasing the threshold resulted in an increased percentage of the area in the DES region of interest. • At the 90% threshold, 80% of the area of the FEM electric field fell into the DES region of interest. • The percentage of the area of the spherical electric field in the DES region of interest was less than that of the FEM electric field of every threshold [2].
Results: COG Comparisons • Similarly for the Euclidean distances to the center of gravity of the DES map, the center of gravity of both the FEM and spherical maps were closer to the center of gravity of the DES map as the threshold increased. The center of gravity of the FEM map at the 90% threshold was 6. 3 ± 0. 7 mm in distance from the DES COG. • Also like the comparison in areas, the center of gravity for the FEM map was closer to the center of gravity of the DES map than the center of gravity of the spherical map for every threshold. • At 90% threshold, the FEM COG and the spherical COG were 9. 4 ± 1. 5 mm and 11. 0 ± 1. 5 mm from the model free simple estimate of the DES COG respectively [2].
Results: COG Comparisons [2]
Discussion • The TMS stimulation area computed by the finite element method overlaps greatly with the computed DES stimulation area, especially for stronger electric fields. • The COG of the TMS map computed by the finite element method is also close to the COG of the DES map. • These two results seem to indicate that TMS stimulation might be an accurate alternative to DES stimulation [2].
Discussion • The greater alignment with the DES results of the FEM model than the spherical model and the FEM model’s better approximation of effects of the gyrification of the brain seem to validate the use of the finite element method and seem to suggest that a good understanding of the gyrification of the brain is necessary for a good prediction of the electric field distribution. • Though the motor cortex was the focus of this study, TMS FEM simulations could also predict stimulation sites in other brain regions [2].
References • George, Mark S. “Stimulating the Brain. ” Scientific American 289. 3 (2003): 6673. JSTOR. Web. • Opitz, Alexander, et al. “Validating computationally predicted TMS stimulation areas using direct electrical stimulation in patients with brain tumors near precentral regions. ” Neuro. Image: Clinical 4 (2014): 500 -507. US National Library of Medicine. Web. DOI: 10. 1016/j. nicl. 2014. 03. 004 • “Cerebrum - precentral gyrus - superior view. png. ” Wikipedia, December 17, 2012. https: //commons. wikimedia. org/wiki/File: Cerebrum__precentral_gyrus_-_superior_view. png • Windhoff, M. “Electric field calculations in brain stimulation based on finite elements: an optimized processing pipeline for the generation and usage of accurate individual head models. ” Human Brain Mapping 34. 4 (2013): 923 -935. US National Library of Medicine. Web. DOI: 10. 1002/hbm. 21479 • “Sim. NIBS. ” http: //simnibs. de/
Questions?