Comparing Linear Exponential and Quadratic Functions Identifying from


 y = 6 x + 3 b) y")

 b) c) d)")


- Slides: 16
Comparing Linear, Exponential, and Quadratic Functions
Identifying from an equation: Linear Quadratic Exponential y = mx +b y = ax 2 + bx + c y = abx Has an x with no exponent Has an x 2 in the equation. Has an x as the exponent. (or exponent 1). Examples: y = 5 x + 1 y = ½x 2 x + 3 y = 6 y= 2 x 2 y= x 2 + 3 x – 5 x 2 +9 + 4 y = 7 Examples: y = 3 x + 1 y = 52 x 4 x + y = 13
Examples: LINEAR, QUADRATIC or EXPONENTIAL? a) y = 6 x + 3 b) y = 7 x 2 +5 x – 2 c) 9 x + 3 = y d) 42 x = 8
Identifying from a graph: Linear Quadratic Exponential Makes a straight line Makes a U or ∩ Rises or falls quickly in one direction
LINEAR, QUADRATIC, EXPONENTIAL, OR NEITHER? a) b) c) d)
Is the table linear, quadratic or exponential? Exponential Linear • Never see the same y value twice. • Can be written as: Next = Now + m, SA: b Quadratic • See same y more than once. • y changes more quickly than x. • Never see the same y value twice. • Can be written as: Next = Now b, SA: a
EXAMPLE 1 b. Identifying functions given a table of values x – 2 – 1 0 1 2 y – 2 1 4 7 10 3 3
EXAMPLE 2 Identifying functions given a table of values Does the table of values represent a linear function, an exponential function, or a quadratic function? a. x y – 2 0. 25 2 – 1 0. 5 0 1 2 2 2 4 2
EXAMPLE 3 Identifying functions given a table of values Determine which type of function the table of values represents. x – 2 – 1 0 1 2 y 2 0. 5 0 0. 5 2 – 1. 5 – 0. 5 1. 5
Is the table linear, quadratic or exponential? x y x y 1 5 1 0 1 3 2 9 2 -1 2 9 3 13 3 0 3 27 4 17 4 3 4 81 5 21 5 8 5 243
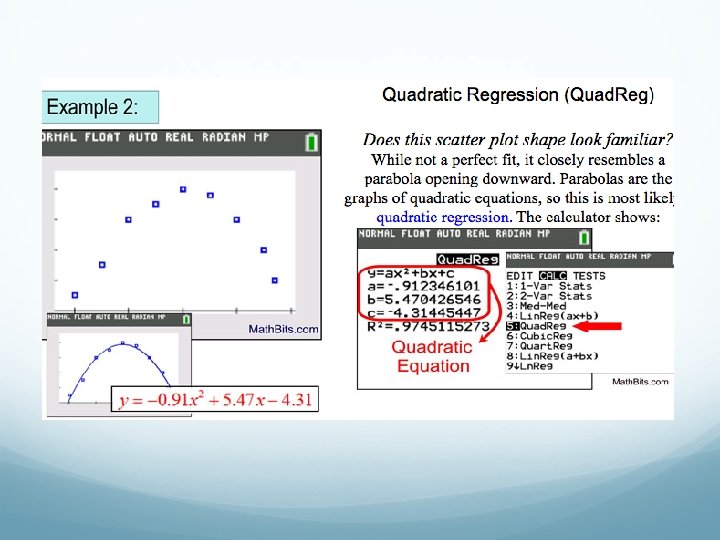
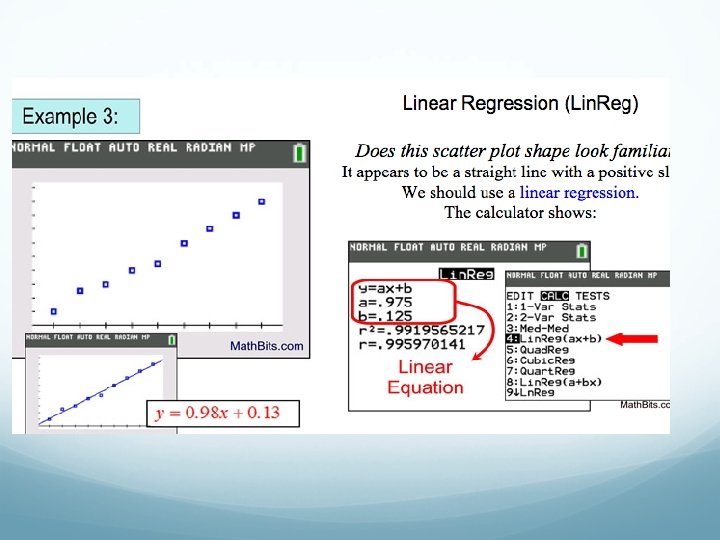
Identifying Regressions Using Shapes of Known Functions
Fitting Functions to Data The term regression pertains to the process of finding an equation for the relationship seen in a scatter plot. Regression is a generic term for all methods attempting to fit a model to observed data in order to predict new values. Steps for finding a regression: 1. Create a scatter plot:
Creating a Scatter Plot 9 Zoom Stat
Go to STAT, arrow right to CALC, and arrow down for regression equation choices.