
Comparing Data Sets www mathsrevision com N 4






- Slides: 20
Comparing Data Sets www. mathsrevision. com N 4 LS Range, Mean, Median and Mode Exam Type Questions 17 -Sep-20 Created by Mr. Lafferty Maths Dept.
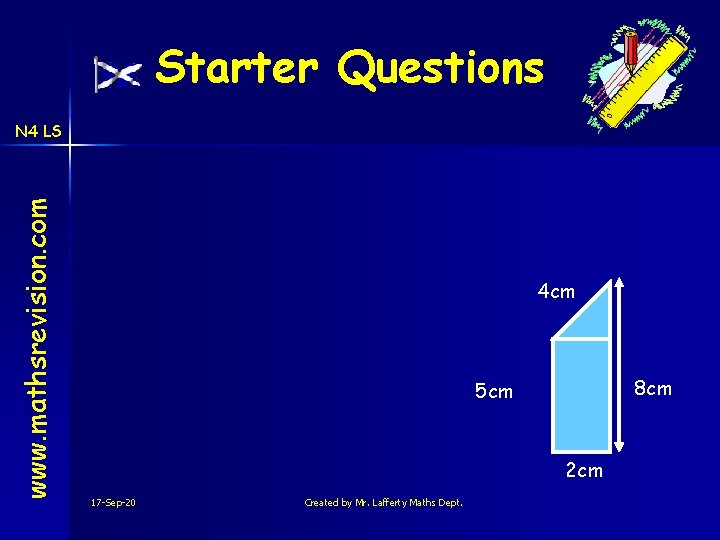
Starter Questions www. mathsrevision. com N 4 LS 4 cm 8 cm 5 cm 2 cm 17 -Sep-20 Created by Mr. Lafferty Maths Dept.
Different Averages www. mathsrevision. com N 4 LS Learning Intention Success Criteria 1. We are learning the terms Mean Median, Mode and Range for a set of data. 1. Understand the differences between the terms Mean, Median, Mode and Range. 2. Calculate values for the Mean, Median, Mode and Range in a context. 17 -Sep-20 Created by Mr. Lafferty Maths Dept.
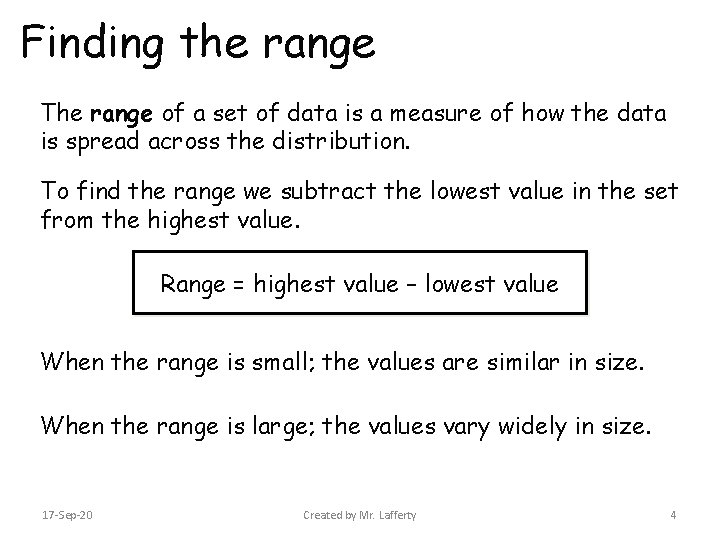
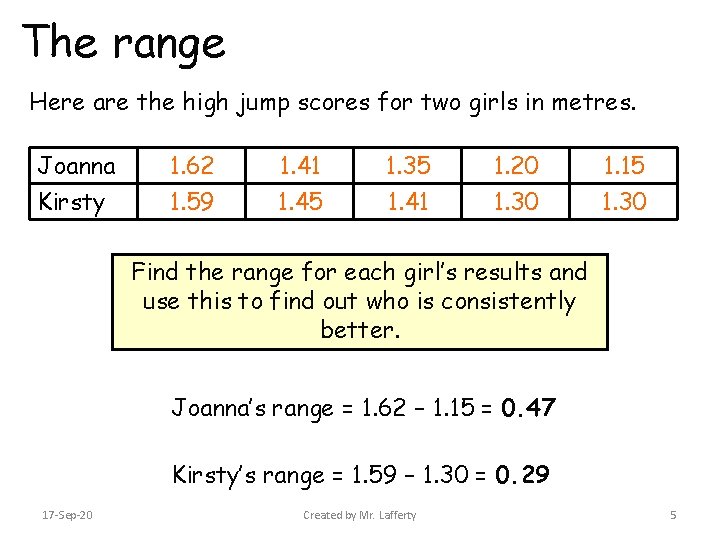
Finding the range The range of a set of data is a measure of how the data is spread across the distribution. To find the range we subtract the lowest value in the set from the highest value. Range = highest value – lowest value When the range is small; the values are similar in size. When the range is large; the values vary widely in size. 17 -Sep-20 Created by Mr. Lafferty 4
The range Here are the high jump scores for two girls in metres. Joanna Kirsty 1. 62 1. 59 1. 41 1. 45 1. 35 1. 41 1. 20 1. 30 1. 15 1. 30 Find the range for each girl’s results and use this to find out who is consistently better. Joanna’s range = 1. 62 – 1. 15 = 0. 47 Kirsty’s range = 1. 59 – 1. 30 = 0. 29 17 -Sep-20 Created by Mr. Lafferty 5
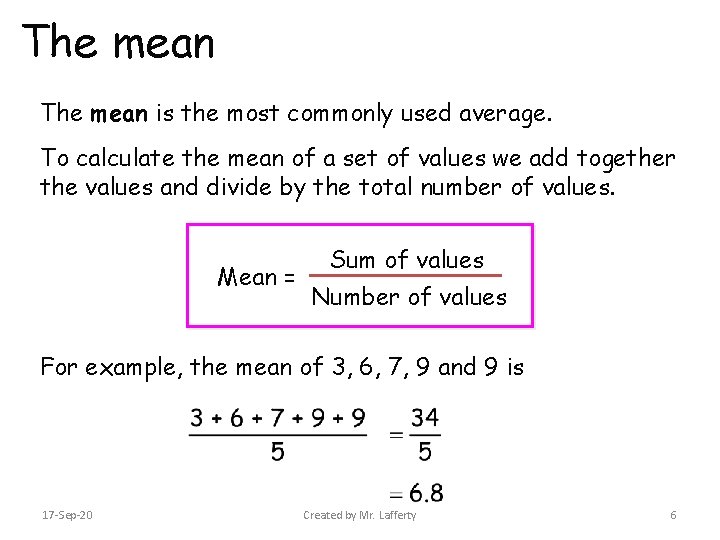
The mean is the most commonly used average. To calculate the mean of a set of values we add together the values and divide by the total number of values. Mean = Sum of values Number of values For example, the mean of 3, 6, 7, 9 and 9 is 17 -Sep-20 Created by Mr. Lafferty 6
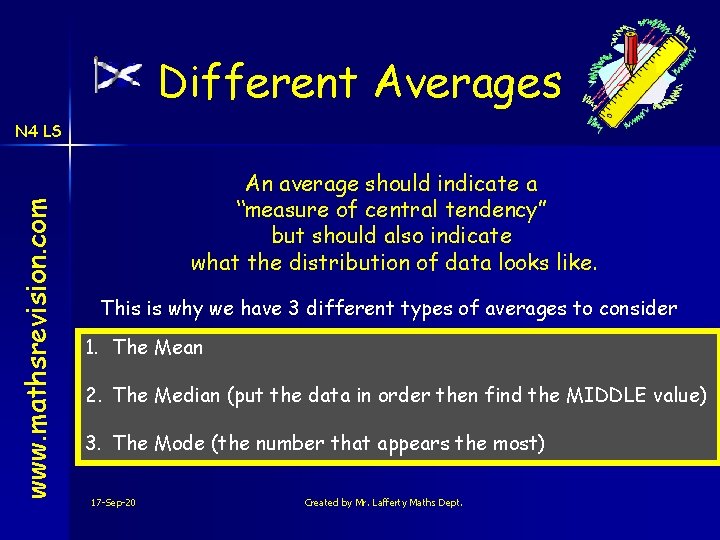
Different Averages www. mathsrevision. com N 4 LS An average should indicate a “measure of central tendency” but should also indicate what the distribution of data looks like. This is why we have 3 different types of averages to consider 1. The Mean 2. The Median (put the data in order then find the MIDDLE value) 3. The Mode (the number that appears the most) 17 -Sep-20 Created by Mr. Lafferty Maths Dept.
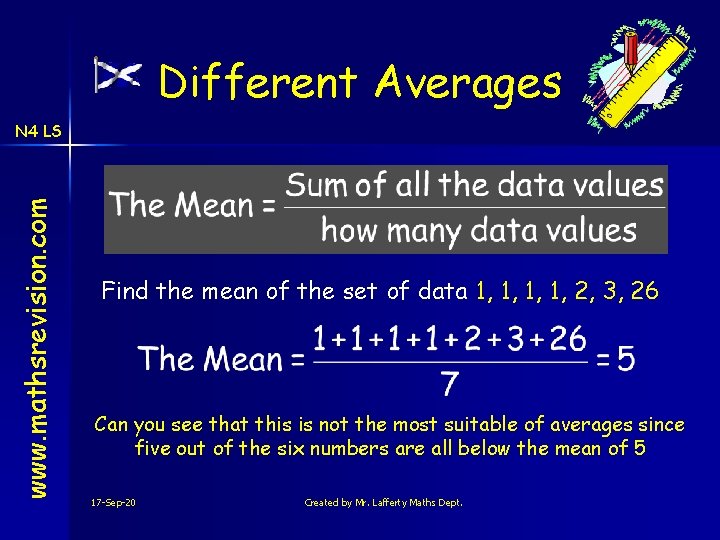
Different Averages www. mathsrevision. com N 4 LS Find the mean of the set of data 1, 1, 2, 3, 26 Can you see that this is not the most suitable of averages since five out of the six numbers are all below the mean of 5 17 -Sep-20 Created by Mr. Lafferty Maths Dept.
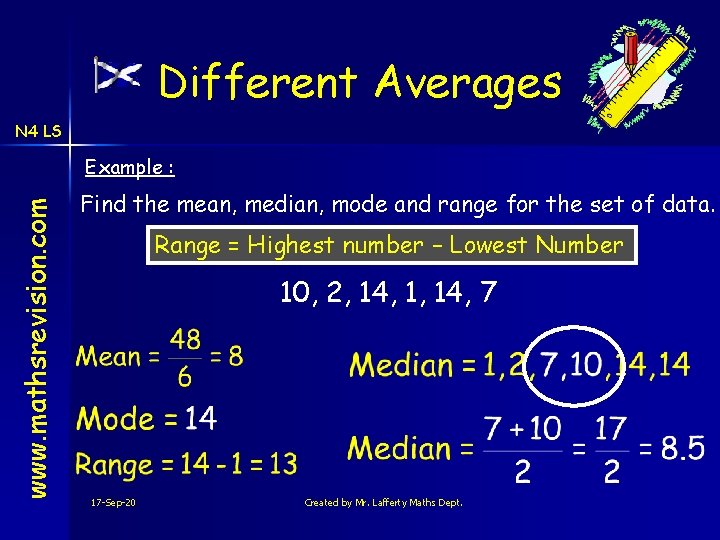
Different Averages N 4 LS www. mathsrevision. com Example : Find the mean, median, mode and range for the set of data. Range = Highest number – Lowest Number 10, 2, 14, 1, 14, 7 17 -Sep-20 Created by Mr. Lafferty Maths Dept.
Have you updated your Learning Log ? Different Averages www. mathsrevision. com N 4 LS Now Try TJ N 4 Lifeskills Exercise 1 & 2 Ch 30 (page 238) 17 -Sep-20 Created by Mr. Lafferty Maths Dept.
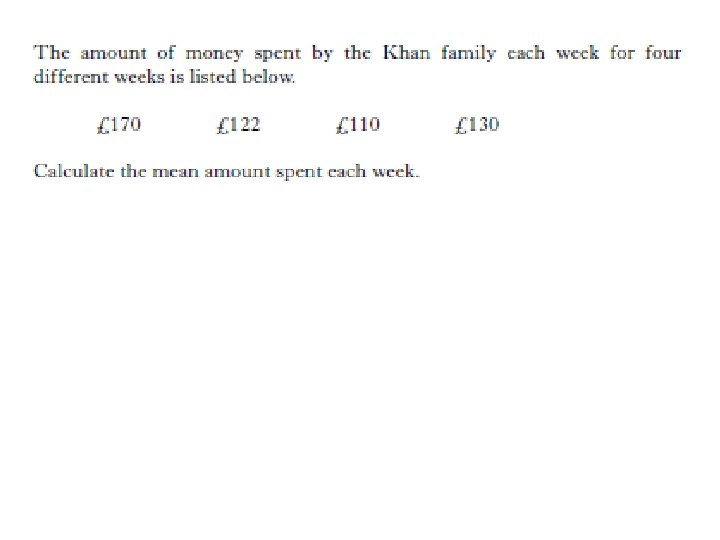
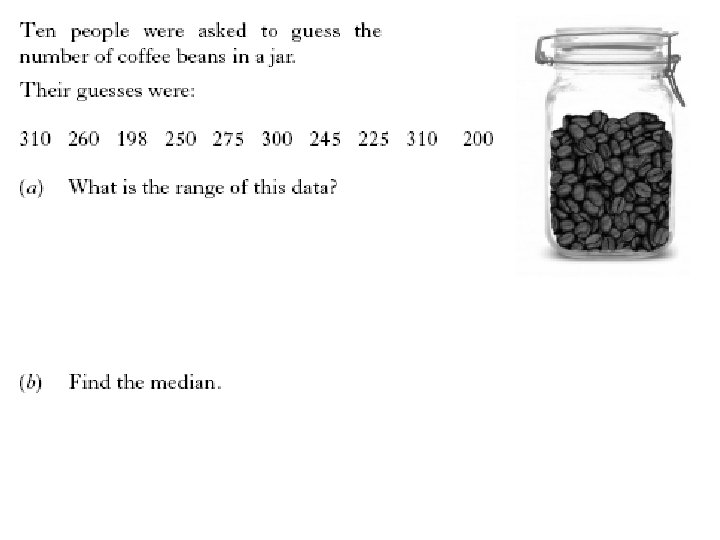
4 KU
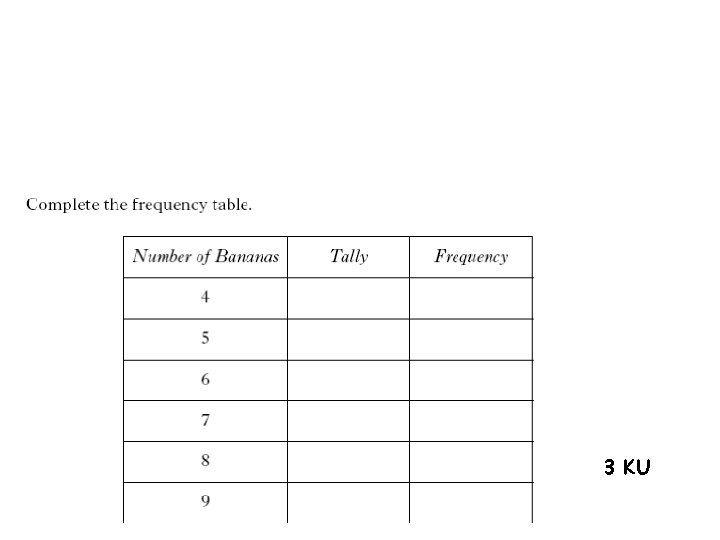
3 KU
1 KU
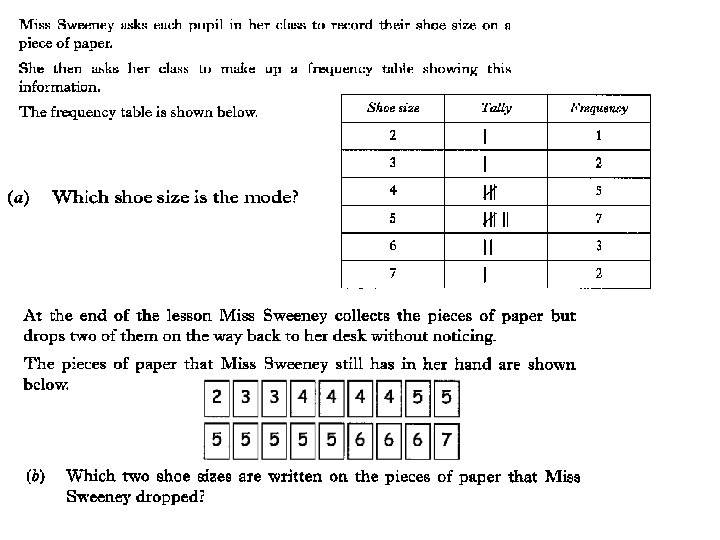
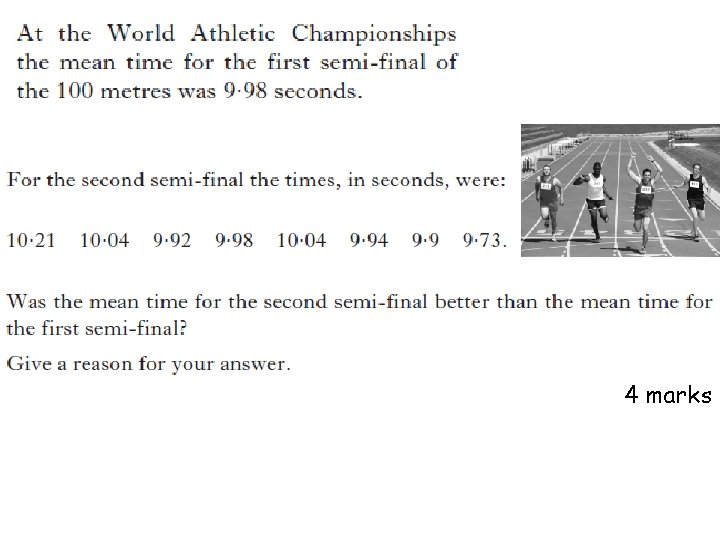
4 marks