COMPARING AFM SEM AND TEM FOR MEASURING DIMENSIONS


, TEM (center), and SEM")
, TEM (center), and SEM")


- Slides: 11
COMPARING AFM, SEM, AND TEM FOR MEASURING DIMENSIONS OF NANOPARTICLES
Nanoparticle properties are critically dependent on the dimensions of the nanoparticle, and the characterization of these dimensions is of equal importance. we summarize a publication comparing three different methods commonly applied to characterize the dimensions of nanoparticles. These methods include Atomic Force Microscopy (AFM), Scanning Electron Microscopy (SEM), and Transmission Electron Microscopy (TEM). In conclusion, the most appropriate technique depends on the sample type and the desired information to be measured. Researchers usually choose techniques based on the availability and familiarity of each method.
A Direct Comparison of Experimental Methods to Measure Dimensions of Synthetic Nanoparticles Resolution / Technique detection limit TEM AFM DLS 0. 1 nm a. b 1 nma (XY), 0. 1 nma (Z) 3 nmb Physical basis Environment Material sensivity Parameters measured Vacuum Increases with atomic number Size and shape Physical Vacuum / air Equal for all interaction / liquid materials with sample Size and shape Light scattering fluctuations due to diffusion Size only Scattering of electrons Liquid Depends on refractive index Table 1. Principle characteristics of the methods used.
Synthetic nanoparticles are studied for their potential use in applications including medical diagnostics and therapy, structural materials, environmental applications, and more. Nanoparticles exhibit sizedependent properties that are vastly different than their bulk constituents; for example the optical properties of metallic nanoparticles, magnetic properties of iron oxide nanoparticles, and optical properties of semiconductor nanocrystals (quantum dots), etc. Therefore, it is of utmost importance that the appropriate characterization techniques are used in order to fully understand a nanoparticle's structure-property relationship. In the case of quantum dots, a change in diameter on the order of 0. 3 nm results in a measurable change in optical properties. In the case of metallic nanoparticles, a change in size of a few nanometers results in an appreciable difference in optical absorption properties. In addition, nanoparticle interaction with biological entities such as cells and biomolecules can depend greatly on dimensions. For the purposes of this newsletter, we will compare the characterization of the dimensions of Silica (Fig. 1. ), Gold (Fig. 2. ) , and Polystyrene (Fig. 3. ) nanoparticles (two different sizes each) by atomic force microscopy (AFM), scanning electron microscopy (SEM), and transmission electron microscopy (TEM). To read the full report "A direct comparison of experimental methods to measure dimensions of synthetic nanoparticles" (2017),
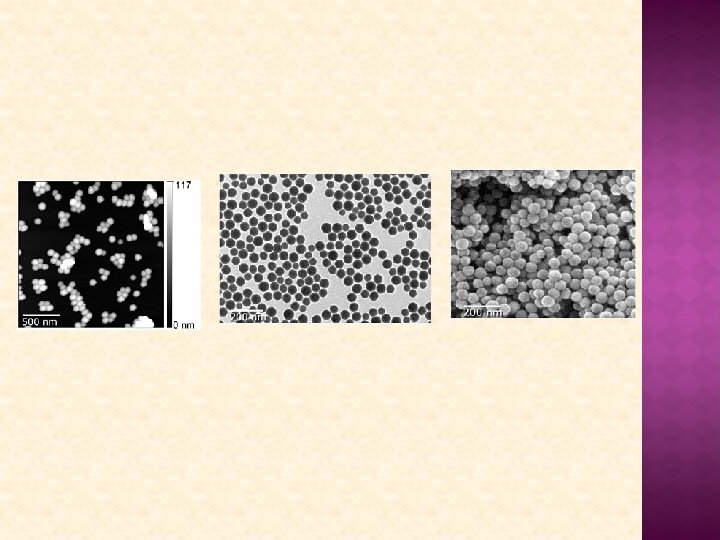
DISCUSSION In general, SEM presented the most difficulty obtaining images, and several imaging and sample preparation conditions were tested before optimal conditions were found. As for AFM and TEM, standard deposition methods were easily used, and imaging conditions were those commonly used for nanoparticle imaging. Obtaining high-quality images of uncoated polystyrene and silica nanoparticles proved difficult by SEM; in particular, the smaller particles were more affected by this, resulting in low-contrast scans. Images produced on uncoated samples were not of sufficient quality to perform accurate diameter measurements. To correct this, a thin layer of gold/palladium coating was used to improve image quality enough to enable measurements of the nanoparticle dimensions. Fig. 1. Examples of silica nanoparticle images from AFM (left), TEM (center), and SEM (right)
In Fig. 1, we see the same silica sample imaged by three different techniques (AFM, TEM, SEM), yielding very different overall appearances. All three techniques provided high quality images suitable for measurements of sample dimensions. On closer examination of Fig. 1, we see higher noise level in the SEM image than in the other two techniques. The AFM data is considerably different than the other two techniques in that it contains information in three spatial dimensions. With AFM, the height dimension (z axis) is typically used to determine the diameter of spherical particles due to probe-sample convolution (a systematic error when measuring in the lateral x-y dimensions). In addition, z axis data from AFM typically has lower noise levels and higher resolution than lateral dimensions. In the cases of SEM and TEM, dimensions are measured directly from the x-y distances in the images, thus lateral magnification is an important factor in optimizing resolution in the data obtained. High lateral magnification is not required for AFM, since dimensional data is measured exclusively in the z axis. This is why, when observing Figures 1, 2, and 3, the lateral dimensions of the AFM images are all greater than those found in the TEM and SEM images.
Fig. 2. Examples of gold nanoparticle images from AFM (left), TEM (center), and SEM (right). In Fig. 2, we see for gold, the smallest nanoparticle tested, SEM images are very noisy. This was found to be an issue regarding the size of the nanoparticle, rather than the material itself. Small nanoparticles contribute very little to the signal obtained by the SEM, resulting in low contrast in the image. For polystyrene nanoparticles (Fig. 3), similarly to silica, poor images were obtained with uncoated samples using SEM. Particularly, smaller uncoated nanoparticles were almost impossible to image, much less obtain dimensional measurements, using SEM and TEM. Using TEM, images displayed a type of negative contrast, where particles appear as "holes" against a darker surrounding medium (see Supplemental Information in the report for more detailed images and information).
Fig. 3. Examples of polystyrene nanoparticle images from AFM (left), TEM (center), and SEM (right).
CONCLUSION The most appropriate technique depends on the sample being imaged and the desired information to be obtained. All methods were able to characterize the samples, although metal coating was required to image with SEM to increase contrast and obtain accurate dimensional measurements; this introduced an error of up to 14 nm. SEM was least appropriate for small nanoparticles, out of the three techniques discussed in this newsletter. AFM was rather independent of nanoparticle material, delivering high contrast and signal-to-noise ratio on all samples. On the other hand, AFM can be sensitive to cleanliness of the sample being imaged. TEM offers the largest throughput, and is most desirable for rapid characterization of a large number of nanoparticles.
The smallest nanoparticle imaged in this work was 15 nm in diameter, although there an entire class of nanoparticles smaller than this. For example, quantum dots are typically nanocrystals which have a diameter below 6 nm. Both AFM and TEM are capable of adequately characterizing these nanoparticles. Which technique a researcher chooses often depends on the availability and familiarity with the methods. In general, there are more SEM installed than AFM worldwide; additionally, TEM costs about double the price of SEM, and twenty times that of AFM. The higher cost and high maintenance of SEM mean that access to them can be difficult. In terms of availability and cost, AFM is the best option. It is recommended that researchers determine the type of information they wish to obtain and the appropriateness of techniques to particular samples, with special consideration given to nanoparticle size. In general, a combination of methods, with careful interpretation of the data is the best option.