
Comparative Payback of LithiumIon Batteries for Pacific NW
Comparative Payback of Lithium-Ion Batteries for Pacific NW Ferries December 16, 2016 Presented by Will Ayers, P. E. Chief Electrical Engineer Elliott Bay Design Group
Introduction • Advantages of lithium-ion batteries for marine applications ▫ High energy density ▫ High power density ▫ High cycle life ▫ Redundancy = safety ▫ Increased efficiency ▫ ▫ ▫ �Optimized load on diesel engines �Excels with highly variable loads, dynamic positioning (DP) Reduced emissions Increased compliance within an Emission Control Area (ECA) Reduced carbon emissions taxes or Increased carbon emissions credits Compatibility with solar or wind
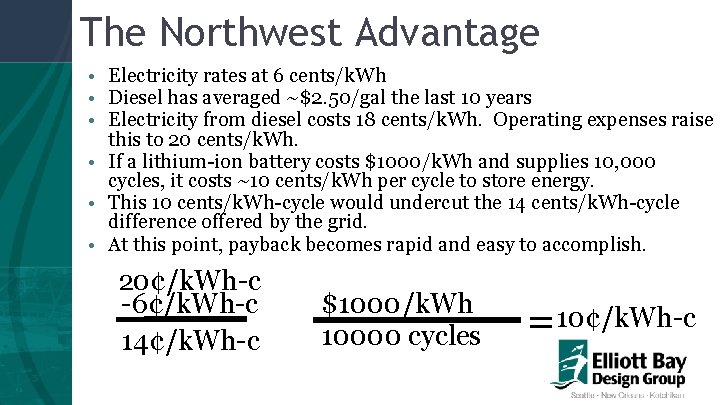
The Northwest Advantage • Electricity rates at 6 cents/k. Wh • Diesel has averaged ~$2. 50/gal the last 10 years • Electricity from diesel costs 18 cents/k. Wh. Operating expenses raise this to 20 cents/k. Wh. • If a lithium-ion battery costs $1000/k. Wh and supplies 10, 000 cycles, it costs ~10 cents/k. Wh per cycle to store energy. • This 10 cents/k. Wh-cycle would undercut the 14 cents/k. Wh-cycle difference offered by the grid. • At this point, payback becomes rapid and easy to accomplish. 20¢/k. Wh-c -6¢/k. Wh-c 14¢/k. Wh-c $1000/k. Wh 10000 cycles = 10¢/k. Wh-c
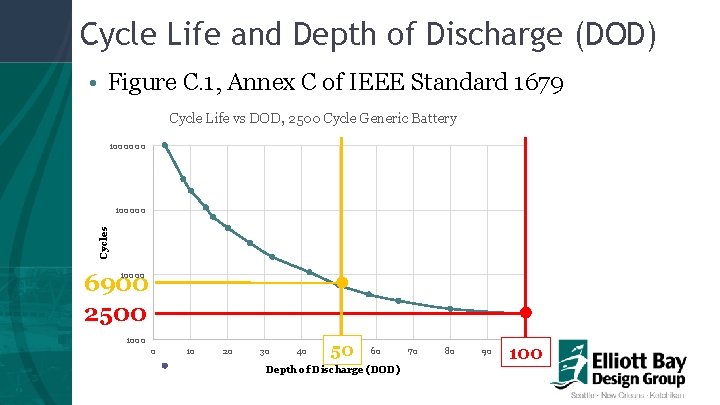
Cycle Life and Depth of Discharge (DOD) • Figure C. 1, Annex C of IEEE Standard 1679 Cycle Life vs DOD, 2500 Cycle Generic Battery 1000000 Cycles 100000 6900 2500 1000 0 10 20 30 40 50 50 60 Depth of Discharge (DOD) 70 80 90 100
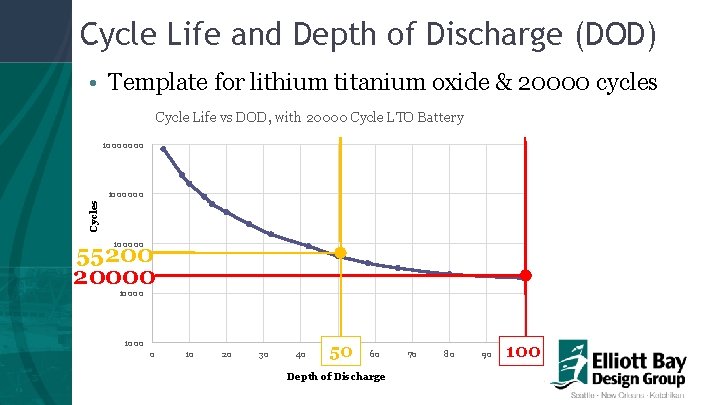
Cycle Life and Depth of Discharge (DOD) • Template for lithium titanium oxide & 20000 cycles Cycle Life vs DOD, with 20000 Cycle LTO Battery 10000000 Cycles 1000000 100000 55200 20000 6900 2500 1000 0 10 20 30 40 50 50 60 Depth of Discharge 70 80 90 100
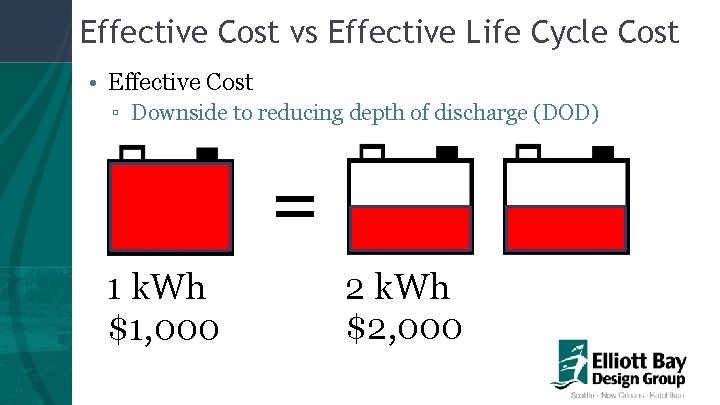
Effective Cost vs Effective Life Cycle Cost • Effective Cost ▫ Downside to reducing depth of discharge (DOD) = 1 k. Wh $1, 000 2 k. Wh $2, 000
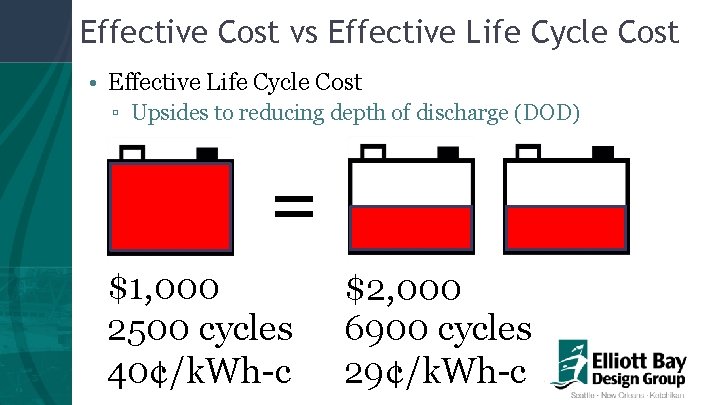
Effective Cost vs Effective Life Cycle Cost • Effective Life Cycle Cost ▫ Upsides to reducing depth of discharge (DOD) = $1, 000 2500 cycles 40¢/k. Wh-c $2, 000 6900 cycles 29¢/k. Wh-c
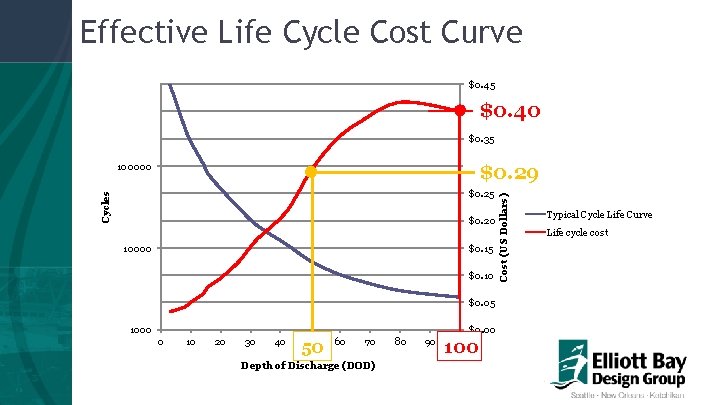
Effective Life Cycle Cost Curve $0. 45 $0. 40 $0. 35 100000 $0. 30 Cycles $0. 25 $0. 20 10000 $0. 15 $0. 10 $0. 05 1000 $0. 00 0 10 20 30 40 50 50 60 70 Depth of Discharge (DOD) 80 90 100 Cost (US Dollars) $0. 29 Typical Cycle Life Curve Life cycle cost
Assumptions • • New diesel electric vessel vs. battery powered vessel Similar to large WSF vessel Low weight impact from batteries Battery bank needs: ▫ ▫ 2000 k. Wh to make a one-way crossing Full recharge after each crossing 18 charge/discharge cycles per day At 100% DOD, need four 500 k. Wh racks in four battery rooms • The battery room structural costs of this new vessel will be offset by savings in other structural costs such as engine room spaces. • Diesel generators will be retained as spinning reserve. ▫ Not included as a cost differential.
Vessel and Shore-side Costs and DOD • Costs Scaled with Reducing DOD: ▫ Battery total capital cost ▫ Greater space needed to store batteries ▫ Support system costs go up: �Air or water cooling systems start at $50, 000/room �Fire suppression start at $50, 000/room • Fixed Costs: ▫ Shore power charging to cost $1, 000 �Costs determined by the time frame and kilowatt (k. W) throughput �At 20 minutes, a 6000 k. W charging system is needed.
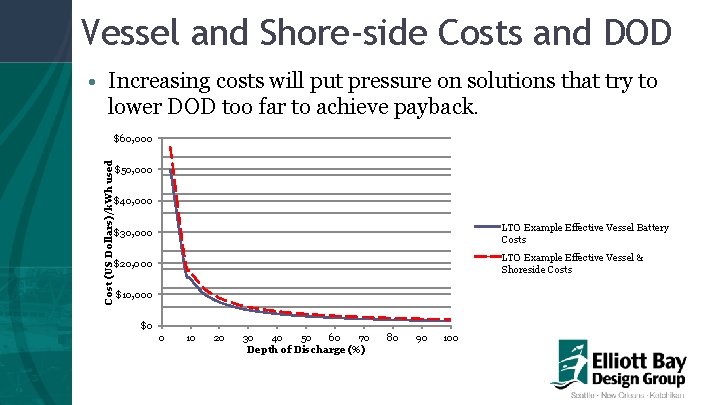
Vessel and Shore-side Costs and DOD • Increasing costs will put pressure on solutions that try to lower DOD too far to achieve payback. Cost (US Dollars)/k. Wh used $60, 000 $50, 000 $40, 000 $30, 000 LTO Example Effective Vessel Battery Costs $20, 000 LTO Example Effective Vessel & Shoreside Costs $10, 000 $0 0 10 20 30 40 50 60 70 Depth of Discharge (%) 80 90 100
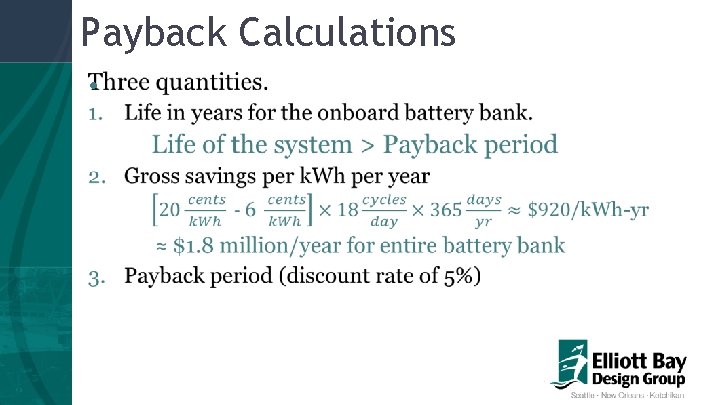
Payback Calculations •
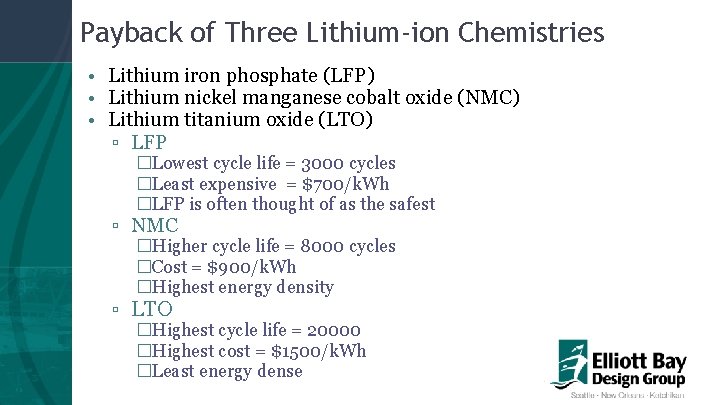
Payback of Three Lithium-ion Chemistries • Lithium iron phosphate (LFP) • Lithium nickel manganese cobalt oxide (NMC) • Lithium titanium oxide (LTO) ▫ LFP �Lowest cycle life = 3000 cycles �Least expensive = $700/k. Wh �LFP is often thought of as the safest ▫ NMC �Higher cycle life = 8000 cycles �Cost = $900/k. Wh �Highest energy density ▫ LTO �Highest cycle life = 20000 �Highest cost = $1500/k. Wh �Least energy dense
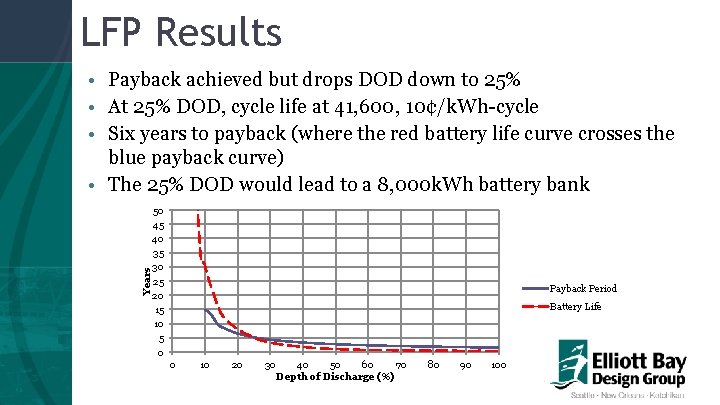
LFP Results Years • Payback achieved but drops DOD down to 25% • At 25% DOD, cycle life at 41, 600, 10¢/k. Wh-cycle • Six years to payback (where the red battery life curve crosses the blue payback curve) • The 25% DOD would lead to a 8, 000 k. Wh battery bank 50 45 40 35 30 25 20 15 10 5 0 Payback Period Battery Life 0 10 20 30 40 50 60 70 Depth of Discharge (%) 80 90 100

NMC Results Impressive payback at 45% DOD At 45% DOD, cycle life at 27, 000, 10¢/k. Wh-cycle Three and a half years to payback The 45% DOD leads to a 4, 400 k. Wh battery bank. NMC’s energy density means a smaller bank vs LFP or LTO at the same size Years • • 50 45 40 35 30 25 20 15 10 5 0 Payback Period Battery Life 0 10 20 30 40 50 60 70 Depth of Discharge (%) 80 90 100
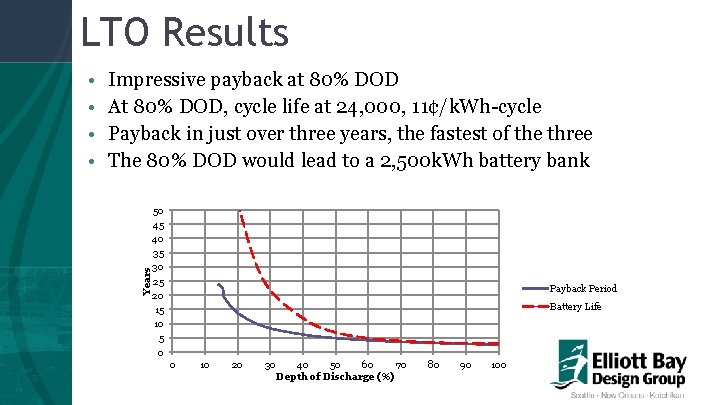
LTO Results Impressive payback at 80% DOD At 80% DOD, cycle life at 24, 000, 11¢/k. Wh-cycle Payback in just over three years, the fastest of the three The 80% DOD would lead to a 2, 500 k. Wh battery bank Years • • 50 45 40 35 30 25 20 15 10 5 0 Payback Period Battery Life 0 10 20 30 40 50 60 70 Depth of Discharge (%) 80 90 100

Financial Dividends • Battery pack replacements: ▫ ▫ Fairly frequent The first pack pays off the shore power charging system Subsequent battery pack replacements achieve significant savings Example LTO system at 80% DOD after initial payback �Operating another 30 years replacing batteries every 3 years �Saves $590, 000/year �Total of $17. 7 million.
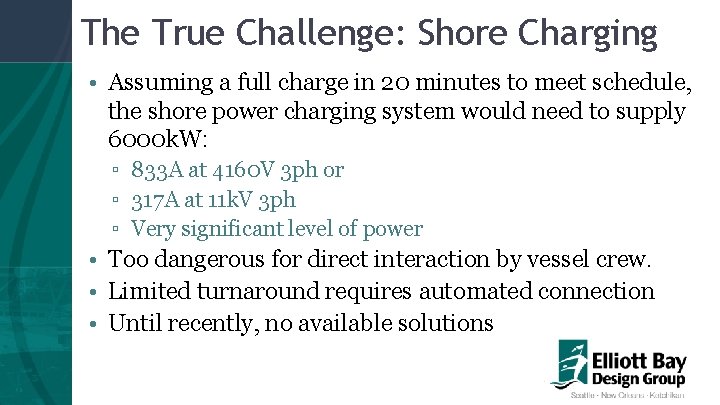
The True Challenge: Shore Charging • Assuming a full charge in 20 minutes to meet schedule, the shore power charging system would need to supply 6000 k. W: ▫ 833 A at 4160 V 3 ph or ▫ 317 A at 11 k. V 3 ph ▫ Very significant level of power • Too dangerous for direct interaction by vessel crew. • Limited turnaround requires automated connection • Until recently, no available solutions
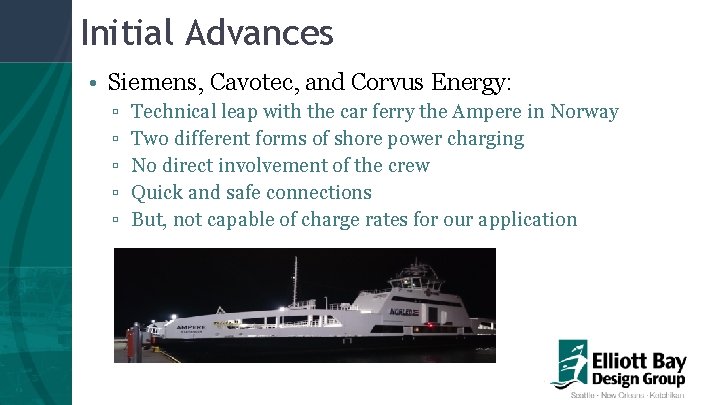
Initial Advances • Siemens, Cavotec, and Corvus Energy: ▫ ▫ ▫ Technical leap with the car ferry the Ampere in Norway Two different forms of shore power charging No direct involvement of the crew Quick and safe connections But, not capable of charge rates for our application
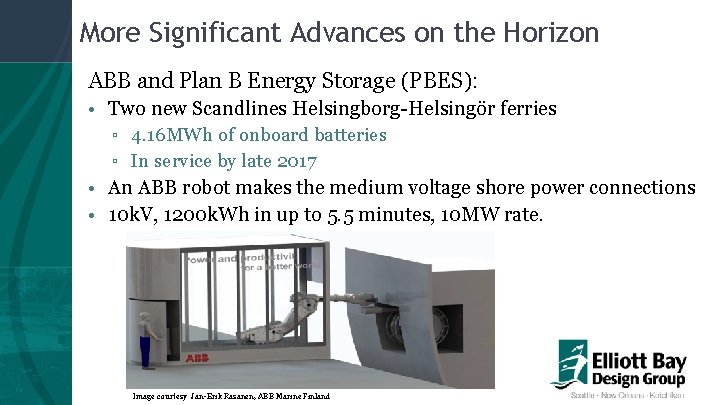
More Significant Advances on the Horizon ABB and Plan B Energy Storage (PBES): • Two new Scandlines Helsingborg-Helsingör ferries ▫ 4. 16 MWh of onboard batteries ▫ In service by late 2017 • An ABB robot makes the medium voltage shore power connections • 10 k. V, 1200 k. Wh in up to 5. 5 minutes, 10 MW rate. Image courtesy Jan-Erik Räsänen, ABB Marine Finland
More Significant Advances on the Horizon Wartsila and Cavotec: • Magnetic resonance coupling concept ▫ No connection required ▫ High frequency AC ▫ Inductive charging across short air gap �two transformer coils, on shore and on vessel ▫ Also will allow high rate medium voltage charging
In Summation • The current state of lithium-ion battery technology can achieve a watershed event in the marine world. • Increased safety, energy capacity, and cycle life is provided at reduced cost. • Replacing diesel electricity with battery-stored shore power yields rapid payback. • The lone remaining challenge will soon fall by the wayside, that being the limitation of shore power charging systems. • The ferry fleets and other short-haul vessel applications in the region of the Pacific Northwest should be actively pursued for widespread electrification of propulsion.
Questions/Comments? For additional information: Will Ayers, 206 -204 -1344 (Seattle Office) Email: wayers@ebdg. com Website: http: //www. ebdg. com
- Slides: 23