COMPARATIVE GRAPHICAL METHOD POPULATION BIRTHS DEATHS IMMIGRATION EMIGRATION

COMPARATIVE GRAPHICAL METHOD ∆ POPULATION = BIRTHS – DEATHS + IMMIGRATION – EMIGRATION

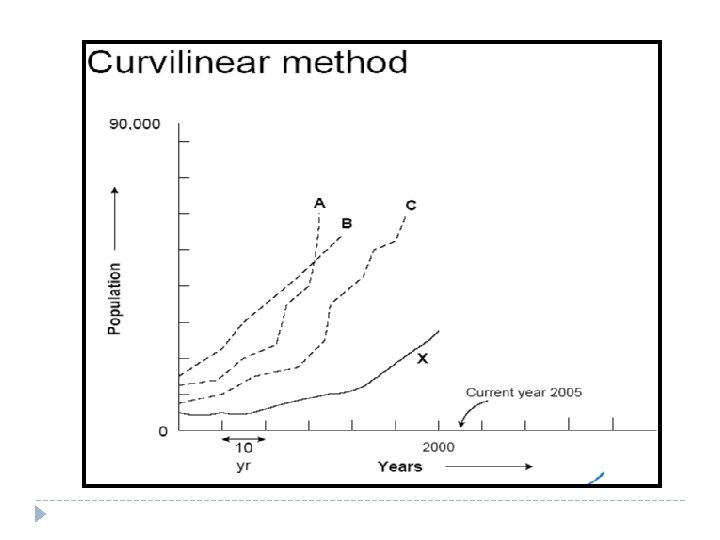
GRAPHICAL COMPARATIVE METHOD = CURVILINEAR METHOD

Graphical Comparative Forecasting Comparative forecast = study several developed areas having similar characteristics in common with the study area. The differences and similarities between the study area and each of the developed areas are examined. An average population curve is developed. This "cumulative" curve = the population growth that is used in projecting the total population in the study area.

STUDY CITY A P O P U L A T I O N B C A D E YEARS

-Long term method -Graphically estimate future population based on recorded growths of larger cities Assumptions: �The population of the city of study has similar growth patterns as other cities. �City of study and cities of comparisons should be similar in terms of geographical proximity, economic base, climate, culture, natural resources, transportation system etc.

In practice, the forecaster chooses a city which has similar characteristics and is already further developed than his study area. i. e. use data for other cites from the point at which they reached the current population of the design city/area.
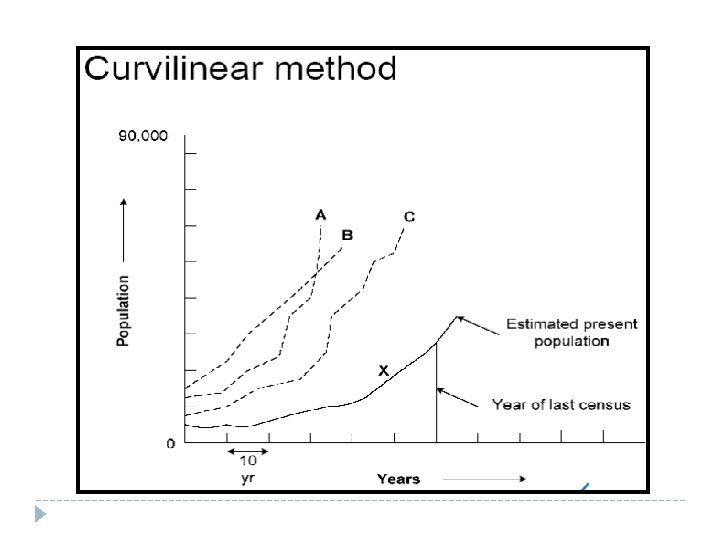
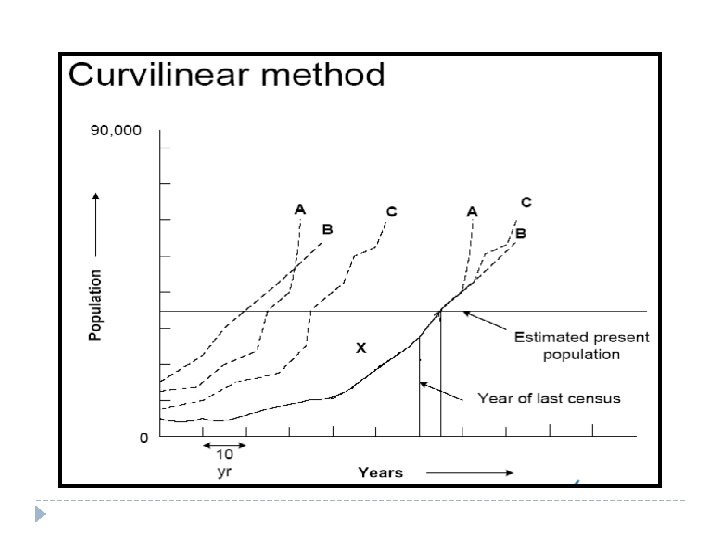
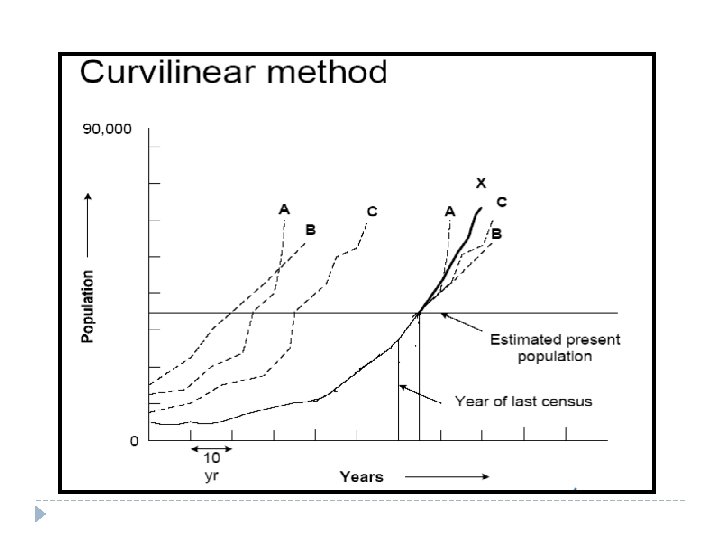

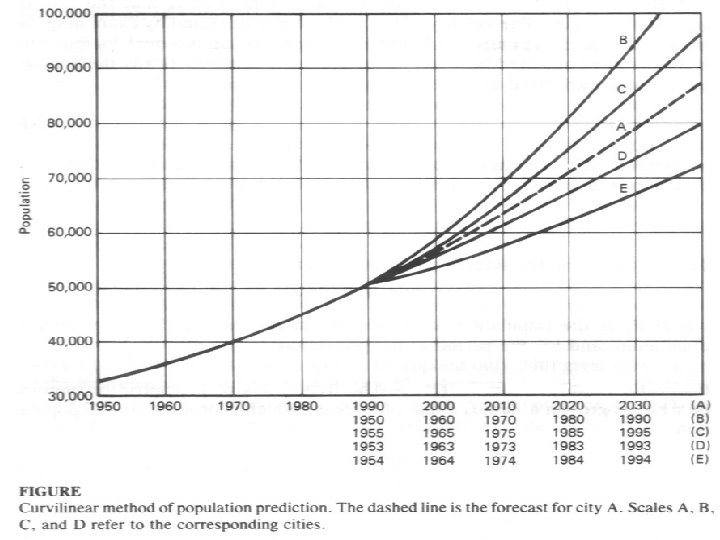
Example City A’s population was 51, 000 in 1990. 2. City B, C, D and E’s population are plotted from the year in which it reached 51, 000. 3. City A’s population is projected as the average recorded growth of the comparison cities. 1.

LIMITATIONS • In practice, it is difficult to find similar cities. • More • It complex method is doubtful that two urban areas that are sufficiently alike, but developing at different periods in history would follow same patterns of growth. • The comparative method may still have same value in forecasting population for small areas.
- Slides: 13