Comparative Economic Systems and Centrally Planned Economies Course


 17")


 and")


")


 as a % of")
 as a % of GDP")


 • cuts in government expenditure")


, weak authoritarian regimes (Central Asia, Azerbaijan, Belarus), strong democratic")


 and the ratio of investment climate to democratization, 1972")


 in 1975")


- Slides: 125
Comparative Economic Systems and Centrally Planned Economies Course outline • Transformational recession. Transition strategies and performance. • Transition economies in the framework of comparative economic systems. • Review of turning points in Soviet economic history – War Communism, NEP, Command economy, Industrialisation Debate. • Soviet economic statistics. Was the transition to the command economy inevitable? • CPEs: industrial organisation and structural inefficiencies. • Prices, labor market, finance, credit, external economic relations in CPE.
Shock therapy vs. gradualism. Transformational recession • Economic performance of transition economies • Shock therapy and gradualism • Theory of transformational recession; growth theory in transition economies • Distortions in industrial structure and trade patterns • Institutions, rule of law and democracy
GDP change in EE economies and Mongolia, 1989 = 100%
GDP change in FSU economies, 1989 = 100%
GDP change in Asian transition economies, 1989=100%
Economic performance of transition economies • Almost all transition economies have experienced a recession associated with reforms • Exceptions: China and Vietnam 1996 GDP as a % of 1989 GDP Albania 87 Romania 88 Belarus 63 Russia 57 Bulgaria 68 Slovakia 90 China* 189 Slovenia 96 Czech Republic 89 Turkmenistan 57 Estonia 69 Ukraine 42 Hungary 86 Uzbekistan 84 Kazakhstan 45 Vietnam 156 Kyrgyzstan 52 Armenia 39 Latvia 52 Azerbaijan 38 Lithuania 42 Croatia 70 Moldova 35 Georgia 31 Mongolia 83 Macedonia FYR 56 Tajikistan 37 Poland 104 * For China - all indicators are for the period 10 years earlier.
Table. Changes in life expectancy at birth in 16 transitional economies of Europe, 1989 -2000 Source: Cornia (2004) - MONEE database (www. unicef-icdc. org) Male Life Expectancy at Birth Maximum LEB Loss since 1989 Czech R. … Female Life Expectancy at Birth LEB Change, 1989 -2000 LEB Change, 1989 -91 Maximum LEB Loss/ Gain since 1989 LEB Change, 1989 -2000 +3. 5 -0. 6 n. a. +2. 9 Slovakia . . . +2. 3 -0. 2 n. a. +2. 0 Poland . . . +3. 0 -0. 7 n. a. +2. 5 Hungary . . . +1. 7 -0. 4 n. a. +1. 8 Slovenia n. a. +3. 1 +0. 7 n. a. +2. 4 . . . +0. 7* -0. 9 n. a. +2. 0* Bulgaria -1. 5 (1996) -0. 5 -0. 6 -0. 7 (1997) +0. 2 Romania -1. 3 (1997) +0. 5 0. 0 n. a. +1. 8 Estonia -4. 0 (1994) -0. 6 -1. 3 -1. 6 (1994) +1. 4 Latria -4. 5 (1994) -0. 4 -1. 4 -2. 3 (1994) +0. 8 Lithuania -3. 3 (1994) +0. 8 -0. 6 -1. 4 (1994) +1. 9 -4. 6 (1999) -3. 4 -0. 3 -2. 6 (1999) -1. 7 Moldova -3. 7 (1995) -1. 6 -1. 2 -2. 6 (1995) -1. 1 Russia -6. 6 (1994) -5. 2 -0. 7 -3. 3 (1994) -2. 3 Ukraine -5. 0 (1996) -3. 6 -2. 0** -2. 3 (1995) -1. 4 -5. 5 (1995) -4. 1 -1. 3 -3. 6 (1995) -1. 8 GDR Belarus Kazakstn
Deaths from external causes – murders, suicides, accidents
Murder rate increased in most countries during transition
VIOLENCE: increase in crime and murder rates • RUSSIA: by the mid 1990 s the murder rate was over 30 people per 100, 000 of inhabitants • 1 -2 persons in Western and Eastern Europe, Canada, China, Japan, Mauritius and Israel; • Only two countries in the world had higher murder rates – South Africa and Colombia; • In Brazil or Mexico this rate is two times lower; • The US murder rate, the highest in developed world – 6 -7 people per 100, 000 of inhabitants – pales in comparison with the Russian one.
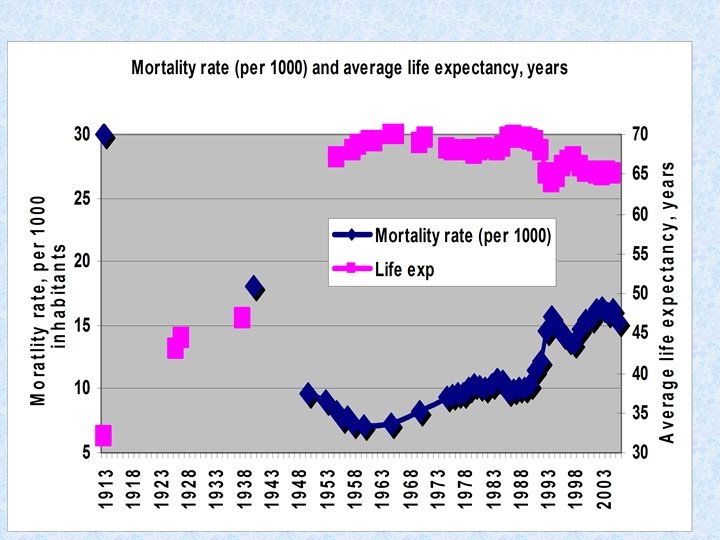
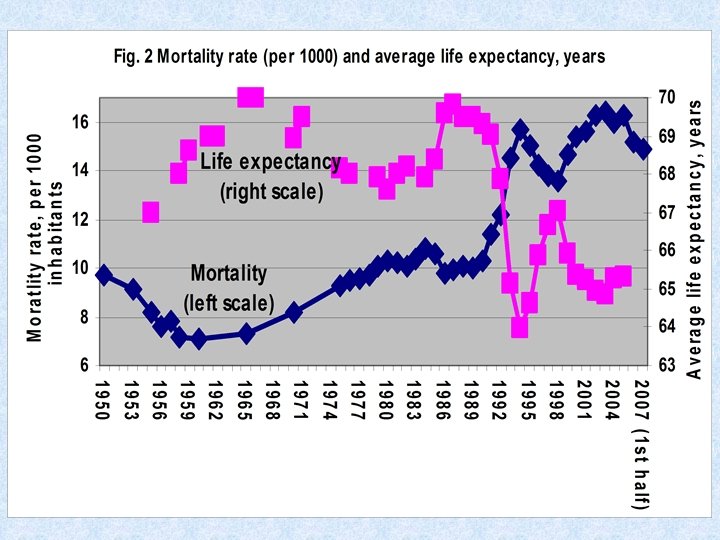
Crime and mortality rates in Russia grew during transition
Table. Number of deaths from external causes per 100, 000 inhabitants in 2002 – countries with highest rates *Deaths due to unidentified external causes, wars, police operations, executions. Totals may differ slightly from the sum of components due to rounding. Source: WHO (http: //www. who. int/entity/healthinfo/statistics/bodgbddeathdalyestimates. xls )
Increase in income inequalities in transition economies (source: Milanovic, 1998) 17
Transformational recession • In Central Europe recession lasted for 2 -3 years (as during the Great Depression!), output declined by 20 -30%; pre-reform level of output was reached after 10 years of transition • In CIS recession lasted for 5 -10 years, output declined by about 50%; pre-reform level is expected to be reached after 15 -25 years of transition (in Russia - 2009)
Shock therapy vs. gradualism • Shock therapy: radical reforms and rapid transformation • Examples: Vietnam, East European (especially Central European countries and Baltic states • Gradualism: step by step approach to economic transformation • Examples: China, Russia (1987 -91), Hungary (before 1991)
Shock therapy: features • Instant deregulation of prices; introduction of convertibility of national currency • Macroeconomic stabilization (bringing down inflation to less than 40% a year in 6 months) • Cut subsidies from 10 -15% GDP to 2 -3% GDP during 1 -2 years • Privatization of 50% property during 2 -3 years
Shock therapy: arguments • Rapid liberalization allows to avoid painful and costly period, when the old centrally planned economy (CPE) is not working already, while the new market one is not working yet. - “One cannot cross the abyss in two jumps” • Fast liberalization ensures irreversibility of reforms ================= East European countries and Baltic states were fast liberalizers and successful stabilizers, while their CIS counterparts were doing much worse
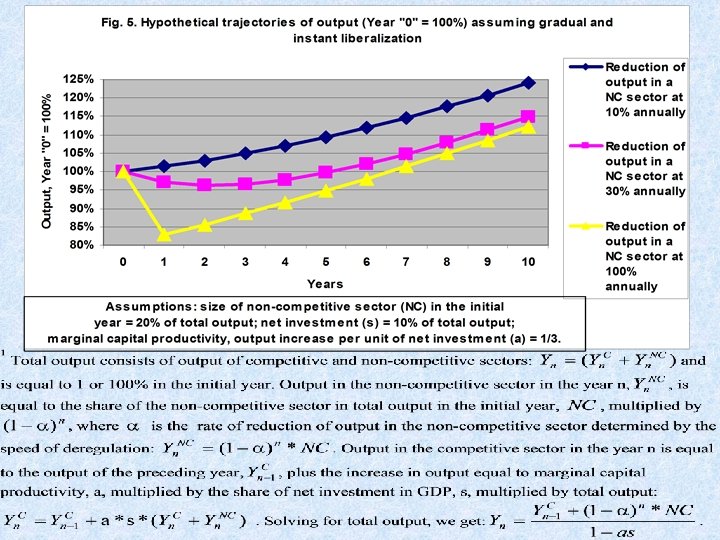
Gradualism: arguments • Protection of property rights is essential for growth; privatization creates uncertainty with property rights; institutional vacuum may have a devastating impact on output • Resources need to be re-allocated from noncompetitive to competitive sectors, which may take considerable time • For senior citizens even a temporary decline in real incomes is not acceptable; guarantees for transfers are needed =============== Chinese strategies of “dual track price system” and “growing out of socialism” proved to be successful
Magnitude of recession: conventional explanation • Number of studies undertaken to prove that fast liberalization and macro-stabilization pays off and leads to better performance • Conventional wisdom summarized in the 1996 World Development Report From Plan to Market: differences in economic performance were associated mostly with "good and bad" policies, in particular with the progress in liberalization and macroeconomic stabilization: • “Consistent policies, combining liberalization of markets, trade, and new business entry with reasonable price stability, can achieve a great deal even in countries lacking clear property rights and strong market institutions” (WDR 1996, p. 142)
Magnitude of recession: conventional explanation (from the article of A. Illarionov – economic adviser to the president of Russia in 20002005) • Low growth rates of money supply => high growth of output
Magnitude of recession: conventional explanation • Low rates of inflation => high growth of output
Magnitude of recession: conventional explanation • Low share of state sector in output => high growth of output
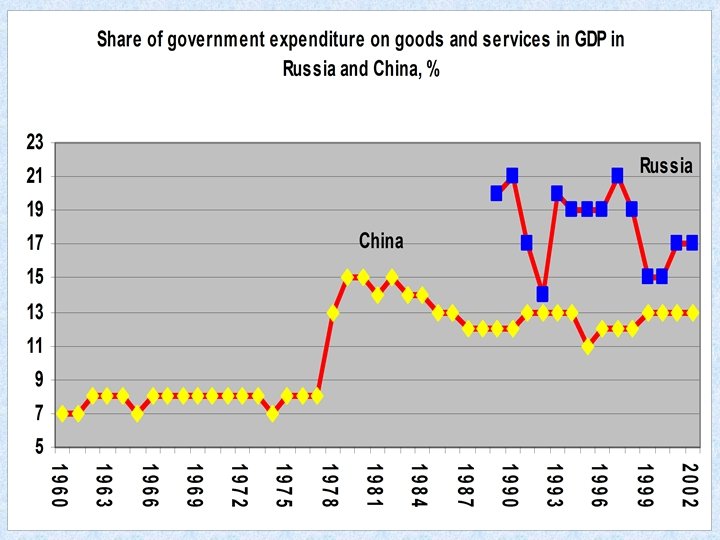
Magnitude of recession: conventional explanation • Low share of government spending in GDP => high growth of output
Magnitude of recession: conventional explanation • Low taxes on export and import => high growth of output
Magnitude of recession: conventional explanation The secret of high growth – low inflation, small state, open economy
Magnitude of recession: conventional explanation Liberalization indices from EBRD
Magnitude of recession: conventional explanation - greater liberalization=> better performance
Magnitude of recession: conventional explanation - greater liberalization=> better performance
Magnitude of recession: conventional explanation - lower inflation => better performance
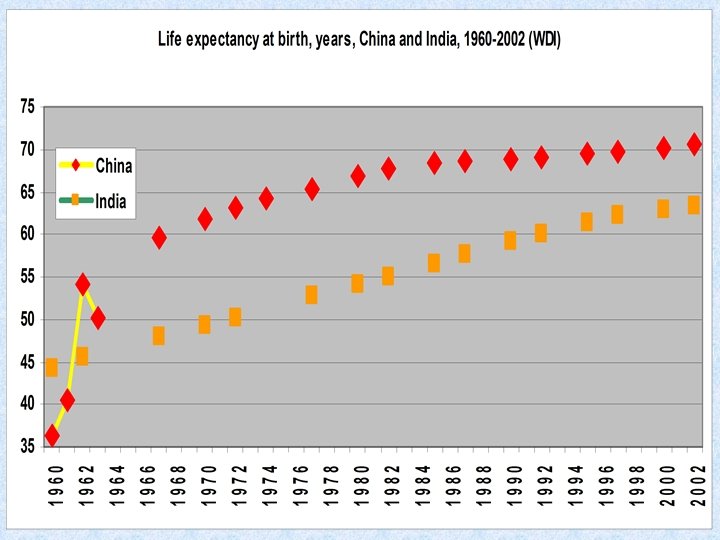
Does liberalization matter? • Vietnam and China are similar in initial conditions and in transition results (immediate growth of output without transformational recession) despite different reform strategies: • Chinese reforms are the classical example of gradualism • Vietnamese reformers introduced shock therapy treatment (instant deregulation of most prices and introduction of convertibility of dong) in 1989 • Differing performance of the former Soviet Union (FSU) states: • Baltic states are the champions of liberalization and stabilization in the region. In the Baltic output fell in the early 1990 s by 36 -60% and even in 1996, two years after the bottom of the recession was reached, was still 31% to 58% below the pre-recession maximum. • Uzbekistan is commonly perceived to be one of the worst procrastinators. However in Uzbekistan the reduction of output in 1990 -95 totaled only 18% and the economy started to grow again in 1996 • In 2005 the highest GDP as a % of 1989 was in Uzbekistan, Belarus, Kazakhstan, Estonia, Turkmenistan, Azerbaijan (all, except Estonia, are not fast reformers)
Indices of economic freedom and GDP growth in Russia and China
Positive relationship between liberalization and performance is just the result of the difference in the magnitude of the recession in EE countries, as a group, and FSU states, also as a group
Russia was leading in economic liberalization, while Belarus was lagging
But Belarus and Uzbekistan are doing better (even though they are net importers of fuel), not to mention net exporters like Azerbaijan, Kazakhstan, Turkmenistan
Russian growth is lagging behind that of oil exporters and some oil importers
Explaining the magnitude of recession • Transformational recession is viewed as a structural adjustment process resulting from the need to overcome disproportions inherited from the centrally planned economy: • high defense expenditure; • over-industrialization and underdevelopment of the service sector; • external trade distortions: "under-openness" of the economy, the perverse structure of trade among former Soviet republics and among socialist countries; • micro-level distortions (e. g. associated with the size and specialization of enterprises).
Adverse supply shock: deterioration of terms of trade in non-resource industries
High defense expenditure and fall in output resulting from conversion: weak correlation, excluding the outliers
Over-industrialization: Share of industry in GDP
Differences in productivity by sectors of the economy
Distortions in industrial structure
Distortions were measured as deviations in the shares of industry, agriculture and services in GDP, as compared to "normal" structure, defined as an average industrial structure for market economies with similar levels of per capita GDP
External trade distortions
Distortions in industrial structure and external trade and GDP change in 1989 -96
Distortions in industrial structure and trade patterns as a % of GDP in the late 1980 s (for China - late 1970 s)
Distortions in industrial structure and trade patterns as a % of GDP in the late 1980 s (continued)
Calculation of the indexes of distortions in industrial structure and trade patterns • • • Distortions in the share of defense expenditure are equal to the actual share of defense expenditure in GDP minus 3. 7% (considered as the "normal" level). For the republics of the FSU the share of defense expenditure in GDP is estimated from the breakdown of the employment in Soviet defense industries by republics and the share of republics in Soviet net material product Distortions in industrial structure are computed as the sum of deviations of the share of each of three sectors (agriculture, industry, services) in GDP from the "normal" level - all deviations were taken with the positive sign and divided by two; "normal" level was defined as the average for the group of market economies with comparable PPP GDP per capita Distortions in trade openness are equal to the "normal" share of external trade in GDP (defined in a similar way - as an average share for the group of market economies with comparable population and GDP per capita) minus the actual share divided by two. Distortions in trade within FSU are equal to exports plus imports from former Soviet republics as a share of GDP divided by two (for non-FSU countries these distortions are assumed to be equal to zero). Distortions in trade with socialist countries are equal to the sum of export to and import from socialist countries (trade between Czech and Slovak Republics and among former Yugoslav republics is also included) as a share of GDP divided by two. These latter distortions are included into the computation of total trade and industrial structure distortions with a weight of 33%.
Large enterprises faced greater adjustment problems and had to undergo greater restructuring
The advantages of backwardness
The advantages of backwardness: example Distortions in industrial structure (militarization, over-industrialization, etc. ) and distortions at the micro level (the size and specialization of enterprises) are more difficult to overcome, if they are embodied in fixed assets, and if these fixed assets are sizeable compared to GDP. USSR K/Y China 3 1 Share of inefficient capital (to be replaced) as a % of K 50% Share of inefficient capital (to be replaced) as a % of Y 150% 10% 15 5 I/Y Number of years needed to replace inefficient capital
Evaluating the impact of non-policy and policy factors-1
Evaluating the impact of non-policy and policy factors-2
Evaluating the impact of non-policy and policy factors-3 • Though there is a positive relationship between the magnitude of output decline on the one hand the liberalization index and inflation on the other, this weakens or even disappears once variables that characterize objective conditions are factored in • Nearly 70% of the variations in the magnitude of the decline of output may be explained by only two dummy variables: membership in the FSU and wars • Inflation variable is always significant and has the predicted (negative) sign • Results suggest that the usual argument linking the better performance of EE as compared to the FSU, to better economic policies (greater liberalization) does not necessarily hold
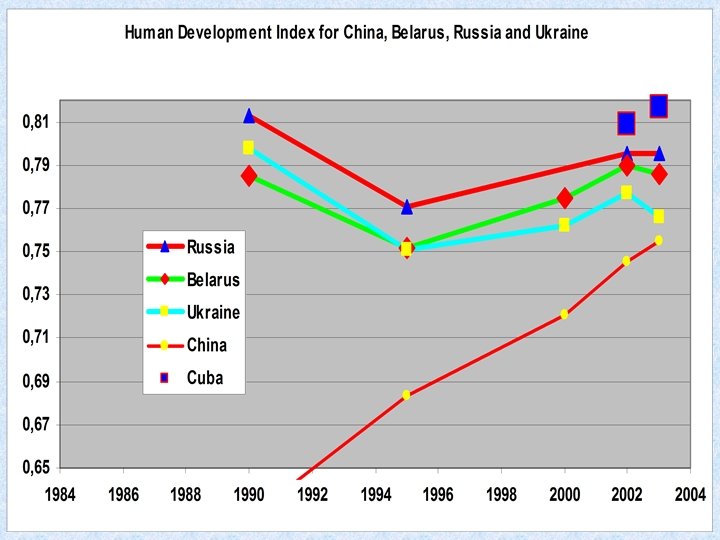
Consider Cuba – no major market type reforms, but a recession nevertheless. Why? Because of supply-side shock – deterioration of terms of trade (proportions of exchange of Cuban sugar for Soviet oil).
Absorption of the supply shock
Adjustment to supply shock: Cutting imports, developing exports of services (tourism)
Policy factors: institutions, rule of law and democracy • If initial conditions only are used to predict economic performance, then: • China and Vietnam did much better than expected; • EE and Baltic states a bit better than expected; • most CIS states did much worse than expected. Exceptions: Uzbekistan and Belarus, that proceeded with slow reforms, but had the strongest state institutions among all CIS states; • Ukraine did worse than expected due to the poor institutional capabilities
Collapse of the institutions in most FSU and Balkan countries • dramatic increase of the share of the shadow economy; • decline of government revenues as a proportion of GDP; • inability of the state to deliver basic public goods and appropriate regulatory framework; • accumulation of tax, trade, wage and bank arrears; • demonetization, "dollarization" and "barterization" of the economy, as measured by high and growing money velocity, and the decline of bank financing as a proportion of GDP; • poor enforcement of property rights, bankruptcies, contracts and law and order; • increased crime rates.
Measuring institutional capacity of the state • Proxies for institutional capacity: • the trust of businesses and individuals in various institutions - here FSU states rank much lower than East European countries in all available surveys • the financial strength of the government - the share of state revenues in GDP • crime and murder rates • share of shadow economy
Total revenues of consolidated government budgets (including off -budget funds) as a % of GDP in economies in transition
Total revenues of consolidated government budgets (including offbudget funds) as a % of GDP in economies in transition (continued)
Size of the government reduced in most transition economies
Three major patterns of change in government expenditures
Three "models" of transition • Strong authoritarian regimes (China) • cuts in government expenditure at the expense of defense, subsidies and budgetary financed investment; • expenditure for "ordinary government" as a percentage of GDP remained largely unchanged • Strong democratic regimes (Poland) • budgetary expenditure, including those for "ordinary government", declined only in the pre-transition period, but increased during transition itself • Weak democratic regimes (Russia) • decline in the financing of defense, investment and subsidies, and also the downsizing of "ordinary government"
Normally, the higher are tax rates, the larger is shadow economy
In transition economies, the lower are state revenues the larger is the shadow economy
The shadow economy in post-communist countries emerged mostly during transition
The decline in government revenues is correlated with performance
Investment were higher in countries where government revenues were higher
Investment growth is higher in countries with small shadow economy
Investment growth is higher in countries with smaller decline in government revenues
Government investment go hand in hand with private investment
Corruption today is much higher in China and Russia than on the eve/before transition
Government collapse: corruption • In 1980 -85 on a list of 54 states the USSR was just about in the middle: the Soviet bureaucracy was cleaner than that of Italy, Greece, Portugal, South Korea and all developing countries, but more corrupt than in other developed states • In 1996, after the transition to market economy and democracy, Russia in the same list of 54 countries was at the 48 -th place, between India and Venezuela.
Evaluating the impact of non-policy and policy factors: institutional capacities added
Evaluating the impact of non-policy and policy factors: institutional capacities added
Best performance: low distortions, strong institutions Worst performance: high distortions, weak institutions
Empirical evidence: The growth rates of GDP per capita in 1960 -2000: • 2. 5% in industrialized (OECD) countries, • 4. 5% in East Asia, • 1. 7% in MENA, • 1. 6% in LA, • 1. 8% in South Asia, • 0. 3% in SSA.
Strong authoritarian regimes (China, Vietnam), weak authoritarian regimes (Central Asia, Azerbaijan, Belarus), strong democratic regimes (Central European countries), weak democratic regimes (most FSU and Balkan states)
Democratization without strong rule of law usually leads to the collapse of output
Nearly 80%of all variations in output can be explained by only three factors – pre-transition distortions, inflation, and rule-of-law-to-democracy index
Explaining the magnitude of recession: conclusion • Differences in performance during transition depend strongly on the initial conditions: • The higher the distortions (militarization, overindustrialization, "under-openness" of the economy and the share of perverted trade flows), the worse is the performance • The higher was GDP per capita before transition, the greater were distortions embodied in fixed capital stock, the more difficult it was to overcome these distortions to achieve growth
Explaining the magnitude of recession: conclusion • Changes in the institutional capacities of the state have dramatic impact on performance • Macroeconomic stability matters a great deal for economic performance • Liberalization index does not appear to be important
Democracy and growth reconsidered: why economic performance of new democracies is not encouraging • Democracy is widely regarded as one of the goals of development and reforms • But the performance of the “third wave” democracies – countries that democratized since 1974 – is disappointing • It appears that the impact of changes in democracy on economic and social development is different for developed and developing countries • Especially when the strength of the rule of law is taken into account
Description statistics for new democracies
For developing countries with poor rule of law greater democratization in 1975 -99 was associated with lower growth rates
For developing countries with poor rule of law greater democratization in 1975 -99 was associated with lower growth rates
Changes in the life expectancy, years, and in democracy index, points, in 1970 -2000
Changes in the life expectancy, years, and the ratio of investment climate to increase of democracy index, %, in 1970 -2000
For developing countries with poor rule of law greater democratization in 1975 -99 was associated with lower growth rates
Threshold regressions
Threshold regressions reorganized • Equation 3 in the previous table can be reorganized as: GROWTH= CONST. + CONTR. VAR. + D*(0. 18 Rof. L – 0. 13), where D – democratization (change in democracy index in 1970 -2000), Rof. L – rule of law index. The critical level of the rule of law index is 0. 72 • more than in Czech, Jordan, Malta, Uruguay; but less than in Cyprus, Estonia, Hungary, Slovenia, Tunisia • if the index is higher, democratization has a positive effect on growth, if it is lower, the impact is negative • The forth equation in table is: GROWTH = CONST + CONTR. VAR. + D*(0. 0729 CORR – 0. 485), where CORR is the corruption perception index. The critical level of corruption index is 6. 65 • approximate level of corruption in Chile, Malaysia, Spain in the early 1980 s), democratization • if the index is higher, democratization has positive impact on growth. If it is lower, democratization has significant negative impact on growth.
Mechanism of such influence: hypotheses • Democratization under poor rule of law leads to the decay of state institutional capacity • because it undermines the effectiveness of the government regulations, including tax regulations (leads to the expansion of the shadow economy) and limits the growth of government revenues • Democratization under poor rule of law makes it difficult to carry out prudent macroeconomic policy and export oriented industrial strategy • because the state becomes the hostage of industrial lobbies and populist groups
Government effectiveness index (WB, 2001) and the ratio of investment climate to democratization, 1972 -99
ECONOMIC AND SOCIAL COSTS OF ILLIBERAL DEMOCRACIES
Factors explaining government effectiveness in 2001
Factors explaining increase in government revenues in 1975 -99 and the share of shadow economy in GDP in the 1990 s
Impact on investment and growth of government revenues in 1975 -99 and the share of shadow economy in GDP in the 1990 s
Factors explaining inflation, budget deficit and accumulation of foreign exchange reserves (FOREX) in 1975 -99
Factors explaining ratio of domestic to international prices
Democracy and growth reconsidered: conclusions • Two reasons why research on the link between democracy and growth may produce conflicting results: • Not only the level of democracy, but also changes in this level (democratization) matter • Distinction between the rule of law (liberalism or civil rights) and democracy (political rights) should be made • In illiberal democracies - countries with poor tradition of the rule of law undergoing rapid democratization – there was a deterioration of institutions that had an adverse effect on economic growth • The weakening of the state institutional capacities occurred due to slow growth of government revenues and expenditure, as well as due to poor enforcement of government regulations (larger shadow economy)
Democracy and growth reconsidered: conclusions • Illiberal democracies were not able to carry out reasonable macroeconomic and industrial policies • There is a trade-off between democratization in poor-rule-of-law countries and other developmental goals. • Early transition to electoral democracies in countries with weak rule of law is detrimental to growth and inflicts high economic and social costs
Growth theory and transformational recession Annual average growth rates of GDP per capita: • • • OECD – 2. 5% East Asia – 4. 5% South Asia – 1. 8% MENA – 1. 7% Latin America – 1. 6% Sub-Sahara Africa – 0. 3%
GROWTH PERFOMANCE IN 1960 -90, % PER ANNUM
Growth theory and transformational recession: if growth accounting is applied to the period of transformational recession, the results are very odd • Large sample of countries: • Barro (1991): • Per capita GDP growth = 0. 03 - 0. 008 Yo + 0. 03 PRIM + 0. 03 SECOND - 0. 12 GOV • Levine and Renelt (1992): • Per capita GDP growth = - 0. 83 -0. 35 Yo - 0. 38 POP +3. 17 SECOND + 17. 5 INV • R 2 >50% • 25 transition economies: • Barro (1991): • Per capita GDP growth = - 6. 6 + 0. 0007 Yo + 0. 04 PRIM - 0. 07 SECOND + 0. 16 GOV • R 2 = 0. 026 • Levine and Renelt (1992): • Per capita GDP growth = - 2. 1 + 0. 01 Yo + 1. 8 POP - 0. 12 SECOND – 0. 17. 5 INV • R 2 = 0. 039
From recession to recovery: at the recovery stage there is a positive relationship between liberalization and performance
From recession to recovery: By the end of the 1990 s many countries were already recovering from recession
Speed and extent of liberalization may be endogenous
Economic liberalization and democratization go hand in hand
GDP during transition, GDP per capita before transition, liberalization index, inflation, democracy and rule of law indices
GDP during transition, GDP per capita before transition, liberalization index, inflation, democracy and rule of law indices (continued)
From recession to recovery See next PPP and the 2006 paper: Shock Therapy versus Gradualism Reconsidered: Lessons from Transition Economies after 15 Years of Reforms. TIGER Working paper No. 82, 2006 http: //www. tiger. edu. pl/publikacje/TWPNo 82. pdf
Political economy of transition • Gain from reforms - $10 billions for 10 people • Loses – 1 billion for 100 people This reform will not be supported at the polls, if there are no guarantees of redistribution of gains
Political economy of transition Income inequalities Median voter’s income is below average Redistribution (taxes, gov. spending) ? ? Incentives are undermined => slowdown of economic growth
Political economy of transition Income inequalities Pressure to redistribute • • • Poor institutional capacity Inability to redistribute openly Price controls Inflationary financing of the government budget deficit Debt financing of the government budget deficit Redistribution via overvalued real exchange rate Redistribution via arrears