Comparative Analysis 2011 Sanyo 10 Ton HVAC And

")


 Sanyo 10")


![• Equation: – [(Enthalpy Supply) – (Enthalpy Return)] X (measured CFM) / (Specific](https://slidetodoc.com/presentation_image/d31f65ff787fa6d121ec67e8dbf8aa63/image-12.jpg "• Equation: – [(Enthalpy Supply) – (Enthalpy Return)] X (measured CFM) / (Specific")
 Ton")
 • Accumulator $325 •")
- Slides: 14
Comparative Analysis 2011 Sanyo 10 Ton HVAC And Sanyo 10 Ton HVAC Equipped with Mysticool® Max from XDX®
Summary Overview • A validation was conducted under laboratory conditions of a Ten (10) Ton Sanyo HVAC and Heat Pump System • Heat Pump operation demonstrated a hotter supply air temperature making the unit more suitable for operation in colder climates. Energy consumption was reduced by ~ Twenty (20)% • HVAC improved capacity 19. 8% while reducing k. Wh. EER was improved. • Baseline: » » 101, 512. 80 BTU/Hr 8. 45 Tons of Net Cooling Effect » 8. 968 EER • Mysticool® Max from XDX®: » 128, 837. 46 BTU/Hr » 10. 74 Tons of Net Cooling Effect » 13. 81 EER – Energy was reduced by 17. 6% (In line with Global Results) – Reduction in k. Wh of 1. 99 per hour (16 hours 31. 84 k. Wh per day per system) – 31. 84 k. Wh would amount to ~ ¥ 19. 19 daily
Validation Protocol • • • Test was conducted upon Sanyo Heat Pump and HVAC in sequential baseline tests. Generator was operated to run at 50 Hz Voltage, k. Wh, Amperage, k. W, PF were monitored Temperatures, Pressures, RH% were recorded at Ten (10) second intervals. Test was repeated upon addition of Mysticool® Max and Heat Pump Optimizer™ from XDX® to the Sanyo Heat Pump and HVAC in sequential tests. Laboratory Configuration Veris H 8822 Power Monitor Veris H 8036 Modbus CT Logic Beach Data Recording Equipment N. I. S. T. Rated Matched Thermocouples N. I. S. T. Rated HOBO Temperature and RH%
Heat Pump Comparison Test was conducted upon Sanyo Heat Pump in sequential baseline tests and was repeated upon addition of Mysticool® Max and Heat Pump Optimizer™ from XDX® to the Sanyo Heat Pump in sequential tests. The Piping Diagram of the Heat Pump Optimizer™ from XDX® is shown. On the following slides, graphs of performance data and power are shown. Work has not been calculated as the supply outlet air relative humidity sensor became erratic during the baseline test for the heat pump and with only the return air relative humidity sensor operational, delta h could not be determined. Warmer discharge temperatures and a larger delta T is clearly demonstrated.
Heat Pump – Performance as designed for typical Sanyo Operation (Baseline Operation) Sanyo 10 Ton Heat Pump operated 58 F-60 F (14. 4 C to 15. 5 C) Return Air with a 30 F (-1. 1 C) Outdoor Ambient Temperature; 10 second samples
Heat Pump – Performance with Heat Pump Optimizer Kit from XDX Sanyo 10 Ton Heat Pump operated 58 F-60 F (14. 4 C to 15. 5 C) Return Air with a 30 F (-1. 1 C) Outdoor Ambient Temperature; 10 second samples
Heat Pump – Performance with and without Heat Pump Optimizer Kit from XDX Sanyo 10 Ton Heat Pump operated 58 F-60 F (!4. 4 C to 15. 5 C) Return Air with a 30 F (-1. 1 C) Outdoor Ambient Temperature; 5 minute samples
Sanyo 10 Ton Heat Pump operated 80 F -81. 5 F (26. 67 C to 27. 5 C) Return Air with a 90 F (32. 2 C) Outdoor Ambient Temperature; 15 minute power samples 14 12 Power Analysis: 13. 23 10 10. 86 8 Sanyo Baseline: Compressor k. Wh Blower k. Wh Compressor Unit Amperage Blower Amperage -------------------------- 9. 33 k. Wh 1. 989 k. Wh 13. 23 amps 5. 22 amps 4 2 2. 33 0 2. 45 1. 84 Energy Consumption (k. Wh) Mysticool® Max from XDX®: Compressor k. Wh Blower k. Wh Compressor Unit Amperage Blower Amperage XDX 6 Average Amperage 2. 08 Average k. W 7. 34 k. Wh 1. 989 k. Wh 10. 86 amps 5. 22 amps 15 minute power samples
HVAC Comparison Test was conducted upon Sanyo HVAC in sequential baseline tests and was repeated upon addition of Mysticool® Max to the Sanyo HVAC in sequential tests. The Piping Diagram of the Mysticool® Max from XDX® addition to the Sanyo HVAC is shown. On the following slides, charts of airside performance data and power are shown. Work has been calculated as the supply outlet air relative humidity sensor operation was restored and calibrated; delta h therefore has been determined. Colder supply air temperatures, a larger delta T and Delta RH% are clearly demonstrated, and EER is calculated.
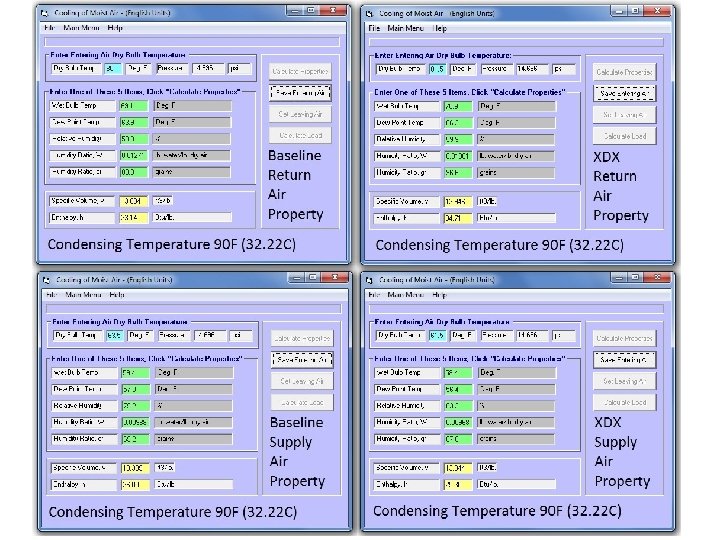
Air Property Comparison Sanyo Baseline: Supply- Return- Temperature RH% Wet Bulb Dew Point Enthalpy 80 F (26. 67 C) 58. 0% 69. 1 F (20. 61 C) 63. 9 F (17. 72 C) 33. 14 BTU/lb Temperature RH% Wet Bulb Dew Point Enthalpy Specific Vol. 63. 5 F (17. 5 C) 79. 2% 59. 4 F (15. 22 C) 57 F (13. 89 C) 26. 00 BTU/lb 13. 399 ft 3/lb ------------------------------ Mysticool® Max from XDX®: Supply- Return- Temperature RH% Wet Bulb Dew Point Enthalpy 81. 5 F (27. 5 C) 59. 9% 70. 9 F (21. 61 C) 66. 3 F (19. 06 C) 34. 71 BTU/lb Temperature RH% Wet Bulb Dew Point Enthalpy Specific Vol. 61. 5 F (16. 39 C) 83. 3% 58. 4 F (14. 67 C) 56. 4 F (13. 56 C) 25. 30 BTU/lb 13. 344 ft 3/lb
• Equation: – [(Enthalpy Supply) – (Enthalpy Return)] X (measured CFM) / (Specific Volume Return) X (Sixty [60] minutes = BTU/Hr – BTU/HR / Watts/Hr = E. E. R. (Efficiency Ratio) Energy Efficiency Ratio (EER) Sanyo Baseline: Supply- Return- Temperature RH% Wet Bulb Dew Point Enthalpy 80 F (26. 67 C) 58. 0% 69. 1 F (20. 61 C) 63. 9 F (17. 72 C) 33. 14 BTU/lb Temperature RH% Wet Bulb Dew Point Enthalpy Specific Vol. 63. 5 F (17. 5 C) 79. 2% 59. 4 F (15. 22 C) 57 F (13. 89 C) 26. 00 BTU/lb 13. 399 ft 3/lb ------------------------------ • Baseline: – [(33. 14) – (26. 00)] X (3, 175 CFM) / (13. 399) X (60) = • 101, 512. 80 BTU/Hr or • 8. 45 Tons of Net Cooling Effect • 101, 512. 80 / 11. 319 Watts/hr = 8. 968 EER Mysticool® Max from XDX®: 81. 5 F (27. 5 C) 59. 9% 70. 9 F (21. 61 C) 66. 3 F (19. 06 C) 34. 71 BTU/lb Temperature RH% Wet Bulb Dew Point Enthalpy Specific Vol. 61. 5 F (16. 39 C) 83. 3% 58. 4 F (14. 67 C) 56. 4 F (13. 56 C) 25. 30 BTU/lb 13. 344 ft 3/lb • Mysticool® Max from XDX®: – [(34. 71) – (25. 30)] X (3, 045 CFM) / (13. 344) X (60) = • 128, 837. 46 BTU/Hr or • 10. 74 Tons of Net Cooling Effect • 128, 837. 46 / 9, 329 Watts/hr = 13. 81 EER 15 13. 23 10. 86 10 2. 45 2. 08 ge 2. 33 1. 84 er a 0 io n 5 pt Return- Temperature RH% Wet Bulb Dew Point Enthalpy m Supply- Sanyo Baseline
Summary • A validation was conducted under laboratory conditions of a Ten (10) Ton Sanyo HVAC and Heat Pump System • Heat Pump operation demonstrated a hotter supply air temperature making the unit more suitable for operation in colder climates. Energy consumption was reduced by ~ Twenty (20)% • HVAC improved capacity 19. 8% while reducing k. Wh. EER was improved enough to impact LEED Certification Points. • Baseline: » 101, 512. 80 BTU/Hr » 8. 45 Tons of Net Cooling Effect » 8. 968 EER • Mysticool® Max from XDX®: » 128, 837. 46 BTU/Hr » 10. 74 Tons of Net Cooling Effect » 13. 81 EER
Ongoing Redesign Parts Already Eliminated: • Part Estimated Cost ($USD) • Accumulator $325 • Oil Separator $193 Parts Targeted for Redesign: • • • Defrost control Fan center Thermostat Copeland Scroll Condenser motor Indoor blower motor (2)