COMPACTION OF SOIL n Definition It is the


 Dry density ~")

 mould; (b) hammer")
 = volume of")

 mould (b) hammer")


 compacted to the")


 Groups Compaction Characteristics")
 Groups SM Good")


")

- Slides: 30
COMPACTION OF SOIL n Definition: It is the process of bringing the soil particles close together to a dense state by the application of energy. n Purpose: n To improve the density of soil To improve the shear strength of soil To improve the bearing capacity of soil To reduce the permeability of soil To reduce the compressibility of soil To reduce the shrinkage of soil To reduce the frost susceptibility of soil n n n
Compaction of soil is usually required when used as a fill The soil is commonly used as a fill material in the following cases. 1. 2. 3. 4. 5. 6. 7. To back fill an excavation e. g. , for foundations. To develop a made-up ground to support a structure. As a sub-grade or sub-base for roads, railways or airfields As an earth dam. To raise the floor level to the required height in buildings. As a back fill behind retaining walls. To develop a site (residential, industrial, recreational etc. ) in a difficult terrain (undulating topography) where substantial cutting and filling is involved.
FACTORS AFFECTING COMPACTION OF SOIL 1. Moisture Content Dry density ~ moisture content relationship
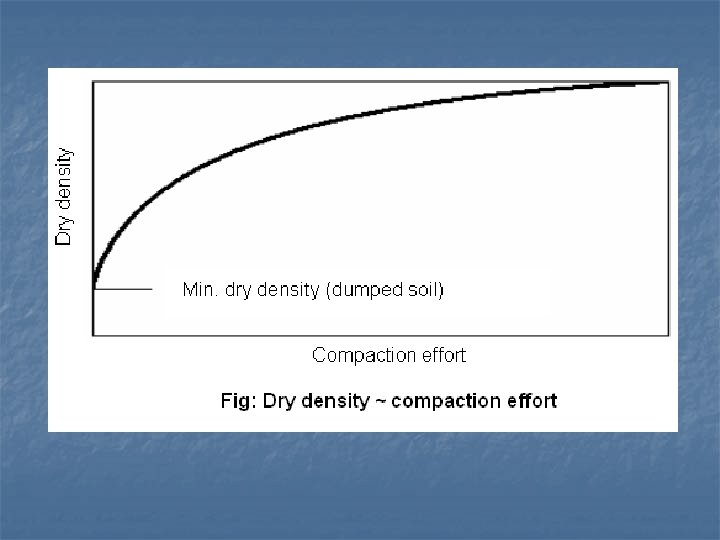
2. Compaction Effort or Energy Dry density ~ moisture content curves for different compaction efforts
Compaction energy For standard AASHTO test Compaction energy For Modified AASHTO test CE = (5 layers)(25 blows)(10 lb weight)(1. 5 ft drop) (1/30 ft 3) = 56, 250 ft-lb/ft 3 (2693. 3 k. J/m 3)
Table: Specifications for Standard and Modified AASHTO Tests No. Item Specifications Standard AASHTO Modified AASHTO 0. 944 × 10 -3 m 3 (1/30 ft 3) 1 Volume of mold 0. 944 × 10 -3 m 3 (1/30 ft 3) 2 Mass of hammer 2. 495 kg (5. 5 lb) 4. 536 kg (10 lb) 3 Height of drop of the hammer 304. 8 mm (12 in. ) 457 mm (18 in. ) 4 Number of hammer blows per layer of soil 25 25 5 Number of layers of compaction 3 5 593 k. J/m 3 (12, 375 ft-lb/ft 3) 2698 k. J/m 3 (56, 250 ft-lb/ft 3) 6 Energy of compaction
3. Soil Type A-4, A-5 A-6, A-7 -6 Water Content (%) Dry density ~ moisture content curves for different soils
4. Method of Compaction • Kneading compaction • Static compaction • Dynamic compaction • Vibratory compaction 5. Admixture Material added to the soil to improve its properties Density will depend on the type and amount of admixture 6. Processing amount, By thorough mixing of moisture in the soil higher dry density is achieved. Thorough mixing requires greater manipulation and curing time. 7. Energy distribution, Uniform distribution of blows on each layer gives better compaction and higher dry density is obtained.
Standard AASHTO test equipment: (a) mould; (b) hammer
Where, W = weight of compacted sample in the mould V(m) = volume of the mould = 1/30 ft 3 Where, m = moisture content Moisture-Dry density Curve
Where, γzav = Zero air-void dry density γw = density of water e = void ratio Gs = specific gravity of soil solids For 100% saturation, e = m. Gs Where, m = moisture content
Modified proctor test apparatus (a) mould (b) hammer
COMPARISON OF AASHTO & MODIFIED AASHTO COMPACTION Table Comparison of AASHTO & modified AASHTO compaction Standard AASHTO compaction 1 - Volume of the mould is 1/30 ft 3. 2 - Weight of hammer is 5. 5 lb. 3 - Height of fall is 12 in. 4 - Number of layers is three. 5 - Number of blows is 25. 6 - Maximum dry density is lower. 7 - The optimum moisture content is higher. 8 - The compaction curve is below and to the right of modified AASHTO curve. 9 - Compaction energy applied is 12375 ftlb/ft 3. 10 - Compaction energy is 4. 545 times lower than that of the modified AASHTO test, but the maximum dry density obtained is only about 1. 1 to 1. 25 times lower than that of the modified AASHTO test. 11 - The degree of saturation at optimum moisture content for the AASHTO & Modified AASHTO test is almost same. Modified AASHTO compaction 1 - Volume of the mould is 1/30 ft 3. 2 - Weight of hammer is 10 lb. 3 - Height of fall is 18 in. 4 - Number of layers is five. 5 - Number of blows is 25. 6 - Maximum dry density is higher. 7 - The optimum moisture content is lower. 8 - The compaction curve is above and to the left of standard AASHTO curve. 9 - Compaction energy applied is 56250 ftlb/ft 3. 10 - Compaction energy is 4. 545 times higher than that of the standard AASHTO test, but the maximum dry density obtained is only about 1. 1 to 1. 25 times higher than that of the standard AASHTO test. 11 - The degree of saturation at optimum moisture content for the AASHTO & Modified AASHTO test is almost same.
DETERMINATION OF FIELD DENSITY 1. 2. 3. 4. Drive cylinder method Sand cone method Rubber balloon method Nuclear density meter DRIVE CYLINDER METHOD Drive cylinder pushed into the soil and the surrounding soil excavated to take out the cylinder
• • • Safest possible nuclear design as the source never leaves the meter. There is also automatic shielding when carried. Faster testing time. Larger samples tested: Using a new back scatter technology permits testing samples up to 20 times larger than direct transmission units. The factory set density calibration to eliminate operator error. The built-in brain and memory virtually eliminates need for special operator skills. The keyboard is used for all tests. The meter is factory calibrated for all materials. The following features speed up testing. • • Separate systems take moisture and density reading simultaneously to cut time to half. Immediate display of wet and dry densities. Lab. densities can be entered and stored in memory bank. Immediate display of relative compaction as a % of laboratory density. Storage and display of previous contact, air gap, or moisture counts for subsequent reuse if new data is not needed. No charts or tables. No elaborate soil preparation or hole punching. No field calibration.
MERITS AND DEMERITS OF THE FIELD DENSITY METHODS 1. The Drive Cylinder method is easy and quick. The cutting edge is easily damaged and need re-sharpening. This method is best suited for soft and cohesive soil. 2. The Sand-Cone method is relatively slow, but it can be used for any type of soil. 3. The Water-Displacement method is a lengthy process and it can only be used on cohesive soil. 4. The Rubber-Balloon method is easy and quick, but the results are not very reproducible owing to the difficulty of controlling the air pressure and ensuring that the balloon conforms to the shape of the hole. The method is not applicable to very stony soils. 5. The Nuclear Method is considerably faster to perform than the sand-cone and rubber-balloon methods. It has the disadvantage, however, of potential hazards to individuals handling radioactive materials.
FIELD COMPACTION • Commonly by use of rollers. • Type of roller depends on the type of soil and the degree of required. • The roller may be self-propelled or towed. The most common types of rollers are: 1. Smooth-wheel roller 2. Pneumatic rubber-tired roller 3. Sheep-foot roller 4. Vibratory roller 5. Grid roller compaction
Advantages of the Improved Design of the SAKAI Rollers The following features of the improved design of the SAKAI (JAPAN) road rollers give smooth steady rolling and excellent maneuverability for high-class compaction work. These features ensure high performance capabilities. The rollers with these features provide better, economical and more effective compaction. 1. 2. 3. 4. Equal drum diameter Centre-pin steering Independent steering for front and rear drums (axles) All wheels driven
VIBRATORY ROLLERS a. Smooth drum-and-tire type vibratory roller b. Pad-foot drum-and-tire type vibratory roller c. Double-drum type vibratory roller d. All-drum drive and vibration vibratory roller e. Tractor towed vibratory roller f. Hand-guided vibratory roller
COMPACTING CAPABILITY OF ROLLER The amount of material (weight or volume) compacted to the specified density by a given roller per unit time is known as the capability of roller. It depends on the following factors. 1. Working width (W) 2. Speed of roller (S) 3. Number of passes (N) 4. Thickness of layer (D) Asphalt Compaction Theoretical capability = Soil Compaction Theoretical capability =
FACTORS AFFECTING FIELD COMPACTION Following are the factors, which affect the field compaction. 1. Type of the compacting equipment 2. Field moisture content 3. Number of passes of the compacting equipment 4. Thickness of the lift (layer) 5. Speed of the compacting equipment 6. Soil type Relation between dry density and number of roller passes
Table: General Guide to Selection of AASHTO Groups Based on Anticipated Embankment Performance Visual Description Maximum Dry Density lb/ft 3 (k. N/m 3) Optimum Moisture Content (%) Anticipated Embankment Performance A-1 -a Granular material 115 -142 (18 -22. 3) 7 -15 Good to Excellent A-2 -4 Granular material with soil 110 -135 (17. 3 -21. 2) 9 -18 Fair to Excellent A-3 Fine sand 110 -115 (17. 3 -18) 9 -15 Fair to good A-4 Sandy silts and silts 95 -130 14. 9 -20. 4) 10 -20 Poor to good A-5 Plastic silts and clays 85 -100 (13. 3 -15. 7) 20 -35 Unsatisfactory A-6 Silt – clay 95 -120 (14. 9 -18. 8) 10 -30 Poor to good A-7 -5 Plastic silty clay 85 -100 (13. 3 -15. 7) 20 -35 Unsatisfactory A-7 -6 Clay 90 -115 (14 -18) 15 -30 Poor to fair AASHTO Groups
Table: Compaction Characteristics and Ratings of the Unified Soil Classification (USC) Groups Compaction Characteristics Max. Dry Density Standard AASHTO lb/ft 3 (k. N/m 3) Compressibility and Expansion Value as Embankment Material Value as subgrade Material Value as Base Course GW Good: Rubber tired, smooth wheel, or vibratory roller 125 -135 (19. 6 -21. 2) Almost None Very stable Excellent Good GP Good: Rubber tired, smooth wheel, or vibratory roller 115 -125 (18 -19. 6) Almost None Reasonably stable Excellent to good Poor to fair GM Good: Rubber tired or light sheep -foot roller 120 -135 (18. 8 -21. 2) Slight Reasonably stable Excellent to good Fair to poor GC Good to fair: Rubber tired or sheep-foot roller 115 -130 (18 -20. 4) Slight Reasonably stable Good to fair SW Good: Rubber tired, or vibratory roller 110 -130 (17. 3 -20. 4) Almost None Very stable Good Fair to poor SP Good: Rubber tired, or vibratory roller 100 -120 (15. 7 -18. 8) Almost None Reasonably stable when dense Good to fair Poor USC Group
Table: Compaction Characteristics and Ratings of the Unified Soil Classification (USC) Groups SM Good : Rubber tired or sheep-foot roller 100 -125 (15. 7 -19. 6) Slight Reasonably stable when dense Good to fair Poor SC Good to fair: Rubber tired or sheep-foot roller 105 -125 (16. 5 -19. 6) Slight to medium Reasonably stable Good to fair Fair to poor ML Good to poor: Rubber tired or sheep-foot roller 95 -120 (14. 9 -18. 8) Slight to medium Poor stability, high density required Fair to poor Not suitable CL Good to fair: Sheep -foot or rubbertired roller. 95 -120 (14. 9 -18. 8) Medium Good stability Fair to poor Not suitable OL Fair to poor: Sheepfoot or rubber-tired roller 80 -100 (12. 6 -15. 7) Medium to high Unstable, should not be used Poor Not suitable MH Fair to poor: Sheepfoot or rubber-tired roller 70 -95 (11 -14. 9) High Poor stability, not be used Poor Not suitable CH Fair to poor: Sheepfoot roller 80 -105 (12. 6 -16. 5) Very High Fair stability, may soften on expansion Poor to very poor Not suitable OH Fair to poor: Sheepfoot roller 65 -100 (10. 2 -15. 7) High Unstable, should not be used Very poor Not suitable PT Not suitable -- Very high Should not be used Not suitable
SPECIFICATIONS FOR FIELD COMPACTION Where, R = relative compaction For granular soil the term relative density as defined below is commonly used Where, Dr = Relative density Where Ro =
Dry density m 1 m 4 m 3 Moisture Content, m m 2 Fig: Most economical compaction condition
Fig: Effect of compaction on structure of cohesive soil
Void ratio, e Compacted dry of optimum Compacted wet of optimum Pressure (natural scale) Low-pressure consolidation Void ratio, e Fig: Effect of compaction on compressibility of clayey soil Compacted dry of optimum Compacted wet of optimum Pressure (log scale) High-pressure consolidation Fig: Effect of compaction on compressibility of clayey soil
Fig: Effect of compaction on the strength of clayey soils Fig: Qualitative stress-strain curves for clay compacted on dry & wet sides of optimum and tested at moulding moisture content as well as after soaking to produce saturation.