Community Transit of Delaware County Inc is a


- Slides: 26

Community Transit of Delaware County, Inc. is a private, not for profit organization whose mission is to increase the mobility and independence of the senior, disabled and other qualified residents of Delaware County, PA. 1

Delaware County, PA • • • Delaware County’s population 2012: 558, 979 14. 3% of the population is 65+ Delaware County’s land in square miles: 183. 84 Persons per square mile: 3, 040. 5 Our average trip length, including deadhead, is about 6 miles. 2

Even with the most capable of drivers, our fleet suffers from constantly being “challenged” by other vehicles on very old, narrow, urban streets, and always operating in too-close quarters. • The average Philadelphia driver loses 38 hours per year due to traffic congestion according to the Texas Transportation Institute’s (TTI) 2009 Annual Urban Mobility Report. • Driving on roads in need of repair costs the average motorist in the Philadelphia area $522 annually in extra vehicle operating costs. These costs include accelerated vehicle depreciation, additional repair costs and increased fuel consumption and tire wear. • Traffic congestion in the Philadelphia area costs the average motorist in the region $786 annually in lost time and wasted fuel. 3

Transit Agency Status FY 2011 -12 �Current Financial Position �Current Operations �Service Statistics/Trends �Funding Statistics/Trends �Other Information/Assumptions �Capital Status Review 4

Current Financial Position: �Reserves/Retained Earnings Source Balance Lottery -3, 626, 670 Other 4, 923, 194 Over the past 10 years Other State $ Other Local $ 5

Current Financial Position: �Level of Debt/Loans—Identify each line of credit (excludes long-term bond financing) Name of Financial Institution Amount of Available Credit Interest Rate Current Credit in Use $200, 000 6% - First Cornerstone Bank Vehicle Loan – 3 buses 6. 5% $17, 674. 46 (as of 1/20/2012) First Cornerstone Bank Vehicle Loan – 2 buses 6. 5% $50, 155. 53 (as of 1/23/2012) First Cornerstone Bank Line of Credit 6

Current Financial Position: �Accounts Payable – Past due 90 days and over Vendor Amount Past Due Various MATP clients (for credits) ($821) Estimated Pay Date �Accounts Receivable – Past due 90 days and over Program/Agency Amount Past Due Date Requisitioned Estimated Pay Date Delaware County OMR $2, 729 8/31 to 10/31/2011 Promise system PDA Waiver $1, 685 8/31 to 11/31/2011 Promise system United Disabilities $72 10/31/2011 March 2012 7

Current Operations: �Staffing Level �Contract Provisions �Healthcare �Pension �Fuel �Fares �Other major factors producing cost increases above inflation �Cost Savings Initiatives 8

Staffing Level/Org Chart 9

10

Labor Provisions � Term of current union contract October 30, 2011 to October 29, 2014 Drivers Current 2012 -13 Starting wage $12. 71 $13. 22 Top wage $12. 71 $13. 22 Average wage $13. 67 $15. 08 Number- Full Time Number-Part Time 101 - Contract wage increase Job Classification Drivers 11

Important Labor Provisions � Use of part-time employees Community Transit does not currently utilize part-time driving staff, however, the current labor agreement allows management to utilize parttime drivers as management would deem necessary. � Number/percent of “split shift” drivers Community Transit does not utilize “split shift” scheduling. Drivers available throughout their full time shift. are � Overtime Drivers are eligible for overtime after working 40 hours /week. � Outsourcing Community Transit currently utilizes two subcontractors: Wheat Services, Inc. provides transportation for the MATP program. Surrey Services for Seniors provides transportation for participants at their Delaware County senior centers and other Shared Ride Program work as assigned. � Other 12

Healthcare & Dental Union Basic Coverage Employee Contributions Co-Payment Non-Union Current $580. 72 FY 2012 -13 $595. 12 Current 0 0 FY 2012 -13 0 0 Current $30/$50 FY 2012 -13 $30/$50 �Describe any proposed changes and the estimated financial impacts. 13

Pension Union Employee Contributions Non-Union Current FY 2012 -13 Current Minimum Age to Qualify for Retirement FY 2012 -13 Minimum Number of Current Years to Qualify for FY 2012 -13 Retirement Minimum Number of Current Years to be Vested FY 2012 -13 14

Pension: �Community Transit offers employees a voluntary, non-contributory 403 -B plan. 15

Fuel: �Current Cost per Gallon �Contract rate or market rate? Market Rate �Terms of contract (if applicable) �Projected Cost per Gallon and Basis for Projection �Contract rate or market rate? Market rate - Fuel has increased 18. 6% from last year to this. We used 10% for the projection. �Terms of contract (if applicable) 16

Shared Ride Fares: � Date of Last Fare Increase Community Transit applied for a fare increase on August 11, 2008 and the increase was granted on August 1, 2009. � Current � Average fare: $ 31. 67 (which includes PUC fuel surcharge) � Sponsorship arrangements: Per application � Planned Changes � Date of planned increase - YE 2012 � Estimated average fare: $ 36. 61 � Sponsorship arrangements: Per application � Describe Fare Policy Community Transit’s fares are based on a series of zones 17

Other Major Factors Producing Cost Increases Beyond Inflation: Factors Current Amount Projected Future Amount Explanation Employee Benefits $1, 073, 936 $1, 305, 140 Includes WC Insurance $ 593, 904 $ 660, 206 We are expecting at least a 10% increase. Fuel $ 504, 400 $ 559, 554 10% PUC Surcharge $ 78, 976 $ 86, 874 10% Vehicle Repairs $ 512, 668 $ 540, 663 5. 4% 18

Cost Increases Beyond Inflation: PUC Surcharge Date Amount 2005 $7, 889 2006 $5, 455 2008 $48, 647 2009 $44, 082 2010 $67, 995 2011 $78, 976 19

Insurance: Liability and Workers Compensation Auto Liability & Physical Damage FY 2007 -2008 $592, 660 FY 2008 -2009 $725, 640 FY 2010 -2011 $815, 043 FY 2011 -2012 $1, 091, 566 Workers Compensation $577, 866 $442, 766 $437, 194 $420, 528 20

Cost Savings Initiatives: Initiative Current Cost Planned Action and Implementation Date Compensation Changes In FY 2012 there were no cost of living increases given to Senior Managers. Management of “no-shows” Replaced aging telephone system and added automatic caller feature, which calls customers the evening before their scheduled trip. Also impose sanctions on chronic “no shows” Driver Scheduling Identifying “permanent weekend drivers” to minimize overtime. Savings through insurance initiatives/incentives Smith System Defensive Driving Program Workplace Safety Projected Savings 21

Shared Ride Funding FY 2010 -11 FY 2011 -12 FY 2012 -13 FY 2013 -14 FY 2014 -15 Operating Expense 5, 975, 964 6, 460, 826 6, 892, 355 7, 078, 166 7, 272, 491 Passenger Revenue 462, 318 558, 261 616, 662 627, 230 640, 949 Lottery 2, 568, 487 2, 779, 567 3, 070, 342 3, 122, 965 3, 191, 271 MATP 2, 673, 995 2, 871, 315 3, 171, 688 3, 226, 048 3, 296, 609 Other 146, 374 123, 589 138, 358 140, 729 143, 808 Balance (124, 790) (128, 094) 104, 695 38, 806 148 22

Shared Ride Statistics/Trends Shared-Ride FY 2010 -11 FY 2011 -12 FY 2012 -13 FY 2013 -14 FY 2014 -15 Total Veh. Miles 578, 203 611, 372 619, 242 629, 855 643, 631 Cost per Mile 10. 34 10. 55 10. 97 11. 04 11. 02 Total Veh. Hours 48, 697 51, 468 52, 130 53, 024 54, 183 Cost per Hour 125. 29 125. 31 130. 27 131. 18 130. 96 Total Pass. Trips 174, 872 188, 695 191, 124 194, 400 198, 652 Cost per Trip 34. 18 35. 53 35. 78 35. 72 Rev. per Trip 33. 46 33. 57 35. 10 35. 20 35. 13 Trips per Hour 1. 65 23

Other Information/Assumptions: � There has been an 18. 6% increase in fuel from this FY compared to last. � We are assuming a 10% increase in auto insurance and a 10% increase in fuel. � We assumed a 2% COLA increase for the last two fiscal years. � Based on the statistics on the 5 year spreadsheet, we assumed that the hours and miles were to be live vehicle miles and live (revenue) hours. The numbers on the Statistics/Trends page reflect these definitions. 24

Capital Status Review 25

FIVE YEAR CAPITAL SPENDING PLAN AGENCY NAME: Community Transit of Delaware County, Inc. DATE: March 7, 2012 FY 2010 -11 FY 2011 -12 FY 2012 -13 FY 2013 -14 Actual Budget Forecast Sources of Funds 1 Federal - Capital - 5310 - FTA Senior and PWD $192, 000 $196, 927 $339, 200 $381, 600 2 Federal - Capital - 5316 - FTA JARC $0 $0 3 State - Community Transportation Capital $48, 000 $49, 232 $84, 000 $95, 400 4 State - Capital - Other 5 Local Contribution 6 Other Financing Transaction Proceeds* 7 Internal Working Capital* $18, 341 8 Proceeds from Disposition of Assets $0 $0 9 Foundations $1, 500 10 Private 11 Other $2, 000 12 Total Sources of Funds $242, 000 $268, 000 $426, 700 $480, 500 13 14 15 16 17 Uses of Funds Vehicle and Equipment Purchases Vehicle Overhauls Technology Other Support Programs Total Uses of Funds 18 Sources Less Uses** FY 2014 -15 Forecast $381, 600 $0 $95, 400 $0 $1, 500 $2, 000 $480, 500 $245, 575 $0 $268, 000 $0 $426, 700 $0 $480, 500 $0 $245, 575 $268, 000 $426, 700 $480, 500 $0 $0 ($3, 575) 26
 Community transit delaware county pa
 Prague public transit co, inc.
 Delaware county adult protective services
 Delaware county human services
 Cam tran 12
 Clay county transit for elderly
 Volusia county transit
 Butte county transit
 Madison county transit
 United healthcare community plan delaware
 Mmmmmmmmmmmmmmmmmmmmm
 Performance management delaware
 University of delaware wrestling
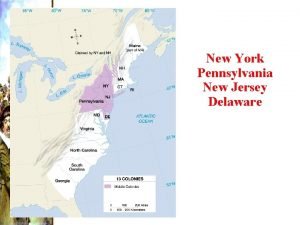
 New york pennsylvania new jersey delaware
 Delaware valley honda dealers
 Srap program delaware
 Delaware school nurse manual
 Delaware unemployment telebenefits number
 Delaware hoa ombudsman
 George washington crossing the delaware painting
 Dti delaware
 Delaware lighting system
 Lower delaware national wild and scenic river
 Bell-delaware method
 Delaware deca
 Belly offense
 Bob burton vision quest


