Community ecology Outline Community structure attributes Factors influencing

Community ecology Outline: • • • Community structure: attributes Factors influencing the structure of communities Community dynamics Chapter 16 -18
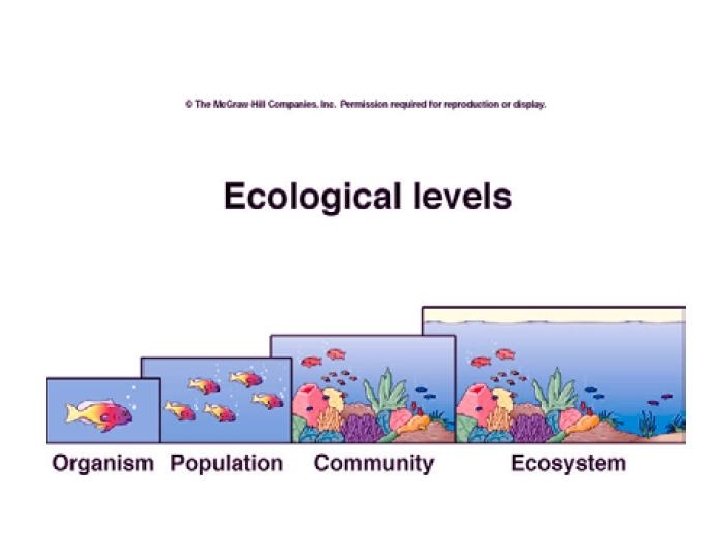

Community attributes • • # of species Relative abundance of species Nature of species interactions (food webs) Physical structure
 10")
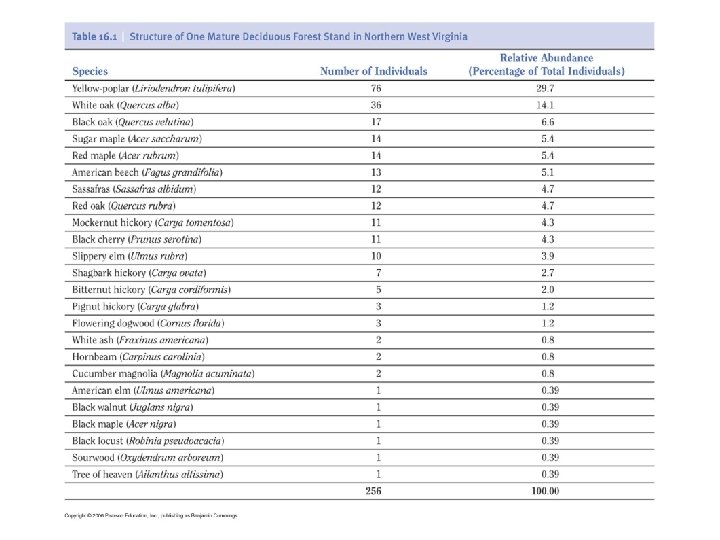
Community structure • Species richness (# of species within community) 10

Community structure • Relative abundance (% each species contributes to the total number of individuals)

Stand one Stand two

Simpson’s diversity index • D=0 -1 – 0: high diversity – 1: low diversity • Stand one (Table 16. 1): D=0. 13 • Stand two (Table 16. 2): D=0. 36

Dominance Yellow-poplar

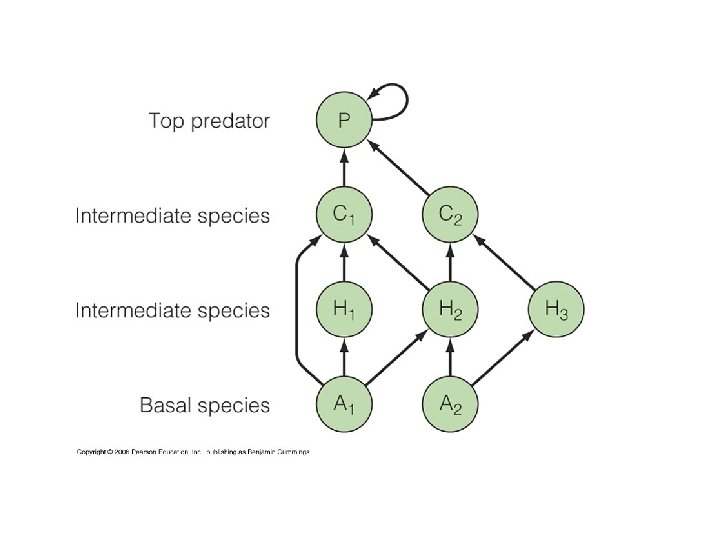
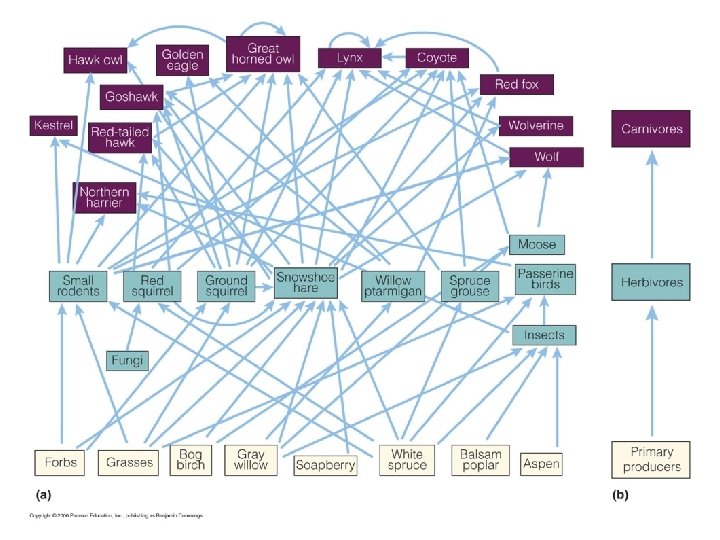
Food webs

Keystone species
 Photosynthetic pathway")
Functional groups • • • Feeding level Exploitation of common resources (guilds) Photosynthetic pathway Shade tolerance Life history

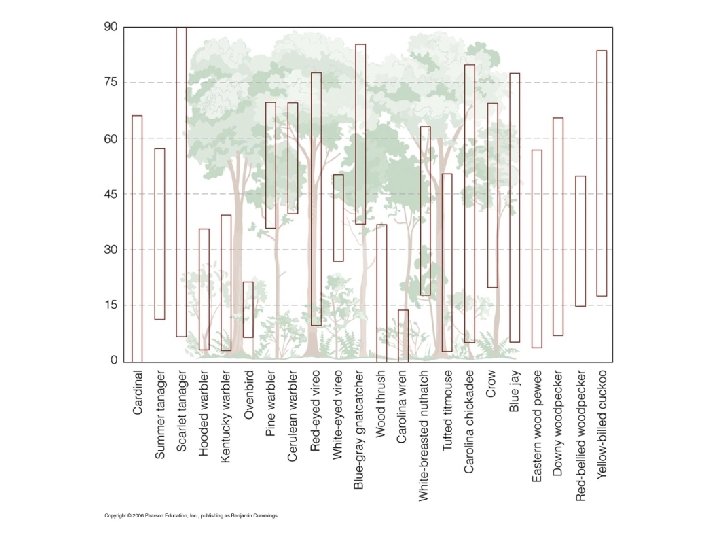
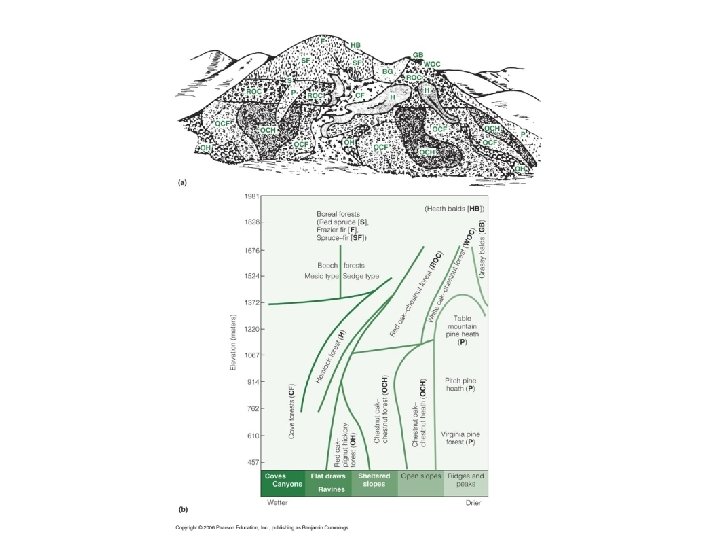
Physical structure

Zonation
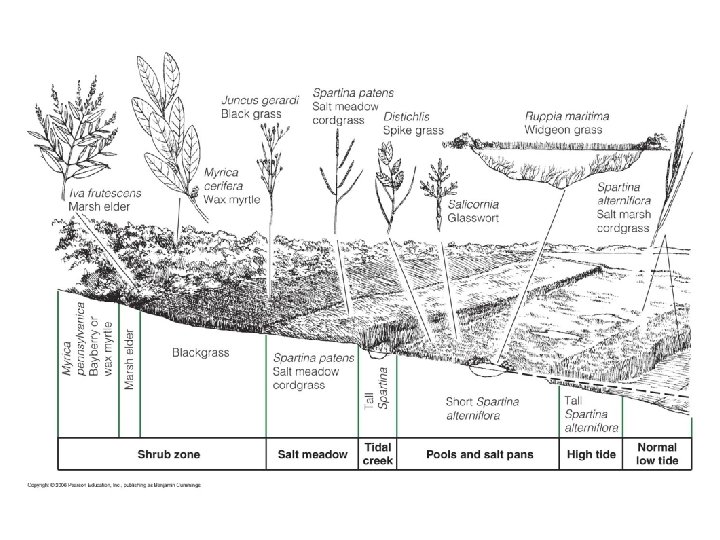

supratidal intertidal subtidal
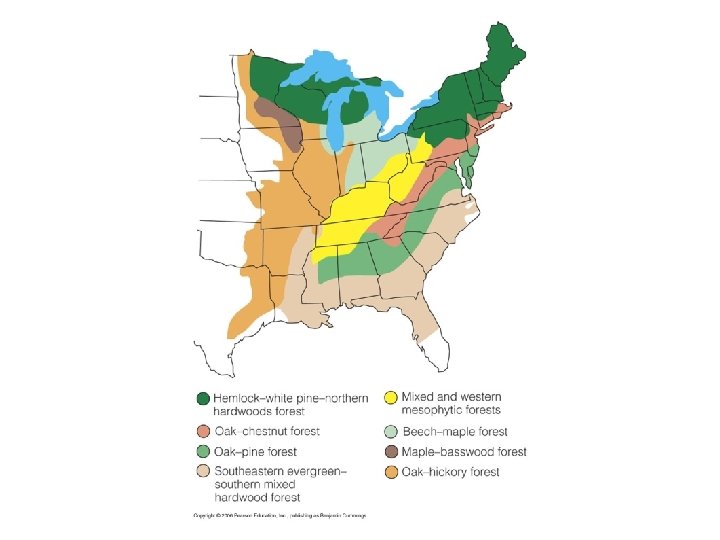

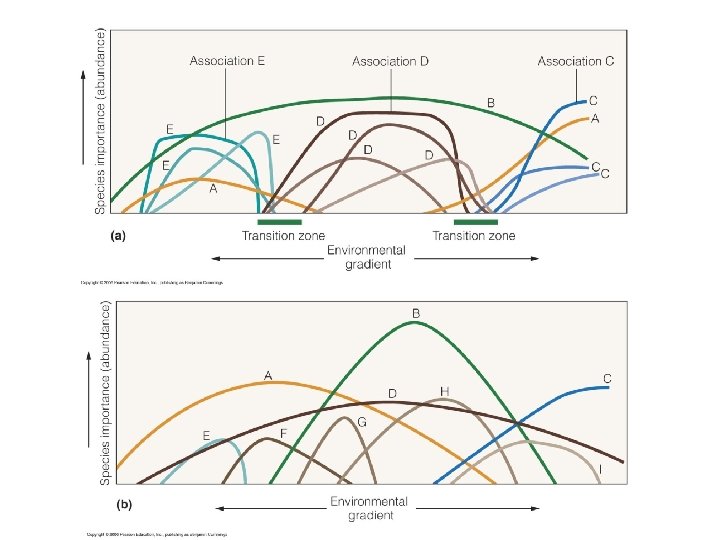
Association • Relatively consistent species composition • Uniform general appearance • Distribution that is characteristic of a particular habitat

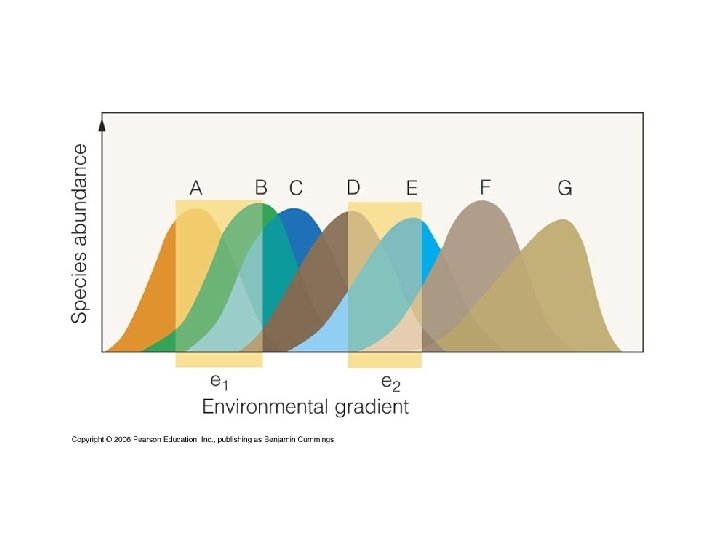
Organismic concept of communities

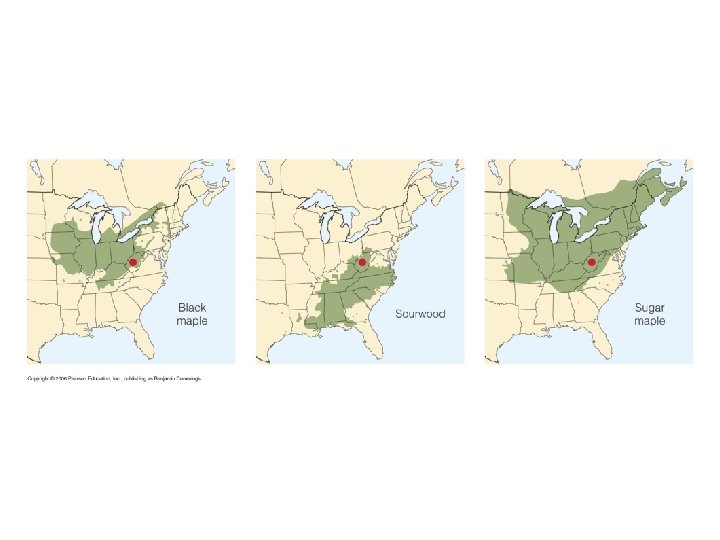
Continuum concept of communities

Factors controlling community structure

Fundamental niche

Species interactions

Keystone predation

Apparent competition

Indirect commensalism

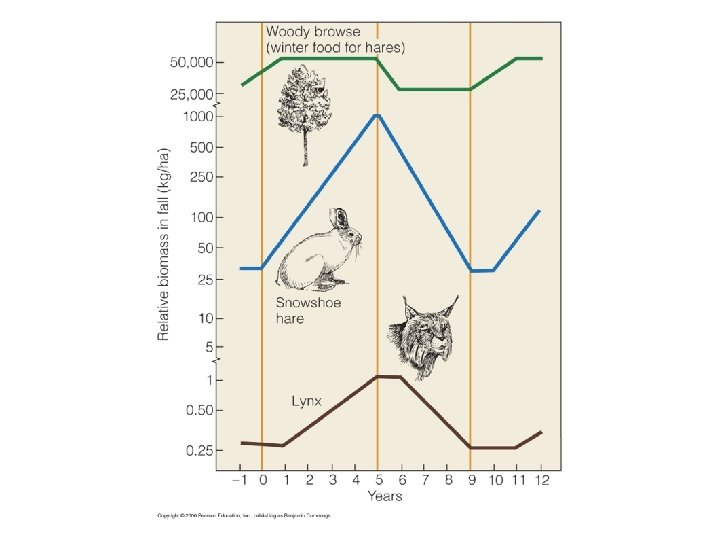
Top-down vs. bottom-up control

The number of trophic levels regulates plant, herbivore and carnivore numbers # trophic levels: B/comp: numbers limited by availability of resources (bottom-up regulation). Competition strong, predation weak. T/pred: numbers limited by predation (top-down regulation). Competition weak, predation strong.

Stress tolerance and competition

Smooth cordgrass Salt meadow cordgrass Black needle rush

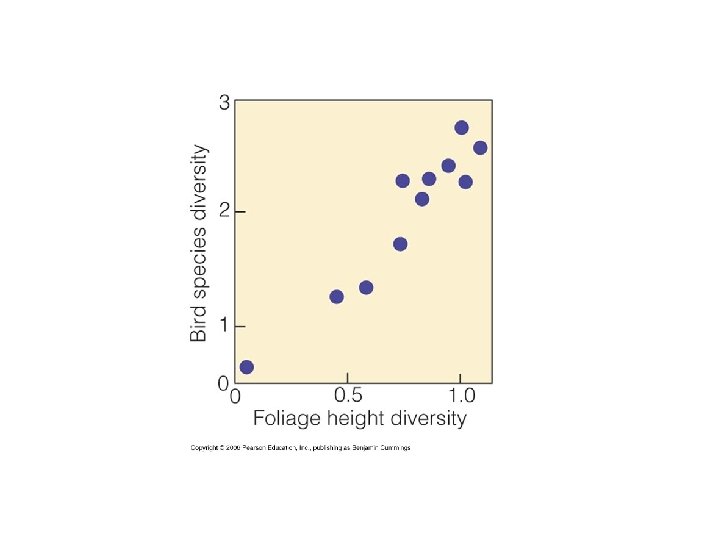
Environmental heterogeneity
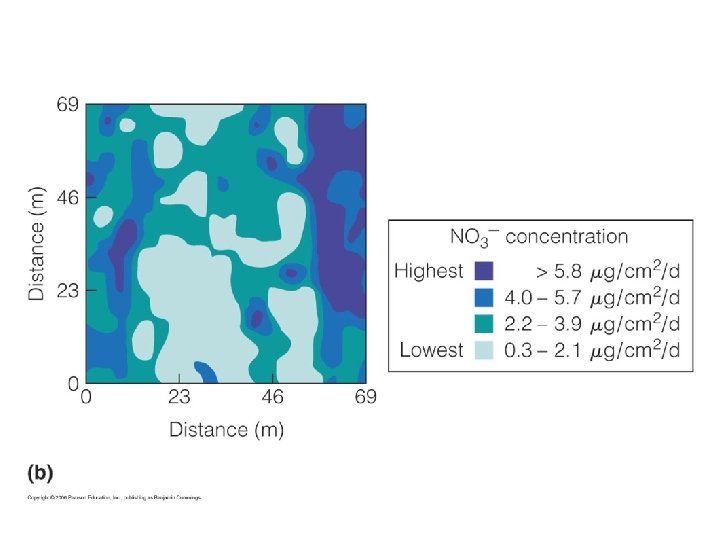

Relationship between the number of plants per 300 m 2 plot beside the hood river, NWT, and an index (ranging from 0 to 1) of spatial heterogeneity in abiotic factors associated with topography and soil. More spatially heterogeneous plots had higher species richness.

Environmental quality

Plant species diversity in a control plot and a fertilized plot in the Parkgrass experiment in Rothamstead, England. Fertilized plots have lower species diversity. The Parkgrass experiment, which began in 1856, is the longest running ecological experiment.

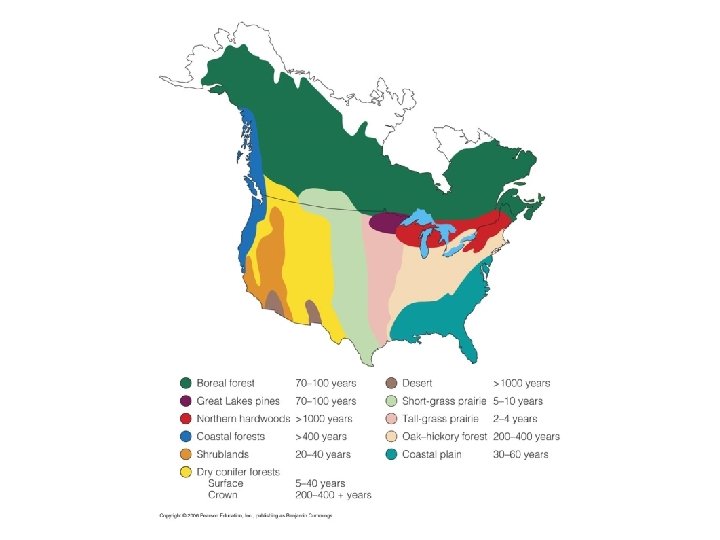
Community stability Types of stability: 1. Resilient community: returns to former state after disturbance 2. Resistant community: changes little in response to disturbance

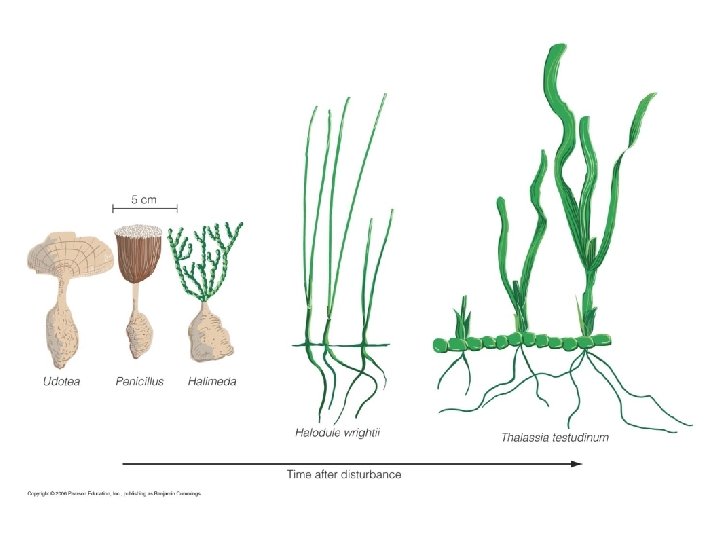
Community dynamics: Succession

Primary succession Pioneer species Late successional species

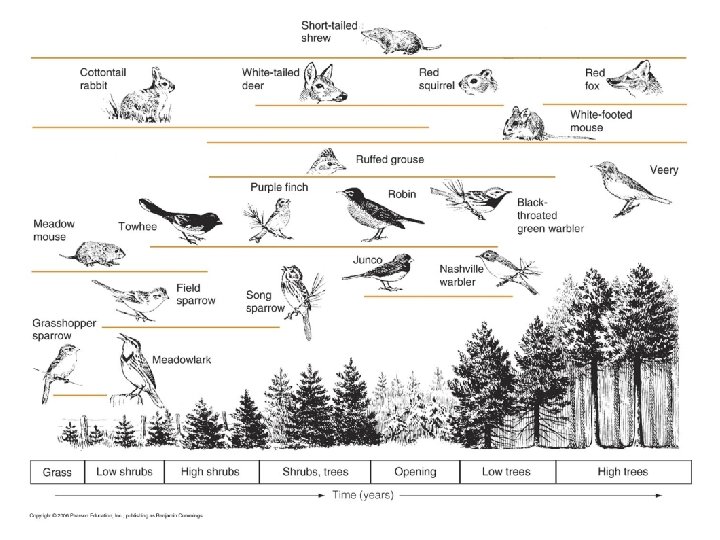
Secondary succession

beach grass shrubs pines oak

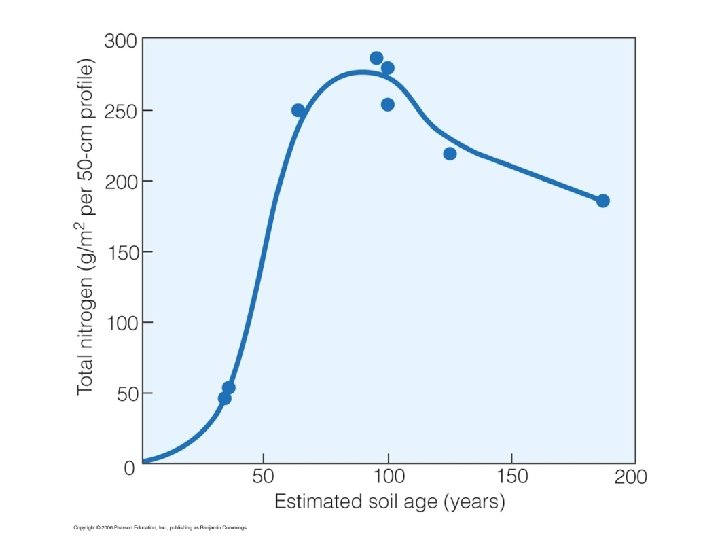
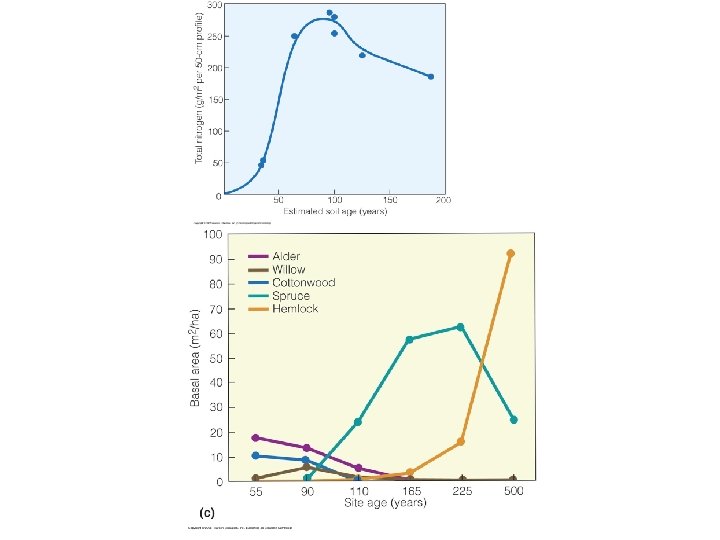
Primary succession: newly exposed substrate

Dryas sp. An early succession species on glacial moraines in Glacier bay. Dryas is a symbiotic N-fixing plant

Populus trichocarpa Salix arctica After Dryas, cottonwood and willows become established

Alnus incana Alders become the dominant tree after 50 years

“Climax”: mixed spruce-hemlock forest Picea sitchensis Tsuga mertensiana

Secondary succession: after disturbance

Density Autogenic vs. allogenic change

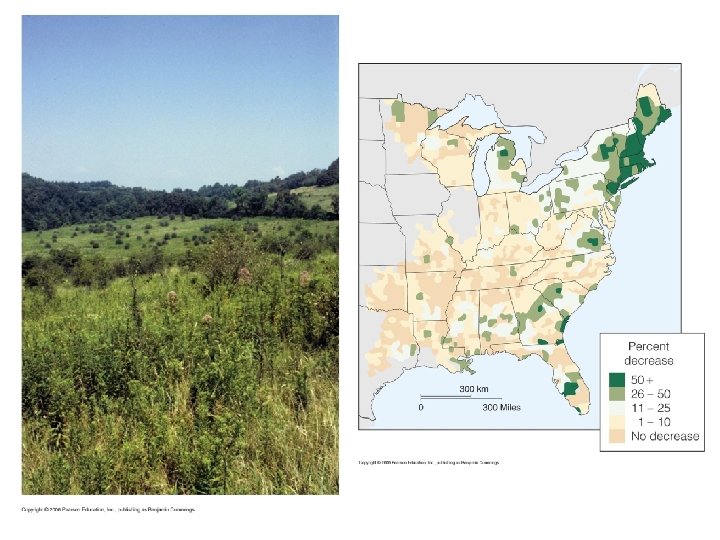
Allogenic environmental change

Species diversity during succession Oak-pine forest

Intermediate disturbance hypothesis

Intermediate disturbance hypothesis High Low

In New Zealand streams, less disturbed sites support more complex communities (i. e. , communities with larger, more connected food webs)

Succession of heterotrophs Bark beetle/woodboring beetle Fungi/bacteria Predatory insects Moss and lichen Invertebrates/ mice/ salamanders

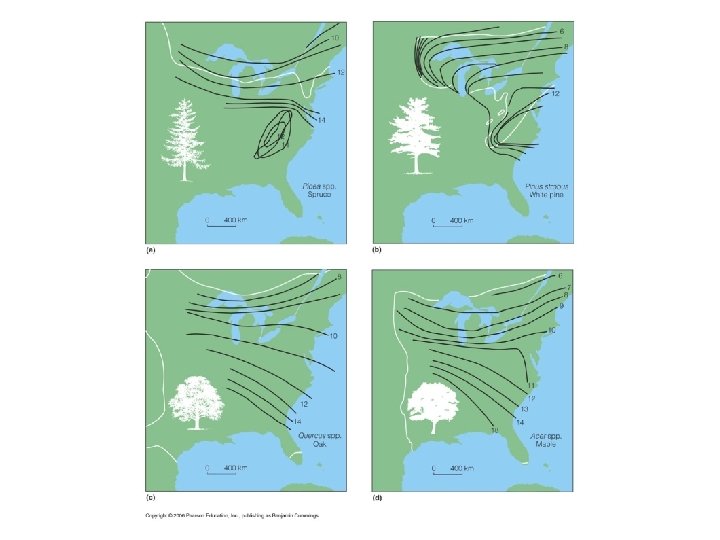
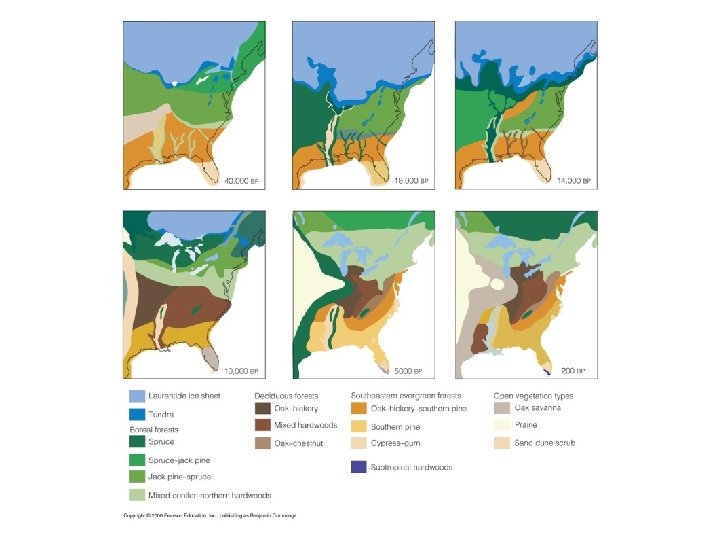
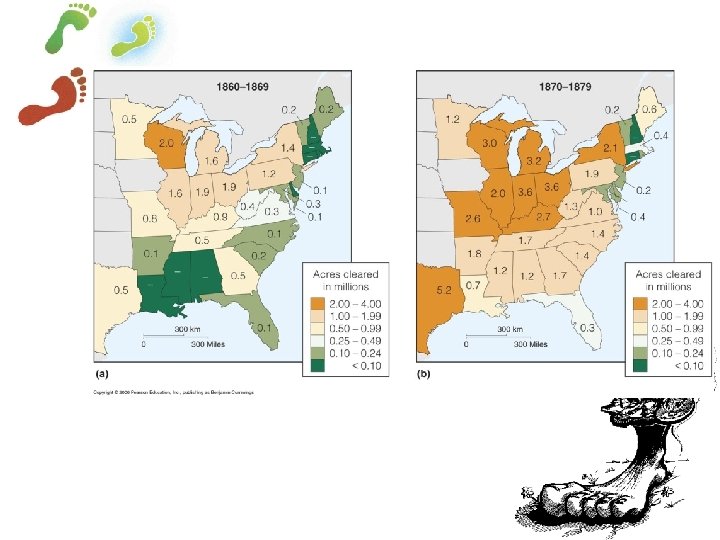
Changes over geologic time

Concept of community revisited

Concept of community revisited
- Slides: 75