Community and Ecosystem Ecology Community set of populations


 = the number of species in")
) pi =")
 index H =")


 vs Offtake (of kelp by urchins) in a")

- Slides: 22
Community and Ecosystem Ecology Community = set of populations that occupy a given area, interacting directly or indirectly CH 16, 19. 6 – 19. 9, OH Set 18 & 19
Community Structure & Function Communities have emergent properties above the population level • • • Number of species Relative abundance of each species Coadaptation of species within community Trophic links between species Flow of energy or nutrients Stability/Instability Community Ecology Ecosystem Ecology
Community Structure and Diversity • Species richness (S) = the number of species in the community • Species evenness (or relative abundance) = the proportion that individuals of each species contribute to total individuals of all species
Two measures of community diversity Simpson’s index D = 1/( (pi 2)) pi = relative abundance of species i = ni / N D = 1 if only 1 species is present (no diversity) Dmax = S if all species have equal numbers (perfect evenness) Excel worksheet “Simpson and Shannon example”
Two measures of community diversity Shannon (or Shannon-Weiner or Shannon. Weaver) index H = - (pi)(lnpi) pi = relative abundance of each species = ni / N H = 0 if only 1 species is present (no diversity) Hmax = ln(S) if all species have equal numbers (perfect evenness) Excel worksheet “Simpson and Shannon example”
Species Rank - Abundance Curves incorporate both richness and even-ness
Species Accumulation Curves also reveal richness and evenness primary forest secondary forest plantation forest Allow comparison of diversity between taxonomic groups, ecosystems, sampling efforts. . . Barlow et al. PNAS 2007; 104: 18555 -18560
Not all species within a community are equivalent KEYSTONE DOMINANT Species Ecological Effect RARE UMBRELLA INDICATOR Species abundance (or biomass)
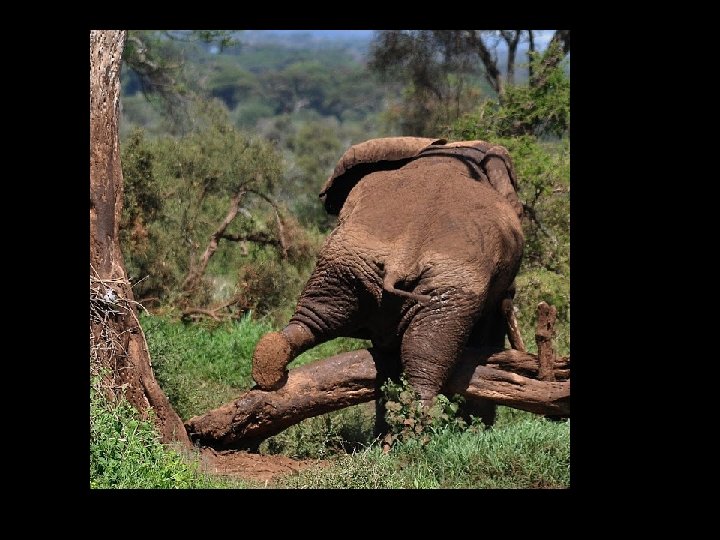
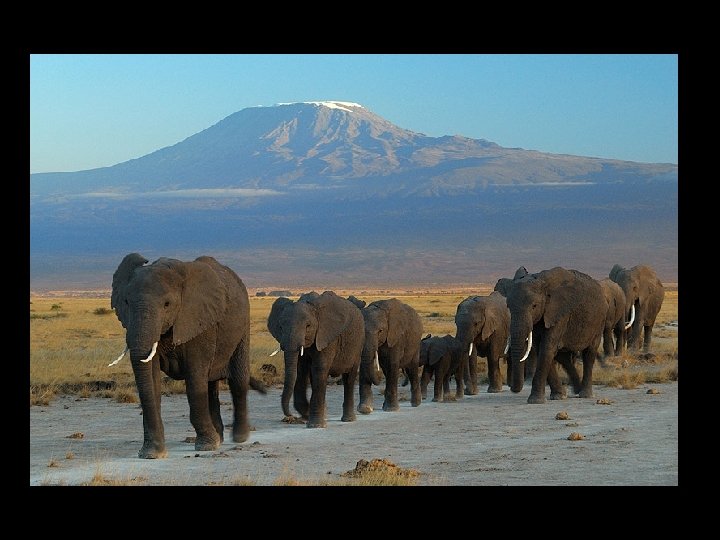
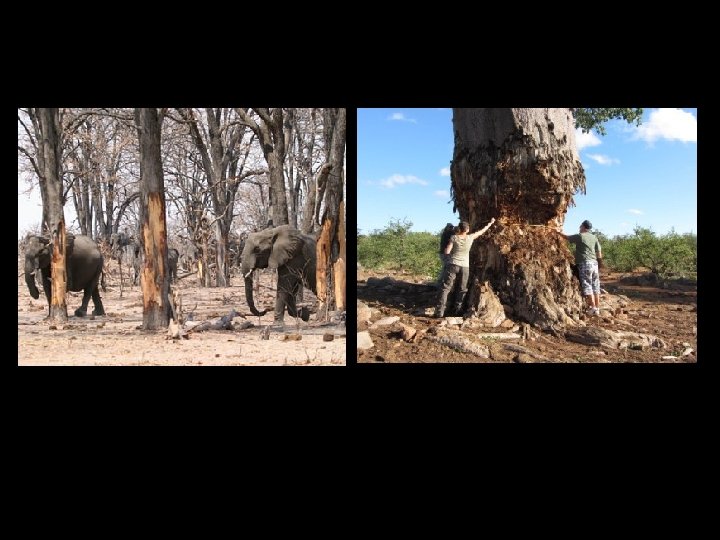
Elephants as keystone species Figs 16. 4 and 16. 5
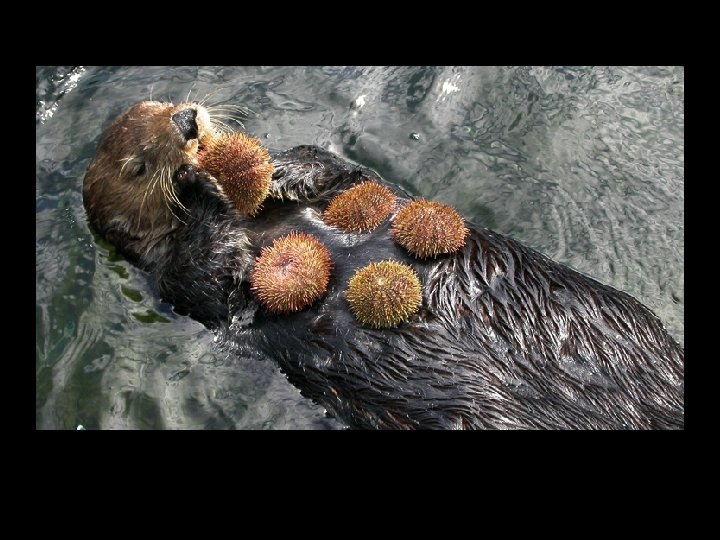
Sea otter
Sea urchin
Kelp
Kelp density urchin biomass Otter biomass Trophic Cascade 1 Time 2 Time 3 Time
Otter 1 presence increases kelp 2 density… … by decreasing urchin 3 density.
OTTER RECOLONIZATION Typically leads to urchin declines… … and kelp increase in some cases … …but not in others (hysteresis)
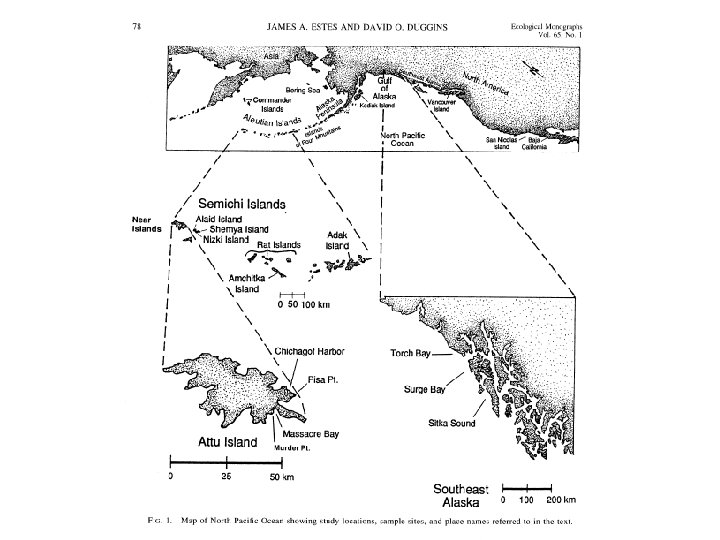
Urchin offtake or Recruitment (of kelp) vs Offtake (of kelp by urchins) in a heuristic model Estes and Duggins. 1995. Eco Monographs Kelp recruitment curve d. V/dt