
Committee of the Whole Colby College Board of
Committee of the Whole Colby College Board of Trustees October 2014 Friday, October 24, 2014

Investing in Financial Aid for Colby’s Future
Comparisons to Peer Institutions I. Total Expenditures on Financial Aid
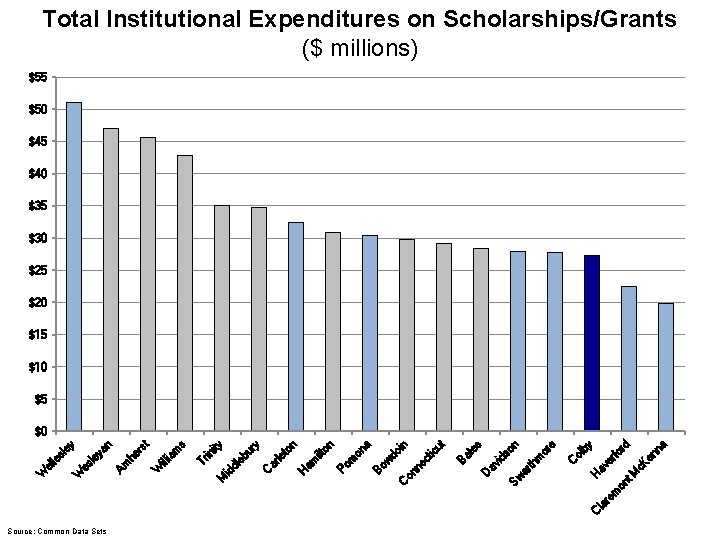
Source: Common Data Sets en na c. K rd by fo er av H t. M m on re la C ol C or e m th s n ds o av i ar Sw D te Ba ut ic in do ne ct on C w Bo on a m Po on ilt n to ar le am H C ity eb ur y dl id M Tr in s am illi W rs t he Am n ey ya le es W sl le el W Total Institutional Expenditures on Scholarships/Grants ($ millions) $55 $50 $45 $40 $35 $30 $25 $20 $15 $10 $5 $0
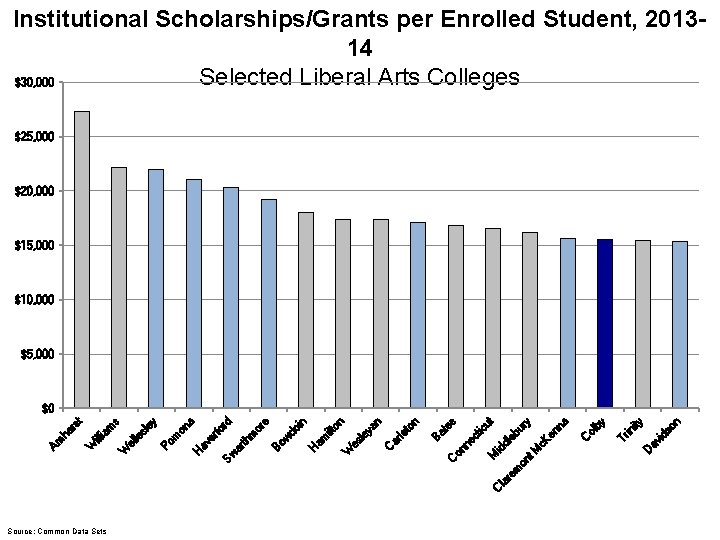
Institutional Scholarships/Grants per Enrolled Student, 201314 Selected Liberal Arts Colleges $30, 000 $25, 000 $20, 000 $15, 000 $10, 000 $5, 000 Source: Common Data Sets D av i ds o n ity Tr in by ol C c. K en na ry C la re m on t. M id dl ic M ne ct on C eb u ut s te Ba n to ar le le es W C ya n on ilt am H do in w Bo m Sw ar th er av H or e rd fo on a Po m ey W el le sl am illi W Am he rs t s $0
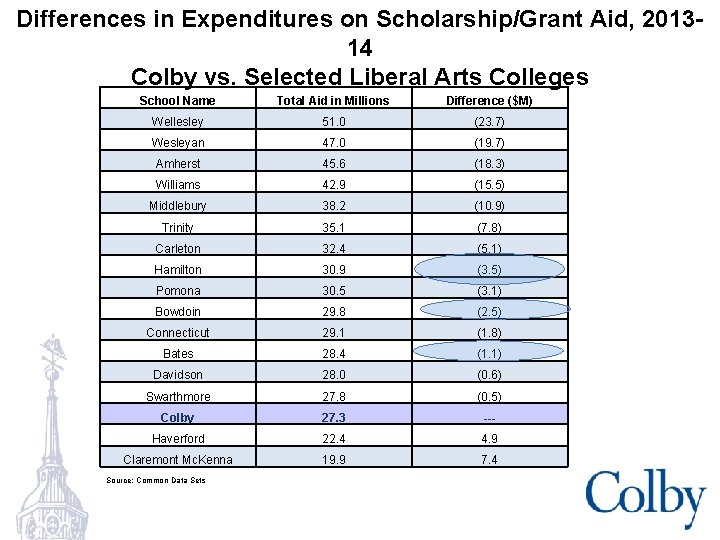
Differences in Expenditures on Scholarship/Grant Aid, 201314 Colby vs. Selected Liberal Arts Colleges School Name Total Aid in Millions Difference ($M) Wellesley 51. 0 (23. 7) Wesleyan 47. 0 (19. 7) Amherst 45. 6 (18. 3) Williams 42. 9 (15. 5) Middlebury 38. 2 (10. 9) Trinity 35. 1 (7. 8) Carleton 32. 4 (5. 1) Hamilton 30. 9 (3. 5) Pomona 30. 5 (3. 1) Bowdoin 29. 8 (2. 5) Connecticut 29. 1 (1. 8) Bates 28. 4 (1. 1) Davidson 28. 0 (0. 6) Swarthmore 27. 8 (0. 5) Colby 27. 3 --- Haverford 22. 4 4. 9 Claremont Mc. Kenna 19. 9 7. 4 Source: Common Data Sets
Comparisons to Peer Institutions II. Percentage of Students Receiving Aid
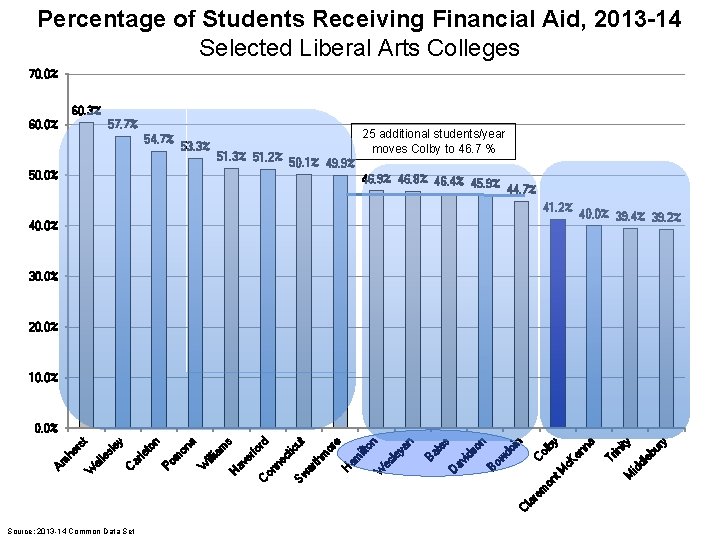
Percentage of Students Receiving Financial Aid, 2013 -14 Selected Liberal Arts Colleges 70. 0% 60. 3% 57. 7% 60. 0% 54. 7% 53. 3% 51. 2% 50. 0% 25 additional students/year moves Colby to 46. 7 % 50. 1% 49. 9% 46. 8% 46. 4% 45. 9% 44. 7% 41. 2% 40. 0% 39. 4% 39. 2% 30. 0% 20. 0% 10. 0% M id dl eb ur y ity Tr in c. K t. M m on re la C Source: 2013 -14 Common Data Set en na by C ol do w Bo ds o av i D in n s te Ba n ya W es le ilt am H m th ar on or e ut ic ne ct Sw C on er fo rd s av H W illi am on a m n Po C ar le to ey sl le el W Am he rs t 0. 0%
Comparisons to Peer Institutions III. Colby’s Aid Packages
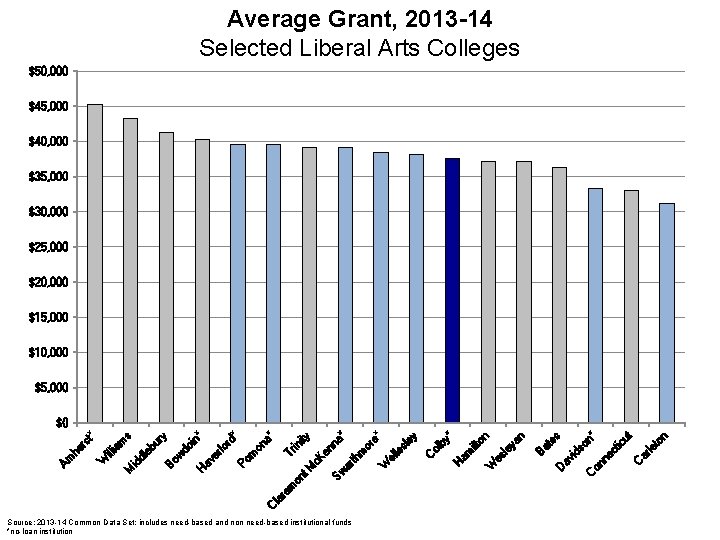
Average Grant, 2013 -14 Selected Liberal Arts Colleges $50, 000 $45, 000 $40, 000 $35, 000 $30, 000 $25, 000 $20, 000 $15, 000 $10, 000 $5, 000 Source: 2013 -14 Common Data Set; includes need-based and non need-based institutional funds *no-loan institution n to ar le ic ut C on C D av id ne ct so n* s te Ba le es W am ilt ya n on * C ol by H W el le sl or ey e* a* ar th m en n Sw c. K t. M C la re m on M id dl Tr in ity eb ur y Bo w do in * H av er fo rd * Po m on a* am illi W Am he rs t s * $0
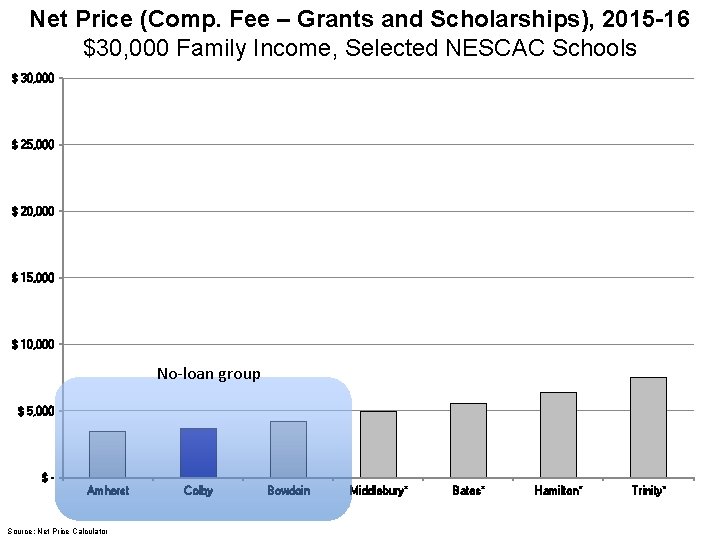
Net Price (Comp. Fee – Grants and Scholarships), 2015 -16 $30, 000 Family Income, Selected NESCAC Schools $ 30, 000 $ 25, 000 $ 20, 000 $ 15, 000 $ 10, 000 No-loan group $ 5, 000 $Amherst Source: Net Price Calculator Colby Bowdoin Middlebury* Bates* Hamilton* Trinity*

Net Price (Comp. Fee – Grants and Scholarships), 2015 -16 $70, 000 Family Income, Selected NESCAC Schools $ 30, 000 $ 25, 000 $ 20, 000 $ 15, 000 $ 10, 000 $ 5, 000 $Colby Source: Net Price Calculator Amherst Bowdoin Bates* Middlebury* Hamilton* Trinity*
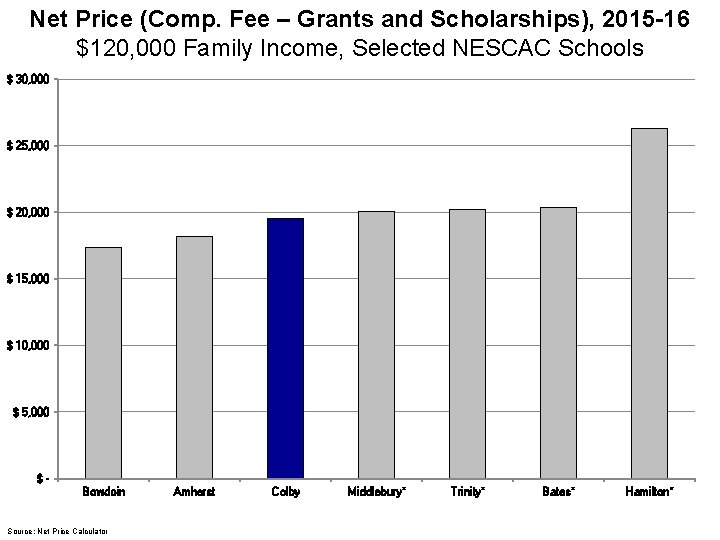
Net Price (Comp. Fee – Grants and Scholarships), 2015 -16 $120, 000 Family Income, Selected NESCAC Schools $ 30, 000 $ 25, 000 $ 20, 000 $ 15, 000 $ 10, 000 $ 5, 000 $Bowdoin Source: Net Price Calculator Amherst Colby Middlebury* Trinity* Bates* Hamilton*
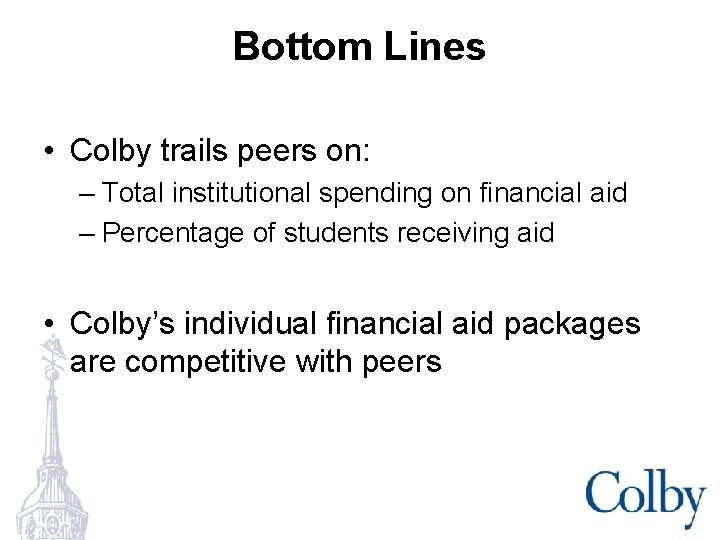
Bottom Lines • Colby trails peers on: – Total institutional spending on financial aid – Percentage of students receiving aid • Colby’s individual financial aid packages are competitive with peers
Investing in Financial Aid in the Context of Colby’s Applicant Pool
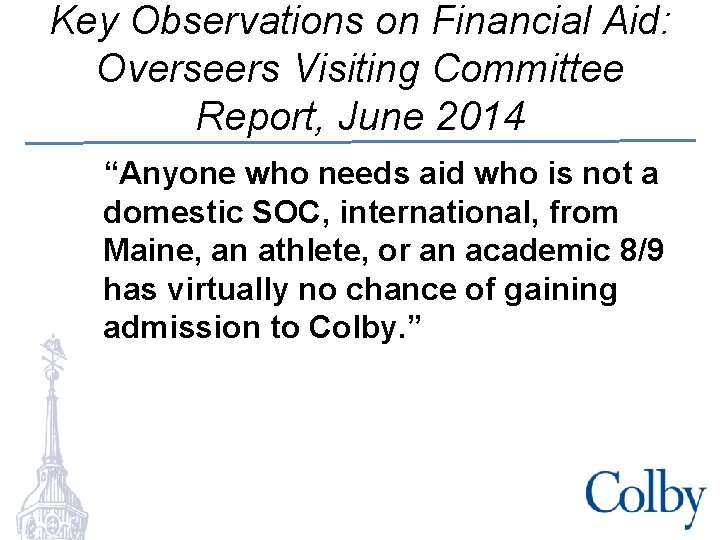
Key Observations on Financial Aid: Overseers Visiting Committee Report, June 2014 “Anyone who needs aid who is not a domestic SOC, international, from Maine, an athlete, or an academic 8/9 has virtually no chance of gaining admission to Colby. ”
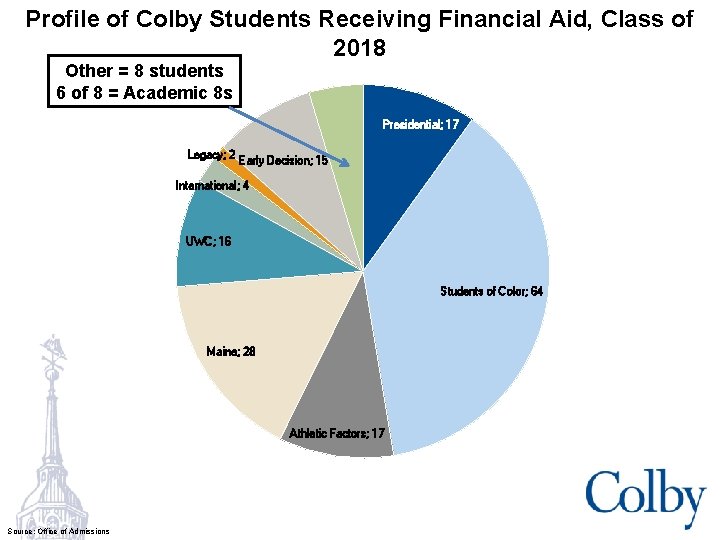
Profile of Colby Students Receiving Financial Aid, Class of 2018 Other = 8 students 6 of 8 = Academic 8 s Presidential; 17 Legacy; 2 Early Decision; 15 International; 4 UWC; 16 Students of Color; 64 Maine; 28 Athletic Factors; 17 Source: Office of Admissions
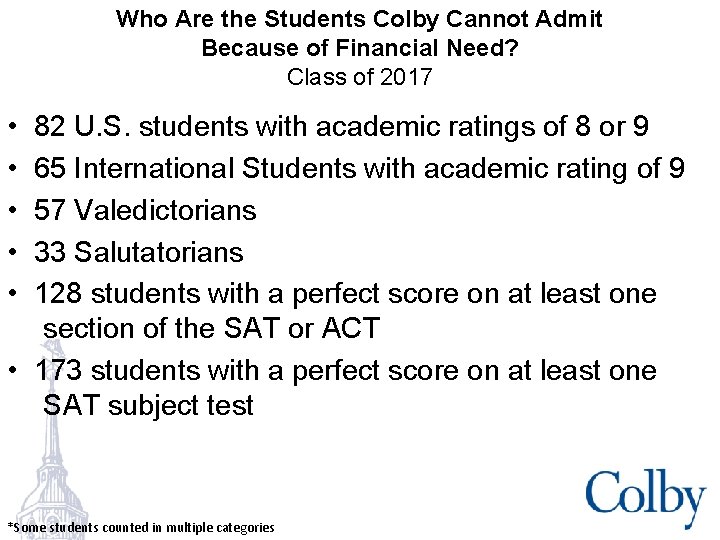
Who Are the Students Colby Cannot Admit Because of Financial Need? Class of 2017 • • • 82 U. S. students with academic ratings of 8 or 9 65 International Students with academic rating of 9 57 Valedictorians 33 Salutatorians 128 students with a perfect score on at least one section of the SAT or ACT • 173 students with a perfect score on at least one SAT subject test *Some students counted in multiple categories
What Would an Investment in Financial Aid Achieve?
Scenario A: Based on the Class of 2017 • No change for students fulfilling an institutional objective (athletic factor, Maine, SOC, UWC, legacy, etc. ). • Remove the 20 (25, 30, 35) of the academically weakest, regular decision, full-pay students who do not fulfill one of those institutional goals. • Replace these 20 (25, 30, 35) with top aided students from the waitlist, including 5 international students, based on the predicted yield.
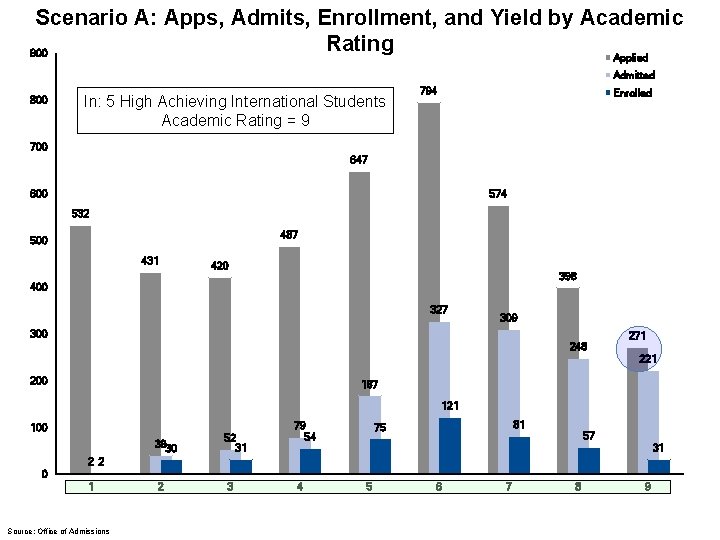
Scenario A: Apps, Admits, Enrollment, and Yield by Academic Rating 900 Applied Admitted 800 In: 5 High Achieving International Students Academic Rating = 9 794 Enrolled 700 647 600 574 532 487 500 431 420 398 400 327 309 300 248 271 221 200 167 121 100 3930 52 31 2 3 79 54 81 75 57 31 2 2 0 1 Source: Office of Admissions 4 5 6 7 8 9
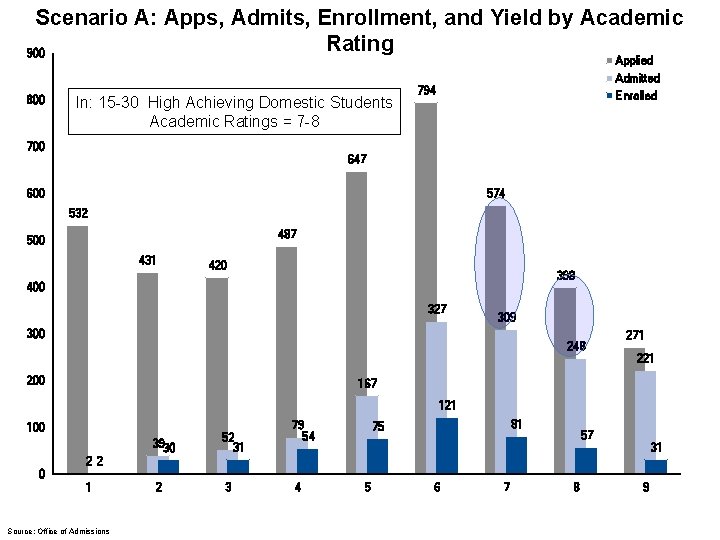
Scenario A: Apps, Admits, Enrollment, and Yield by Academic Rating 900 Applied Admitted 800 In: 15 -30 High Achieving Domestic Students Academic Ratings = 7 -8 794 Enrolled 700 647 600 574 532 487 500 431 420 398 400 327 309 300 248 271 221 200 167 121 100 3930 52 31 2 3 79 54 81 75 57 31 2 2 0 1 Source: Office of Admissions 4 5 6 7 8 9
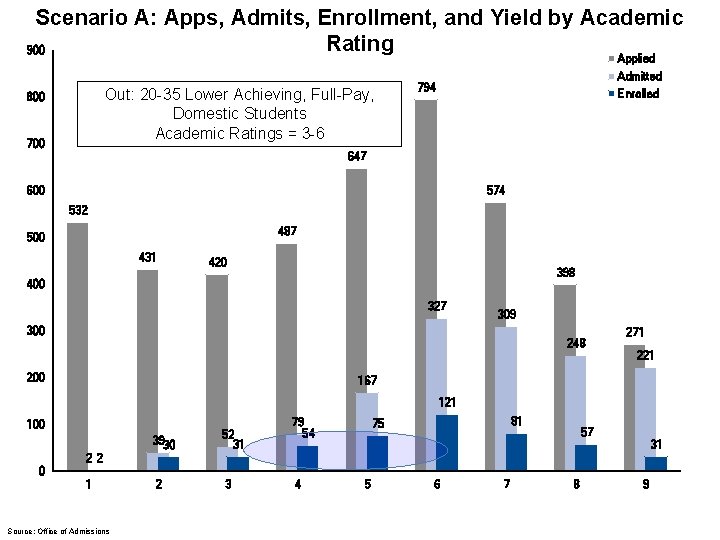
Scenario A: Apps, Admits, Enrollment, and Yield by Academic Rating 900 Applied Out: 20 -35 Lower Achieving, Full-Pay, Domestic Students Academic Ratings = 3 -6 800 700 Admitted 794 Enrolled 647 600 574 532 487 500 431 420 398 400 327 309 300 248 271 221 200 167 121 100 3930 52 31 2 3 79 54 81 75 57 31 2 2 0 1 Source: Office of Admissions 4 5 6 7 8 9
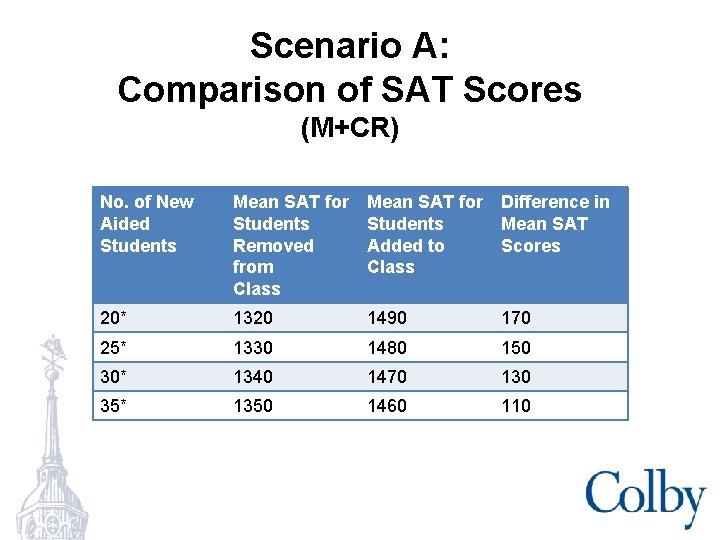
Scenario A: Comparison of SAT Scores (M+CR) No. of New Aided Students Mean SAT for Students Removed from Class Mean SAT for Difference in Students Mean SAT Added to Scores Class 20* 1320 1490 170 25* 1330 1480 150 30* 1340 1470 130 35* 1350 1460 110 *includes 5 international students
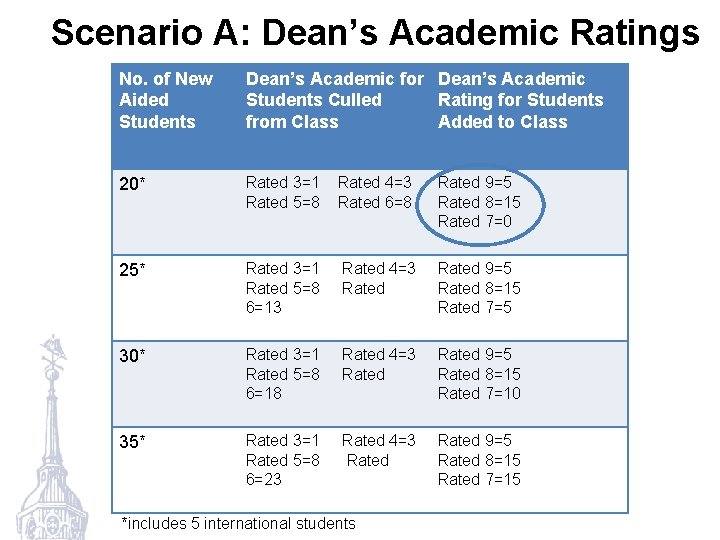
Scenario A: Dean’s Academic Ratings No. of New Aided Students Dean’s Academic for Dean’s Academic Students Culled Rating for Students from Class Added to Class 20* Rated 3=1 Rated 5=8 Rated 4=3 Rated 6=8 Rated 9=5 Rated 8=15 Rated 7=0 25* Rated 3=1 Rated 5=8 6=13 Rated 4=3 Rated 9=5 Rated 8=15 Rated 7=5 30* Rated 3=1 Rated 5=8 6=18 Rated 4=3 Rated 9=5 Rated 8=15 Rated 7=10 35* Rated 3=1 Rated 5=8 6=23 Rated 4=3 Rated 9=5 Rated 8=15 Rated 7=15 *includes 5 international students
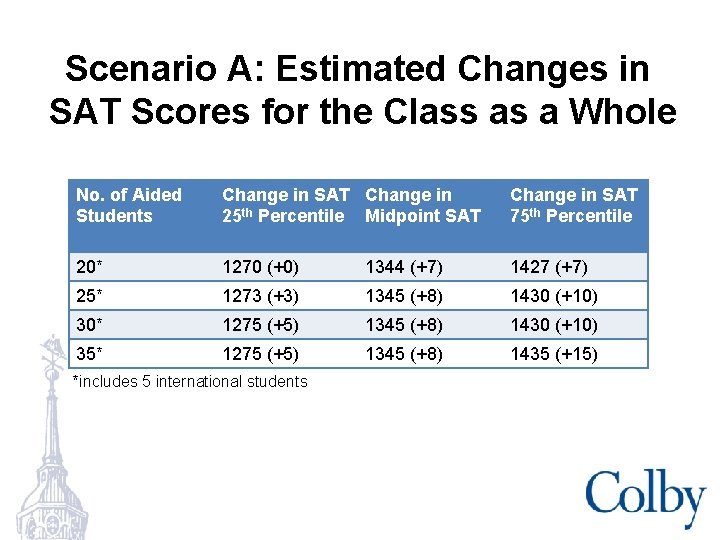
Scenario A: Estimated Changes in SAT Scores for the Class as a Whole No. of Aided Students Change in SAT Change in 25 th Percentile Midpoint SAT Change in SAT 75 th Percentile 20* 1270 (+0) 1344 (+7) 1427 (+7) 25* 1273 (+3) 1345 (+8) 1430 (+10) 30* 1275 (+5) 1345 (+8) 1430 (+10) 35* 1275 (+5) 1345 (+8) 1435 (+15) *includes 5 international students
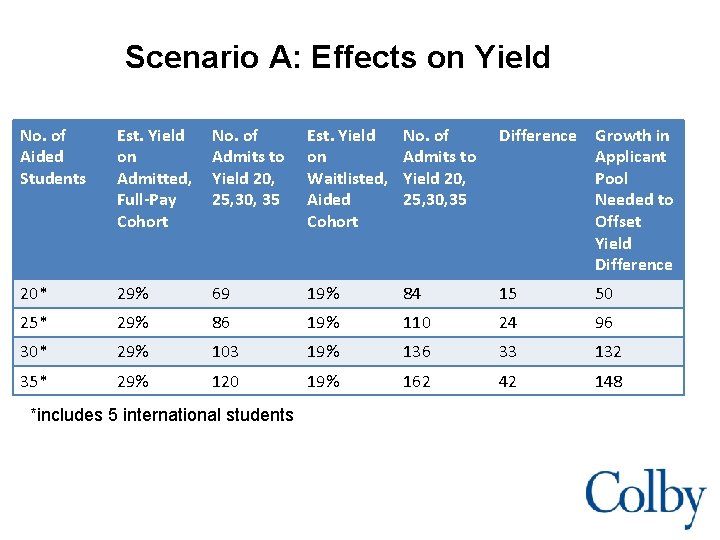
Scenario A: Effects on Yield No. of Aided Students Est. Yield on Admitted, Full-Pay Cohort No. of Admits to Yield 20, 25, 30, 35 Est. Yield on Waitlisted, Aided Cohort No. of Admits to Yield 20, 25, 30, 35 Difference Growth in Applicant Pool Needed to Offset Yield Difference 20* 29% 69 19% 84 15 50 25* 29% 86 19% 110 24 96 30* 29% 103 19% 136 33 132 35* 29% 120 19% 162 42 148 * *includes 5 international students
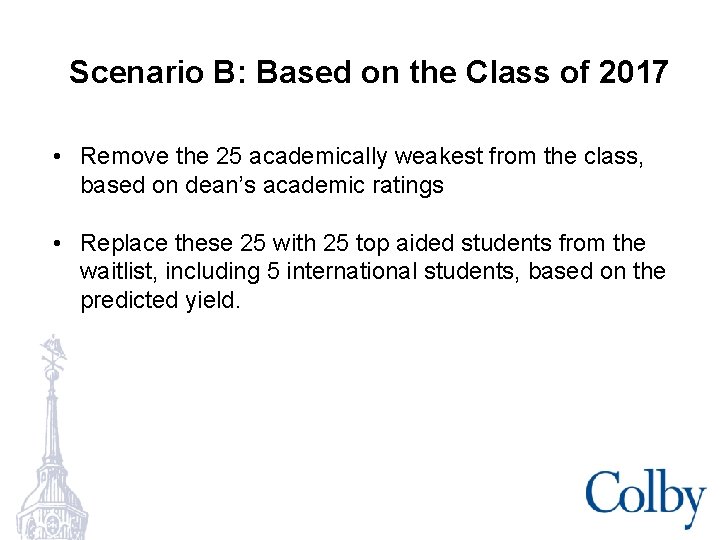
Scenario B: Based on the Class of 2017 • Remove the 25 academically weakest from the class, based on dean’s academic ratings • Replace these 25 with 25 top aided students from the waitlist, including 5 international students, based on the predicted yield.
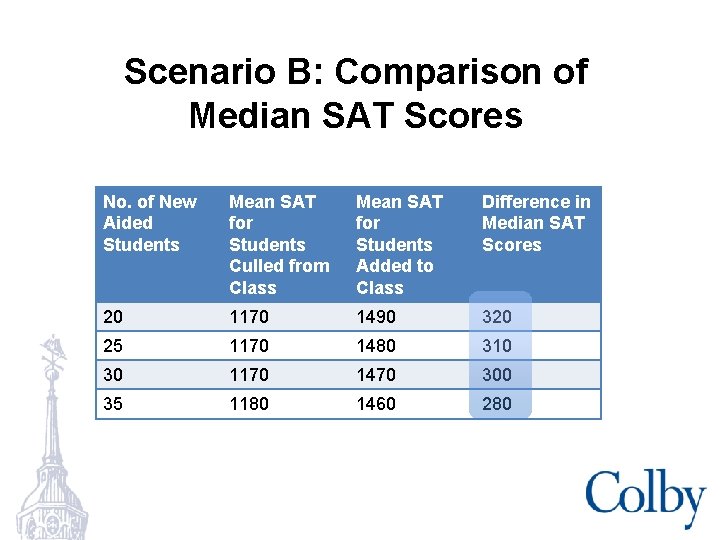
Scenario B: Comparison of Median SAT Scores No. of New Aided Students Mean SAT for Students Culled from Class Mean SAT for Students Added to Class Difference in Median SAT Scores 20 1170 1490 320 25 1170 1480 310 30 1170 1470 300 35 1180 1460 280
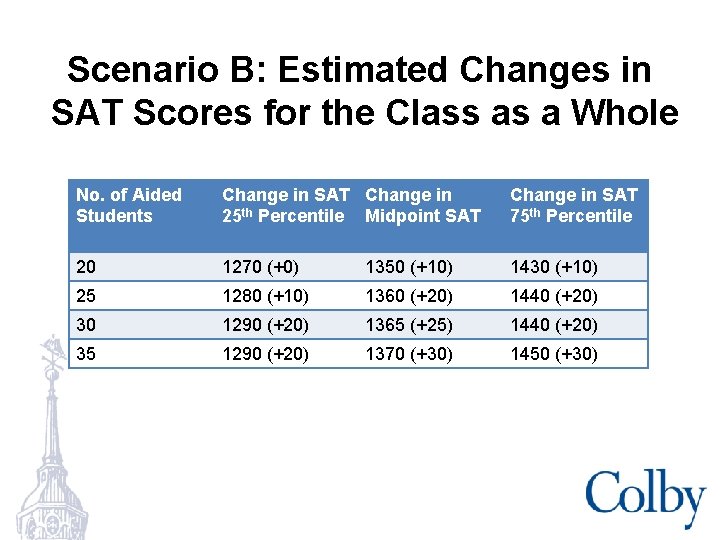
Scenario B: Estimated Changes in SAT Scores for the Class as a Whole No. of Aided Students Change in SAT Change in 25 th Percentile Midpoint SAT Change in SAT 75 th Percentile 20 1270 (+0) 1350 (+10) 1430 (+10) 25 1280 (+10) 1360 (+20) 1440 (+20) 30 1290 (+20) 1365 (+25) 1440 (+20) 35 1290 (+20) 1370 (+30) 1450 (+30)
Budget Implications
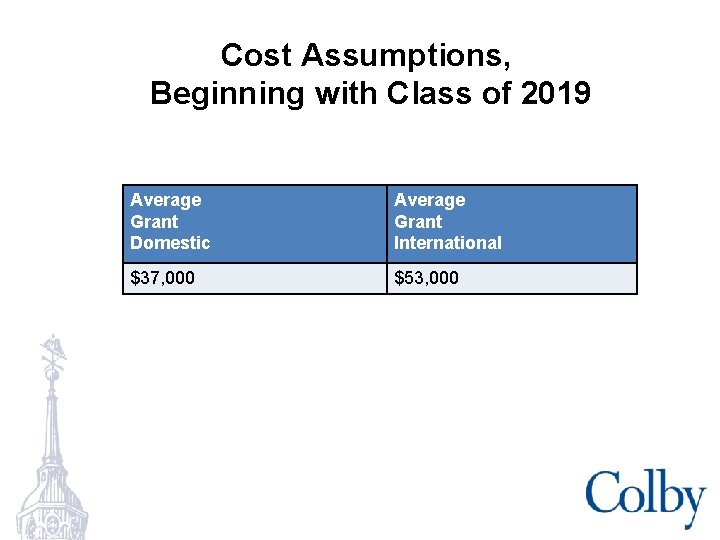
Cost Assumptions, Beginning with Class of 2019 Average Grant Domestic Average Grant International $37, 000 $53, 000
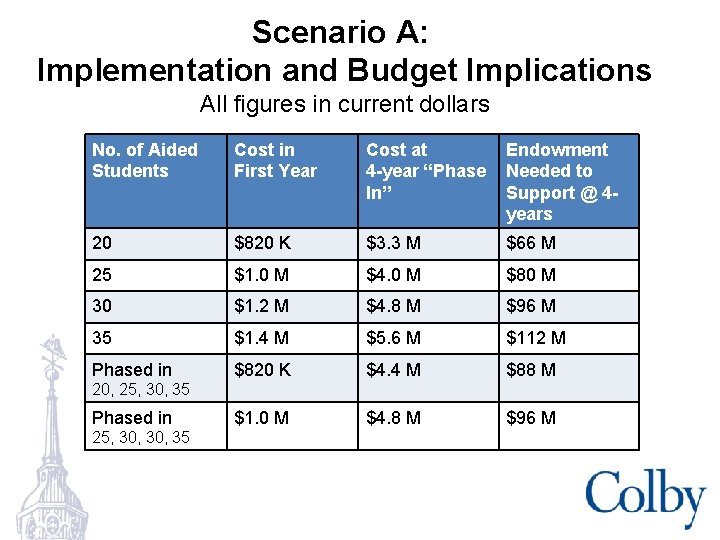
Scenario A: Implementation and Budget Implications All figures in current dollars No. of Aided Students Cost in First Year Cost at 4 -year “Phase In” Endowment Needed to Support @ 4 years 20 $820 K $3. 3 M $66 M 25 $1. 0 M $4. 0 M $80 M 30 $1. 2 M $4. 8 M $96 M 35 $1. 4 M $5. 6 M $112 M Phased in $820 K $4. 4 M $88 M $1. 0 M $4. 8 M $96 M 20, 25, 30, 35 Phased in 25, 30, 35
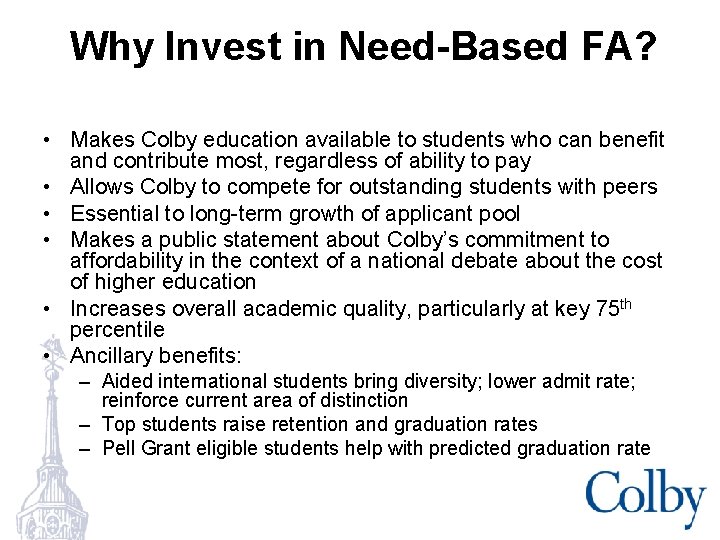
Why Invest in Need-Based FA? • Makes Colby education available to students who can benefit and contribute most, regardless of ability to pay • Allows Colby to compete for outstanding students with peers • Essential to long-term growth of applicant pool • Makes a public statement about Colby’s commitment to affordability in the context of a national debate about the cost of higher education • Increases overall academic quality, particularly at key 75 th percentile • Ancillary benefits: – Aided international students bring diversity; lower admit rate; reinforce current area of distinction – Top students raise retention and graduation rates – Pell Grant eligible students help with predicted graduation rate
- Slides: 34