
Combined science Biology Key stage 4 Ecology Sampling
Combined science - Biology - Key stage 4 Ecology Sampling Required Practical 2 Dr Clapp

Independent practice Calculate the percentage cover in these quadrats: a. b. Bush Source: Pixabay
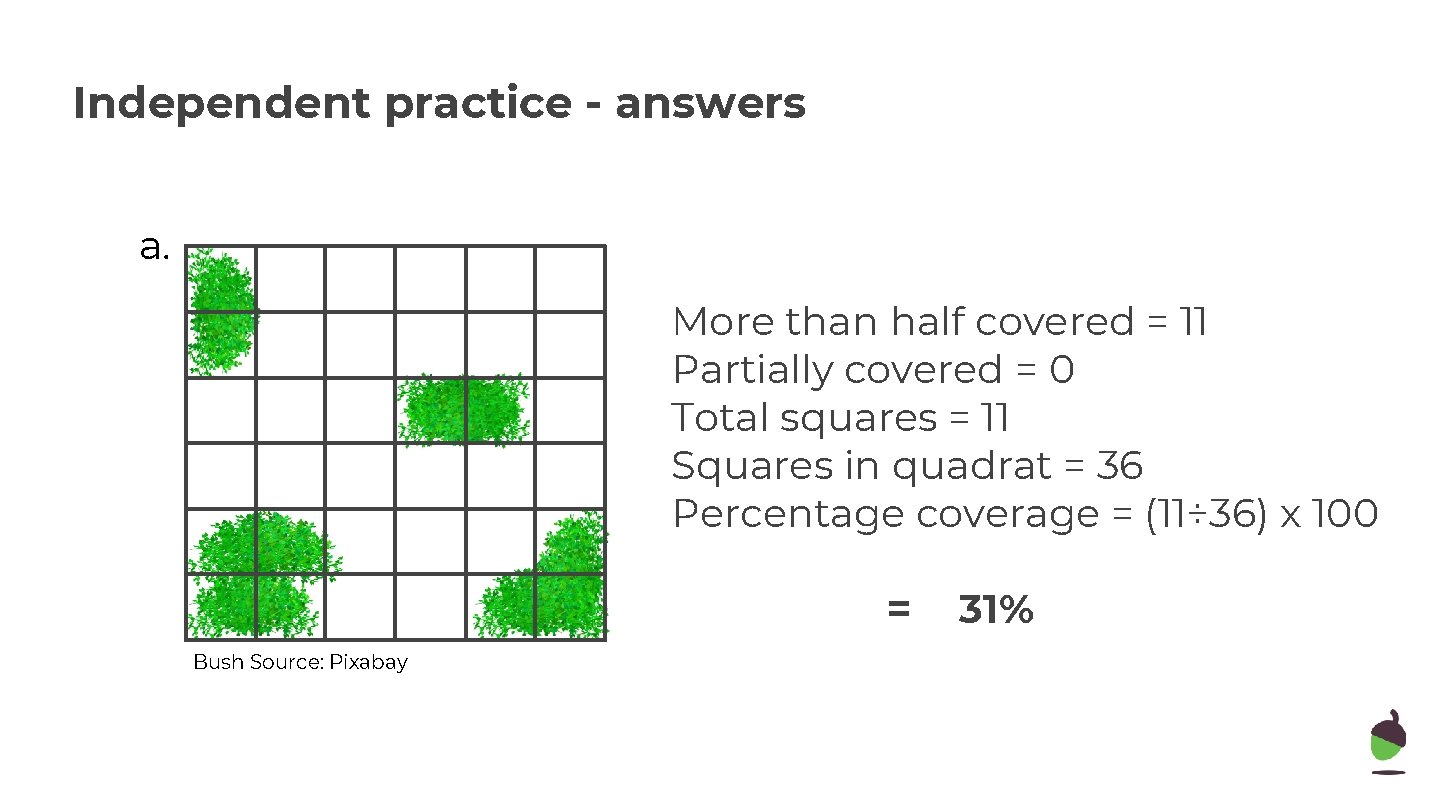
Independent practice - answers a. More than half covered = 11 Partially covered = 0 Total squares = 11 Squares in quadrat = 36 Percentage coverage = (11÷ 36) x 100 = Bush Source: Pixabay 31%

Independent practice - answers b. More than half covered = 12 Partially covered = 1 Total squares = 13 Squares in quadrat = 36 Percentage coverage = (13÷ 36) x 100 = 36% Bush Source: Pixabay
Independent practice Bluebells grow better in shady woodland areas than in full sun 1. What are the independent, dependent and control variables for this hypothesis? 2. Describe a method to test this hypothesis. (key words: Quadrat, random, area, multiple, count, woodland, full sun)
Independent practice - answers Bluebells grow better in shady woodland areas than in full sun 1. IV = light intensity, DV = bluebell growth, CV = water availability, space
Independent practice - answers - Measure the area of a sample site in woodland - Use a grid and a random number generator to choose 10 random coordinates - Place a quadrat in the coordinates and count the number of bluebells - Calculate a mean and multiply up to estimate the number in the woodland - Repeat the whole procedure using a site that is in full sun – e. g an open field.
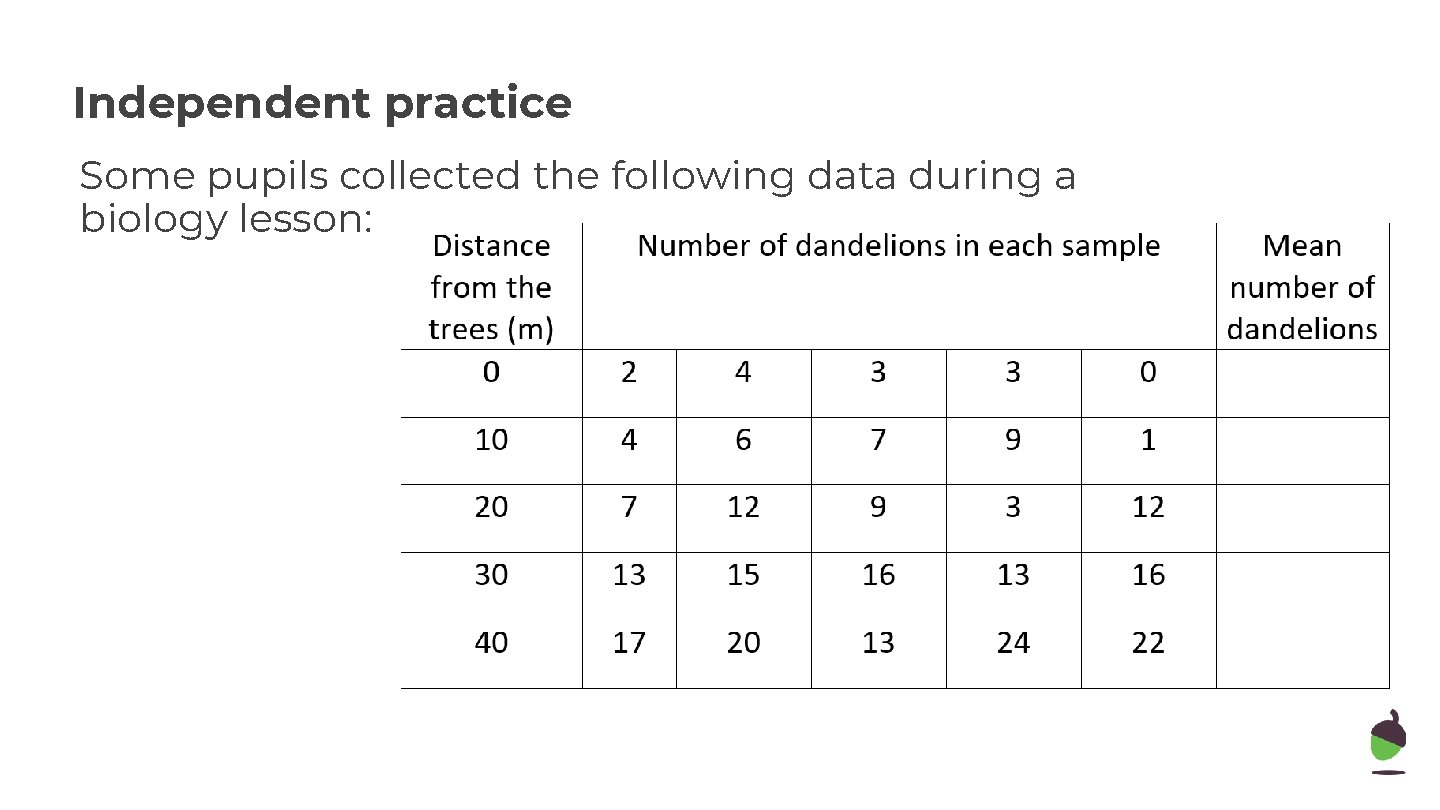
Independent practice Some pupils collected the following data during a biology lesson:
Independent practice 1. What hypothesis were they testing? (1) 2. Describe the method they have used to collect this data. (4) 3. What was the median number of dandelions at 20 m? (1) 4. What was the mode at 0 m? (1) 5. Calculate the mean number of dandelions for each distance. (5) 6. Describe the pattern shown. (2) 7. Explain, as fully as you can, why this might be the case. (4)
Independent practice - answers 1. What hypothesis were they testing? (1) How distance from trees affected the number of dandelions 2. Describe the method they have used to collect this data. (4) They would have placed a transect line from under the trees out into the open space and then placed a quadrat at 1 m intervals along the transect line (1). At every interval they would have randomly placed multiple quadrats (1) and taken an average (1) of how many dandelions there were and then compared the data to look for trends (1).
Independent practice - answers 3. What was the median number of dandelions at 20 m? (1) 9 4. What was the mode at 0 m? (1) 3 5. Calculate the mean number of dandelions for each distance. (5) 0 m = 2. 4, 10 m = 5. 4, 20 m = 8. 6, 30 m = 14. 6, 40 m = 19. 2
Independent practice - answers 6. Describe the pattern shown. (2) As distance from the trees increases so does the number of dandelions found (1). For example at 0 m there was an average of 2. 4 dandelions but at 40 m there was an average of 19. 2 dandelions (1).
Independent practice - answers 7. Explain, as fully as you can, why this might be the case. (4) Light intensity will be lower under the trees (1) and the dandelions would have to compete with the trees for water and nutrients from the soil (1). This would lead to less photosynthesis for the dandelions and therefore it would be harder for them to survive (1). As distance from the trees increases there would be more sunlight and less competition and therefore the population of dandelions would increase (1).
- Slides: 13