Colville Confederated Tribes Hatchery Subdivision Hatchery Subdivision Hatchery

Colville Confederated Tribes Hatchery Subdivision

Hatchery Subdivision Hatchery Project Twin Lakes Oxygenation Stock Lake Raise Fish Stock lakes and streams M&E Oxygenate Hypolimnion Monitor Effects Evaluate effects of oxygenation on fish Reduce Hatchery Densities Release Fish Rufus Woods M&E Rufus Woods Creel Survey Release Fish M&E Monitor Fish Releases Release Fish Rufus Woods Net Pens Raise Fish


Hatchery Project

Primary Goals Ø Raise fish for Reservation Waters. Ø Monitor Reservation waters to determine most efficient stocking strategies. Ø Evaluate projects that effect fish numbers/size in stocked waters. Ø Education and community involvement

Hatchery Accomplishments Ø Major Reduction in Mortality Ø Improvement in angler catch rates, average fish size and fish quality Ø Development of redband broodstock, evaluation and decision to eliminate redband program Ø Match stocking program to lake needs Ø Improvements to hatchery water system Ø Hatchery tours and fishing derbies Ø Graduate student program

Reduction in Hatchery Mortality Eastern Brook Trout Program over the past years. Brood Year # Eyed # Green Eggs 2005 655, 477 397, 999 2006 1, 544, 307 1, 108, 086 2007 1, 063, 047 2008 # Ponded # Planted 57, 592 % Planted 38, 007 5. 80% 576, 475 351, 454 22. 76% 512, 602 268, 857 206, 179 19. 40% 930, 981 683, 402 520, 671 470, 731 50. 56% 2009 436, 655 388, 115 341, 727 338, 772 77. 58% 2010 278, 829 193, 482 183, 808 157, 931 56. 64% * 2011 260, 058 234, 385 ** * A large number of eggs identified were unfertilized, hatchery currently has 22, 952 EBT 10 on station. ** Hatchery culled 63, 113 eyed eggs from population since egg mortality was very low.

Improvements to Catch Rate and Size South Twin Lake rainbow trout Annual Catch Rate and Average Size 700 1 0. 9 600 500 0. 7 0. 6 400 0. 5 300 0. 4 0. 3 200 0. 2 100 0. 1 0 0 2007 2008 2009 Year 2010 2011 Fish Per Hour Average Weight (grams) 0. 8 Ave. Size (grams) CPUE

Redband Rainbow Broodstock Development Ø Ø Ø Ø Broodstock collection began in 2003 First planted in 2006 100% redband plant 2009 -2011 Poor hatchery performance Poor lake performance Outmigration Genetic issues Last redband plant in 2012

Matching stocking program to lake needs Ø Eliminate stocking in Gold and Round Lakes Ø Reduce stocking in Owhi and Twin Lakes OWHI Twin Lakes 60000 900000 Redband fry 800000 50000 700000 40000 600000 500000 30000 400000 300000 200000 100000 0 0 Year 2004 Year 2005 Year 2006 Year 2007 Year 2008 Year 2009 Year 2010 Year 2011

Water System Improvements Ø Completed Construction Project in October 2011 1. Installed Low Head Oxygenators (LHO’s) and Oxygen Generators 2. Bypassed Water Distribution Tower (25’) by piping directly to raceways. 3. Installed gate valves to allow flexibility in directing water and well usage.

Education programs Ø Frequent hatchery tours for school groups Ø Fishing derbies Ø Graduate student program with WSU Ø 8 MS degrees completed Ø 2 Ph. D degrees completed Ø 2 MS degrees in progress Ø 3 Ph. D degrees in progress

Monitoring and Evaluation Ø Whole Lake Study Detailed study in cooperation with WSU. Presently studying Owhi Lake. Previously studied Twin Lakes. Ø Major Lakes. Ø Smaller stocked lakes Ø Streams Ø Evaluate other related projects. Twin Lakes Oxygenation

Whole Lake Study Owhi Lake Ø Limnology Ø Cyanobacteria Ø Creel Ø Fish numbers and condition

Major Lakes Twin, Owhi, Buffalo, Omak Goals 1. Fish numbers, growth and condition 2. Appropriateness of present stocking strategy 3. Potential for major problem (e. g. algae bloom) Tools 1. Monthly gill net survey 2. Monthly hydroacoustic survey 3. Creel surveys

Small Lakes All small lakes that are stocked Goals 1. Appropriateness of present stocking strategy 2. Fish growth and condition Tools 1. August/September gill net survey Results 1. Substantial modification to stocking strategy.

Streams Goals Appropriateness of present stocking strategy Tools Pre and post stocking electro-fishing surveys Results No fall stocking Multiple small plants instead of one large one
. Tools")
Project Evaluation Goals Evaluate effectiveness of specific project (e. g. Twin Lakes oxygenation). Tools 1. 2. 3. 4. Gill net surveys Hydroacoustic surveys Creel surveys Measurement of physical parameters

Rufus Woods Creel Project

Rufus Woods Creel

Background Ø Rufus Woods Aquaculture Ø Stocking History State and Tribal Hatcheries Early Net Pen Releases Rufus Woods Net Pen Project Ø Creel Studies Angling Pressure Fish Origin

Study Goals Ø Maintain Quality Fishery Ø Determine Most Economic Way to Supplement Fishery Ø Determine Causes of Fish Loss Ø Determine Risk to ESA listed fish below CJD

Catch Rates and Angling Pressure

Production Potential Eco. Analysts Study ØGoals Potential Food Resources Determine What Trout are Eating Ø Tools Stomach sample analysis Basic Rufus Woods Background Study Suction dredge Cobble basket Bathymetry

RBT stomach content analysis

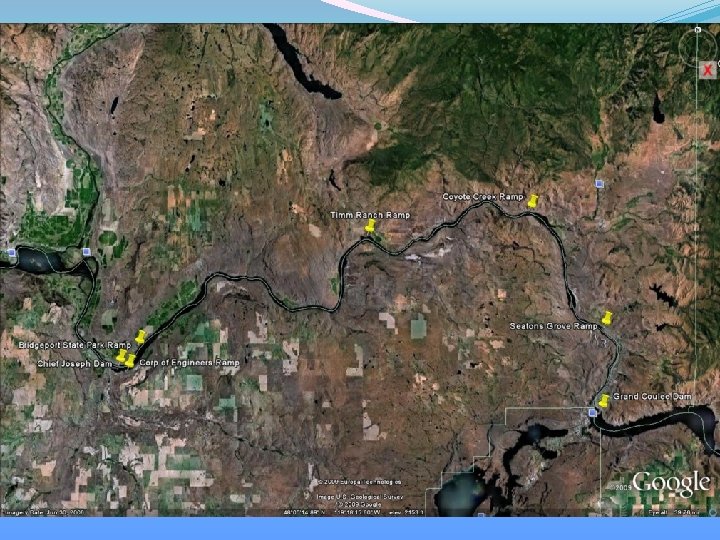
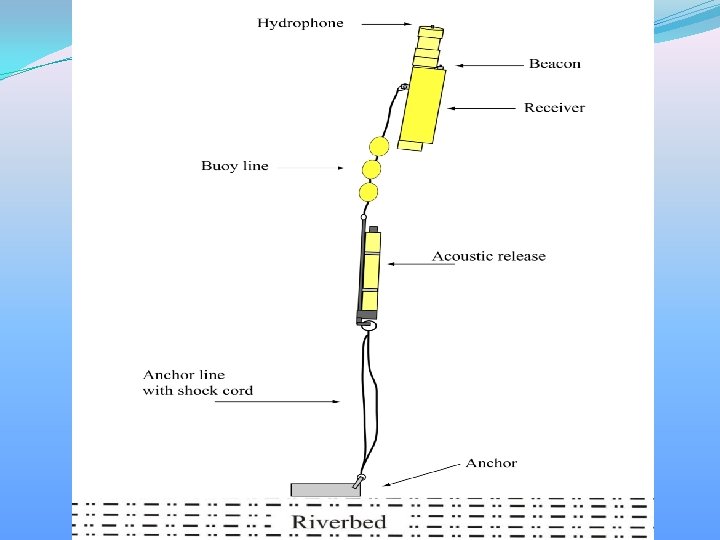
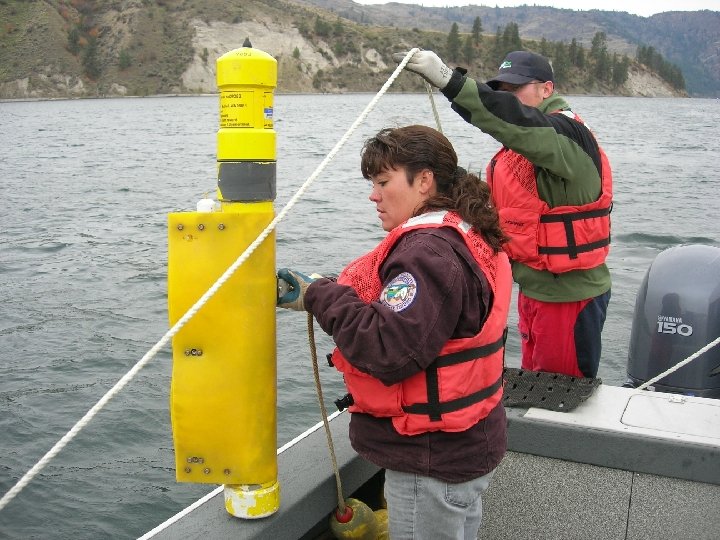
Fish Movements Battelle Study Ø Goals Quantify entrainment Understand fish movement Quantify effects of fish size on movements and entrainment Ø Tools JSATS tags and receivers Fish releases

Lake Rufus Woods and Lake Pateros Receiver Locations

The Future Ø Continue Creel Survey Ø Stock Fish 1 – 3 lbs Ø Use Rufus Woods Net Pen Project to Help Supplement Fish Ø Continue Stomach Sample Analysis Ø Re-evaluate parts of Production Potential Study in “normal” year

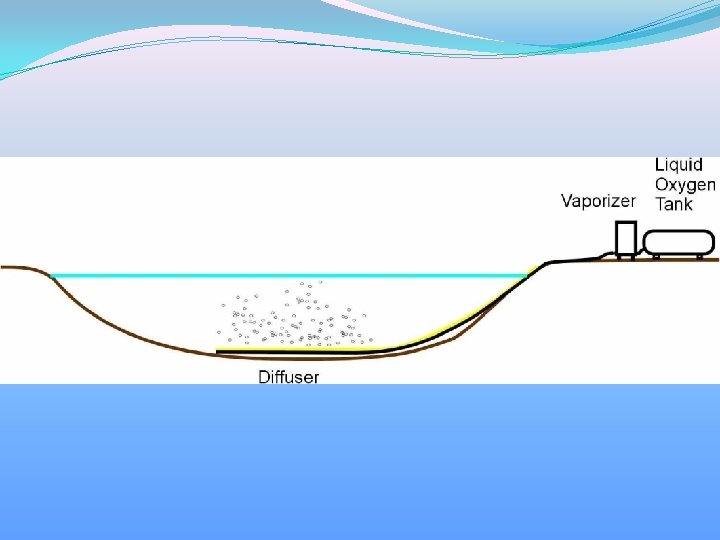
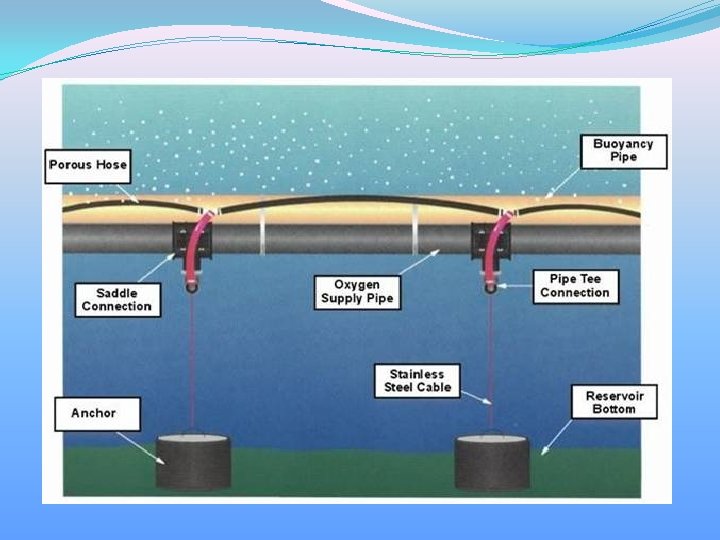
Twin Lakes Oxygenation Project
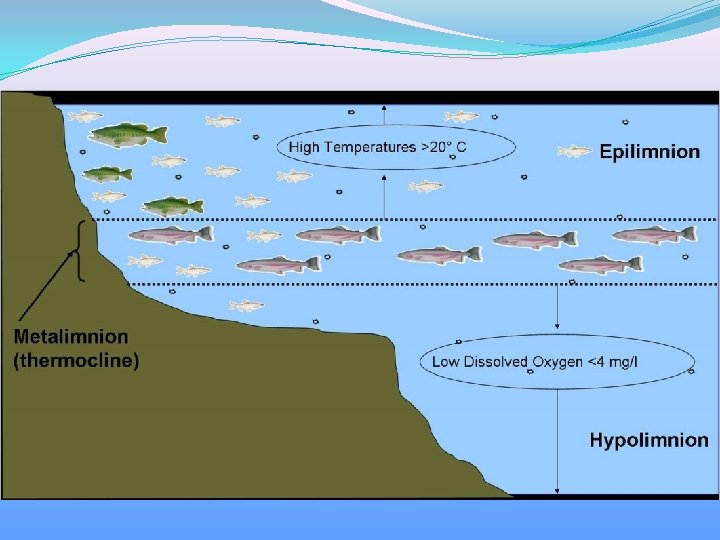

Evaluation Questions to answer 1. 2. 3. 4. 5. Is lake oxygenated? Is hypolimnion utilized by fish? Is summer mortality reduced? Is fish growth increased? What are the other effects of oxygenation? Zooplankton? Heavy metals (particularly methyl mercury)?

Oxygen Levels North Twin South Twin

Hypolimnion Utilization

Gill Net Surveys

Percentage of Angler Caught Carryover Fish 100 90 All carryovers pre redband 100% redband plant 80 % Carryover 70 begin oxygenation 60 50 North Twin 40 South Twin 30 20 10 0 Year 2006 Year 2007 Year 2008 Year 2009 Year 2010 Year 2011

Zooplankton Chaoborus densities # organisms/m 3 25 Pelagic Chaoborus densities 20 15 South Twin 10 North Twin 5 0 April May June July Aug Sept Oct Nov Month Benthic Chaoborus densities 3500 # organisms/m 2 3000 2500 2000 South Twin 1500 North Twin 1000 500 0 April May June July Aug Month Sept Oct Nov
 250 200 150")
Total Mercury in Twin Lakes Fish 300 Total Mercury (ppb) 250 200 150 100 50 0 RBT EBT LMB GDS

The Future Ø Oxygenate South Twin Ø Produce oxygen onsite Ø Evaluate project success

Rufus Woods Net Pen Project Objectives Ø Reduce rearing costs for large fish Ø Reduce pressure on the hatchery Ø Produce large fish for Rufus Woods and reservation lakes

Project is an extension of Colville Hatchery O&M and M&E project Ø Eggs & Fish are reared and marked at hatchery, then transported to net pen site. Ø Hatchery personnel assist with fish distribution from net pens (directly to Rufus Woods or by utilizing fish transport tanks). Ø Colville Hatchery M&E staff monitor success of fish outplants. Ø The Rufus Woods Supplemental Creel project staff assist in providing angler success on the Rufus Woods outplants.

Accomplishments Ø Project successfully released over 37, 000 lbs. of redband rainbow trout into Lake Rufus Woods and Reservation lakes in the spring of 2011. Ø Average fish. Fish Distributed from Net Pens in 2011 size was 430 grams 12, 000 10, 000 7, 614 8, 000 6, 000 11, 248 10, 029 4, 965 Lake Rufus Woods= 13, 329 North Twin Lake= 10, 029 5, 219 4, 000 South Twin Lake= 11, 248 2, 000 0 March April May

Future Considerations Ø Expand Project to be more cost efficient. Ø Utilize a sterile “triploid” stock toward production. Ø Environmental considerations; Spring runoff, Columbia River water temperatures, and bacteria load on fish health. Ø Manage Lake Rufus Woods for a successful fishery?

Questions?

Appendix Hatchery Project Owhi Lake August Gill net Surveys 2004 2010/2011 Ave. wt. Wr 387 101. 6 582 105. 6

Redband vs Spokane Stock Location Hatchery Twin Lakes Category Redband Mortality Feed Conversion Rearing density Fin erosion Spawning season Growth Carry over % Outmigration Physical condition Presence of copepods Genetics Growth Spokane 35% higher as high as 2: : 1 30% less high spring 18 months to 100 grams Lower typically 1: : 1 high moderate fall 12 months to 100 grams >2% >50% poor in spring 10% <10% excellent in spring frequent stream derived stock 153 g to 188 g over summer frequent triploid 183 g to 243 g over summer

0. 1 Month BY 2008 BY 2009 ly Triploid Rainbow Trout Growth Comparison, 2008 Ju M ay Se Jul y pt em b N ov er em be r Ja nu ar y M ar ch M ay 10 ar c BY 2007 h ry BY 2006 M 1000 nu a 100 Weight in (grams) Redband Rainbow Trout Growth Comparison Ja J A ul Se ug y pt us em t O be r N ctob ov e e r D mb ec e em r Ja be n r Fe uar br y ua M ry ar ch Ap ril M ay Ju ne Ju A l Se ug y pt us em t O be r N ctob ov e e r D mb ec e em r be r Weight in (grams) Redband vs Goldendale Growth Comparison BY 2005 BY 2006 BY 2007 1000 10 1 1 0. 1

Appendix Rufus Woods Creel

Monthly Angling Pressure 14000 12000 10000 8000 6000 4000 2000 0 2006/2007 2008/2009/2010 A Se ug pt ust em O ber c N tob ov e em r D ec be em r Ja ber nu Fe ar br y ua r M y ar ch Ap ril M ay Ju ne Ju ly Angler Days Rufus Woods Angling Pressure, 2006/2007, 2008/2009, 2009/2010, 2010/2011 Month 2010/2011

Location of Last Detection 60 All Releases Release 1 Release Chief Joseph Dam 40 30 20 Release 2 Release 3 10 Node Location (rkm) 5 93 3 93 0 93 6 91 5 91 4 90 0 89 8 87 3 87 8 86 3 0 85 Final detection (%) 50

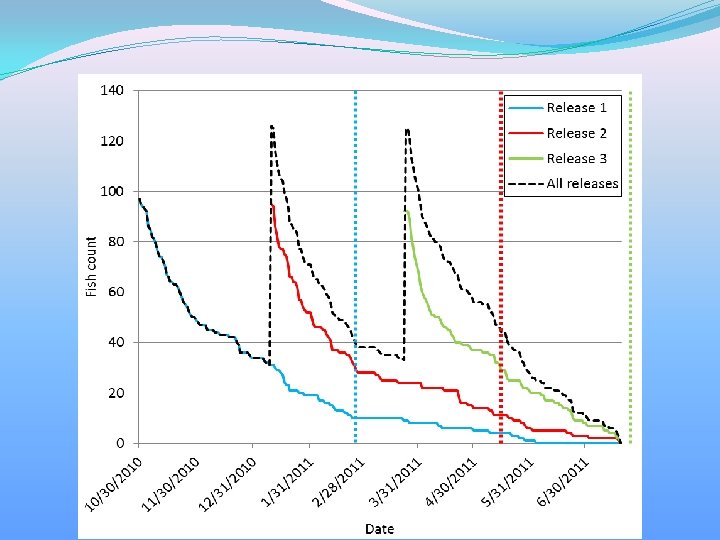
Entrainment Release Date n released n entrained % entrained 1 Nov. 1 99 10 10. 1 2 Jan. 13 100 10 10 3 Mar. 28 94 7 7. 4 293 27 9. 2 All

Appendix Twin Lakes Oxygenation

Twin Lakes Hydroacoustic Passes North Twin South Twin

Hydroacoustic Fish Targets Twin Lakes Hydro Acoustic Surveys, 2010 Targets Lake Strata 6 -Apr 19 -Apr 10 -Jun 28 -Jul 27 -Aug 22 -Sep Total 1 0 15 9 5 0 0 1 30 2 6 4 5 5 19 2 25 66 N. Twin 3 14 4 2 9 7 5 7 48 4 3 0 5 1 1 0 29 39 5 0 0 1 6 3 6 8 24 1 0 21 2 1 0 0 2 26 2 1 9 6 3 12 1 16 48 S. Twin 3 1 0 1 9 4 0 19 34 4 10 4 0 10 1 0 0 25 5 0 0 0 0

Gill Net Catch Rates North Twin Lake Gill Net Catch Rate Net Depth in meters Month 2 -5 m 5 -8 m 8 -11 m April 1. 3 0. 7 0. 0 May 6. 0 3. 7 1. 0 June 2. 0 4. 3 0. 3 July 0. 0 1. 7 0. 3 August 0. 0 7. 0 1. 7 September 1. 3 3. 3 0. 3 October 2. 7 1. 3 0. 0 South Twin Lake Gill Net Catch Rate Net Depth in meters Month 2 -5 m 5 -8 m 8 -11 m April 0. 3 0. 7 0. 0 May 1. 7 2. 7 0. 0 June 0. 3 3. 3 0. 3 July 0. 0 1. 0 0. 0 August 0. 0 1. 0 0. 3 September 0. 0 October 1. 3 0. 0
 70 60 50")
Total Mercury in Twin Lakes Trout 90 80 Total Mercury (ppb) 70 60 50 40 30 20 10 0 Hatchery North Twin Rainbow Trout Brook Trout South Twin
 160 140 120 100")
Mercury in large body zooplankton 200 180 Total Mercury (ppb) 160 140 120 100 80 60 40 20 0 June July North Twin August South Twin September

Mercury levels in Twin Lakes Trout Rainbow trout Brook trout
- Slides: 63