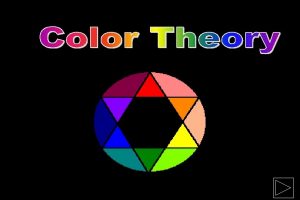
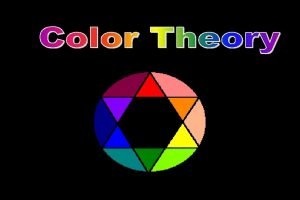
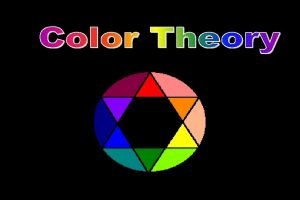
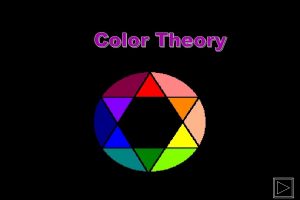
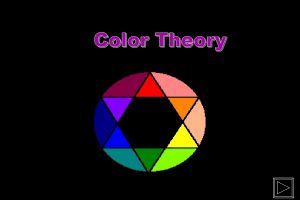
Color n To understand color we must understand


- Slides: 82

Color n To understand color, we must understand light 1

380 nm 450 nm 490 nm 560 nm 590 nm 630 nm 780 nm Light n n An electromagnetic phenomenon, like television waves, infrared radiation, and xrays Color involves those waves that lie in a narrow band of wavelengths in the “visible spectrum” 2

Light Photons n • • all light is comprised of photons properties: velocity, wavelength, frequency, polarization wavelength = velocity / frequency • interact with matter : transmitted, reflected, absorbed Spectral Distribution n • • # of photons at each frequency/wavelength visible spectrum 3

How would you convert? How do you convert from rgb to wavelength? n How do you convert from wavelength to RGB? n 380 nm 450 nm 490 nm 560 nm 590 nm 630 nm 780 nm 4

What Is color? -perception n A source of light, an object, and the eye - brain interaction… 5

How do we see color? RGB TRI-STIMULUS Experiments were done to observe and measure what people see. TEST LAMP n OBSERVER 6

Radiometry - How does light propagate in the real world? pure light spectral distribution white light 700 nm 400 nm 7

Life and Death of a Photon n Emission n Reflection n Absorption 8

Pure Spectral light Orange 600 Red 500 Yellow 400 Green Spectral Density (power per unit wavelength) Blue n The eye responds to light with wavelengths between approximately 400 and 700 nm Some spectral densities for pure spectral light, and how we perceive them: Violet n 700 wavelength 9

Lighting is a Global Problem n That is, if you consider any point in the environment, it receives light from all around 10

Surfaces are Rarely Mirrors n Specular surface n Diffuse Surface 11

Some Simplifying Assumptions n Wavelength independence • No fluorescence n Time invariance • No phosphorescence n Light transport in a vacuum • No participating media n Objects are isotropic • Reflectance characteristics are constant over the surface 12

color Response Cones n n n A = “Red” B = “Green” C = “Blue” 13

RGB Color Model RED (1, 0, 0) MAGENTA (1, 0, 1) WHITE YELLOW (1, 1, 0) BLACK GREEN (0, 1, 0) BLUE (0, 0, 1) CYAN (0, 1, 1) 14

The RGB Model n n n An Additive color model based on the primitives Red Green and Blue Most Commonly used in Computer Graphics Approximates human visual response fairly well 15

RGB Color Space This is a vector space with the RGB basis vectors defined by the properties of the monitor phosphors. 16

Device Dependency n n n Unfortunately the choice of red, green and blue and be quite different in different implementations. If the phosphors colors are slightly different the vector space is different so we cannot use RGB to universally define a unique color. We require a device independent color space. RGB Space 2 RGB Space 1 17

Color & Vision CIE 1931 Model n n The CIE 1931 model is the most commonly used It defines three primary “colors” X, Y and Z that can be used to describe all visible colors, as well as a standard white, called C. The range of colors that can be described by combinations of other colors is called a color gamut. Since it is impossible to find three colors with a gamut containing all visible colors, the CIE’s three primary colors are imaginary. They cannot be seen, but they can be used to define other visible colors. 18

Color & Vision 2 CIE 1931 Model n n n To define a color in CIE model, provide weights for the X, Y and Z primaries, just as you would for an RGB display (e. g. C = x. X + y. Y + z. Z) X, Y and Z form a three dimensional color volume We can ignore the dimension of luminance by normalizing with total light intensity, X+Y+Z = 1. This gives chromaticity values: x = X/X+Y+Z y = Y/X+Y+Z z=1 -x-y 19

Color & Vision CIE 1931 Model n Plotting x and y gives the CIE chromaticity diagram • Color gamuts are found by taking the convex hull of the primary colors • Complements are found by inscribing a line from the color through C to the edge of the diagram 0. 8 y 520 green 500 cyan 0 0 yellow 600 C red 700 blue purple 400 x 0. 7 20

21

Color & Vision CIE 1931 Model 22

CIE Standard Specification n Y primary describes the luminance component Amount of primaries to match a color is (x, y, z), given by For a CRT k is 680 lumens per watt. 23

CIE Chromaticity Diagram n n n A cone shaped volume that contains all the visible colors could be built in the XYZ space If (x, y, z) are the weights Y to match a color C, then C = x. X + y. Y + z. Z (x + y + z) as X Z 24

CIE Chromaticity Diagram n If we specify xc and yc, then zc can be calculated as (1 - xc - yc). In addition if y (luminance) is specified than x and z could be calculated. So given (xc, y) the transformation corresponding to (x, y, z) is given as 25

C 26

Uses of CIE Chromaticity Diagram n n When three primary colors are used, then all the colors in the triangle formed by the three primaries could be produced This helps in comparing color gamuts, i. e. collection of colors yc xc 27

Color Models n n n Color model is a geometric representation of the space of all colors such that any color is a point in that space Traditionally color models for computer graphics were designed for specific devices They could be classified based on • Hardware color generation i. e. RGB for displays, CMY for printers, YIQ for television transmission • Color perception i. e. HSV for interactive color specification. 28

RGB Color Model n n Standard Model for color monitor Primaries are Red, Green and Blue Represents only a subset of perceivable colors Known as Additive Model, because individual contributions color Applet (http: //mc 2. cchem. berkeley. edu/Java/RGB/example 1. html) of each primary are added 29

CMY Color Model n n n Standard for ink-jet and xerographic printers Primaries are Cyan, Magenta and Yellow Known as Subtractive Model, Printer color gamut is smaller than CRT color gamut C = 1 -R, M = 1 -G and Y = 1 -B 30

YIQ Color Model n n n Used in commercial TV broadcasting Primaries are Y (luminance) and I, Q which are the chrominance components Y is same as the y primary of CIE standard Designed for transmission efficiency and compatibility with black and white television Exploits two properties of human visual system • high sensitivity to change in luminance than to color variations • Objects small in the field of view produce limited color sensation 31

HSV Color Model n n Useful in user interface design for color specification Primaries are Hue, Cyan Saturation and Value (luminance) Considered as direct geometric representation of perception of color Based on cylindrical coordinate system V 1200 Green Yellow Red 00 1. 0 Blue 2400 Magenta 0. 0 Black H S 32

RGB Color Space Blue Cyan Magenta Black White Red Green Yellow 33

CIE Standard n n Standard developed by Commission Internationale de L'Eclairage (1931): a way of defining any color based on the r + g + b = 1 plane. Based on three primaries which are able to produce ALL visible colours. CIE chromaticity diagram is the view you would get looking at the plane x + y + z = 1, straight down the blue axis Provides a standard reference for comparing other color systems 34

CIE Chromticity Diagram n n Less natural than RGB However standard is useful for converting between color spaces of different devices 35

CMY color n n Subtractive scheme based on primitives: Cyan, Magenta and Yellow Commonly used in color print production 36

Subtractive Colors n Subtractive color mixing results from selective absorption of light wavelengths Layers of CMY ink subtract inverse percentages from the reflected light so that we see a particular color. 37

CMYK n n n 'black' generated by mixing the subtractive primaries is not as dense as that of a genuine black ink (one that absorbs throughout the visible spectrum), four-color printing uses black in addition to the subtractive primaries C=cyan, M=magenta, Y=yellow, K=key (black) 38

Color Space Conversions RGB to CMY and CMY to RGB: CMYK to CMY: 39

color Matching How much R, G, B do you need to make a particular “pure” color? 40

The Eye The Biological Camera n n Lens, cornea and fluids focus light. Six eye muscles orient the eye Iris adjusts light Retina captures images 41

Physiology of Eye Response n 6 million cones in the fovea • cones sense red green or blue light • color perception region is very small n 120 million rods over the whole eye • peripheral vision • motion sensitive 42

Photometry - How do we see light? 43

Evolution’s camera 44

Spatial distribution (crosssection) 45

Rods versus cones n Rods are more tolerant in terms of handling low light conditions • You don’t see color when it’s night n Cones give you better spatial acuity 46

Cones come in three flavors Blue Green Red 47

Visual Cortex: Tristimulus Reality? n Types of Cones: • Low: 560 nm • Medium: 530 nm • High: 420 nm n Signal to brain: • L-M • H - (L+M) • L+M luminance n red ? green ? blue ? ® ® ® red - green blue - yellow red + green » overall Red/Green color blindness means no signal L – M signal. 48

How many colors can we see? n Humans can discriminate about • 200 hues • 20 saturation values • 500 brightness steps n n The NBS (National Broadcasting Society) lists 267 color names What about across languages? • Seem to be about 11 basic ones – white, black, red, green, yellow, blue, brown, purple, pink, orange, gray 49

Cones n Types • “red”, “green”, “blue” 50

Color Cone n Hue, Saturation, Lightness/Value 51

RGB Color Cube 52

Inferences - Color Matching Experiment 0. 4 The negative 0. 2 values for the red matching function around 500 nm 0 indicate that these colors cannot be -0. 2 produced by adding the primaries. trisimulus value n negative values 400 500 600 700 53

Inferences - Color Matching Experiment n Tristimulus vales are given by n The color matching in the experiment is perceptual matching. The spectrum resulting from adding the three primaries need not match with the spectrum of the test light. Lights which are perceptually same but have different spectral distribution curves are called metamers n n 54

Color Quantization 55

Image Quantization Image quantization: discretize continuous pixel values into discrete numbers Color resolution/ color depth/ levels: - No. of colors or gray levels or - No. of bits representing each pixel value - No. of colors or gray levels Nc is given by where b = no. of bits 56

Image Quantization : Quantization function Quantization level Nc-1 Nc-2 2 1 0 Light intensity Darkest Brightest 57

Effect of Quantization Levels 256 levels 128 levels 64 levels 32 levels 58

Effect of Quantization Levels (cont. ) 16 levels 8 levels 4 levels 2 levels In this image, it is easy to see false contour. 59

Introduction • Some display hardware stores 8 bits per pixel => it can display at most 256 distinct colors at a time • To display a full-color image, the computer must choose an appropriate set of representative colors and map the image into these colors This process is called 60

Quantization phases • Sample the original image for color statistics • Select color map based on those statistics • Map the colors to their representative in the color map Redraw the image, quantizing each pixel • Algorithm Mapping… 61

The Median Cut Algorithm • The concept – to use each of the colors in the colormap to represent an equal number of pixels in the original image • The algorithm repeatedly subdivides color space into smaller and smaller rectangular boxes 62

The Median Cut Algorithm (cont) G • Begin with one box which tightly encloses the colors of all image pixels • Repeat for every newly created box: (a) sort enclosed points along the longest dimension of the box (b) segregate points into two halves at the median point R • Until the desired number of boxes is generated B • Compute representative for each box by averaging the colors contained in each 63

The Median Cut Algorithm samples 2 colors 4 colors 16 colors 256 colors 64

The Popularity Algorithm frequency • Run a histgoram on the entire picture to determine “pixel counts” for each color • Pick the colors with the highest pixel count colors 65

The Popularity Algorithm samples 2 colors 4 colors 16 colors 256 colors 66

The Original Diversity Algorithm • Run a histogram on the entire picture • Pick the color with the highest pixel count • Repeat (a) find the color in the unpicked list that is furthest from all of the colors in the picked list (b) pick this color • Until all colors have been picked 67

Algorithm – samples 2 colors 16 colors 4 colors 256 colors 68

The Modified Diversity Algorithm • Run a histogram on the entire picture • The 1 st color: the most popular • The 2 nd color: the furthest away from the first color • The 3 rd through 10 th colors: are picked using the normal Diversity Algorithm • Repeat (a) pick a color on popularity (b) pick a color on diversity • Until all the colors have been picked 69

The Modified Diversity Algorithm - samples 2 colors 4 colors 16 colors 256 colors 70

Sequential Scalar Quantization G • Quantize R component to some • predetermined number of levels N 1 according to its marginal distribution Quantize G within each B 2 j to n 2 j levels according to its conditional distribution (this results in a set of N 2 columnar regions B 3 j) • Quantize B within each B 3 j (this B 31 x x x B 32 B 21 x x x B 22 x B 3 N 2 B 2 N 1 R results in the desired N 3 = N quantization regions) • Pick the centroid of each of the N regions as the representative for that region 71

Sequential Scalar Quantization - samples 2 colors 4 colors 16 colors 256 colors 72

Generalized Lloyd Algorithm • Consists on a number of iterations, each one recomputing the set of more appropriate partitions of the input vectors and their centroids 73

Generalized Lloyd Algorithm (cont) representatives • • Begin with an initial data c 00 c 10 Repeat (a) redistribute each input vector into one of the clusters defined by their centroids image colors c 20 c 30 (b) recompute the centroids for each cluster just created (c) compute the average distortion for the new centroid set • Until the distortion has only changed by a small enough amount since the last iteration c 01 c 11 c 21 c 31 74

Generalized Lloyd Algorithm samples original Diversity 4 colors Diversity + GLA Popularity 16 colors Popularity + GLA 75

Peak signal to noise ratio (PSNR) PSNR(3 D case) 10*log 10( M, N = Max(original image)2*3*M*N Σ iΣ jΣ k noise(i, j, k)2 ) – picture dimensions noise(i, j, k) – distance between an original color of a pixel (located at (i, j, k)) and its color after quantization 76

Summary 2 color quantization PSNR 13. 752 13. 569 13. 745 8. 768 MC MC P D DM SSQ – P Median Cut Popularity Diversity (Modified) Sequential Scalar Quantization D 13. 752 9. 908 DM 14. 537 13. 752 SSQ Algorithm - GLA applying - no GLA applying 77

Summary (cont) 4 color quantization PSNR 18. 225 17. 085 18. 263 18. 216 12. 137 MC P D DM SSQ – P Median Cut Popularity Diversity (Modified) Sequential Scalar Quantization D 17. 197 11. 231 10. 875 MC 19. 053 18. 263 DM SSQ Algorithm - GLA applying - no GLA applying 78

Summary (cont) 16 color quantization PSNR 25. 856 23. 826 23. 056 22. 157 24. 648 22. 259 23. 214 17. 968 16. 606 13. 437 MC MC P D DM SSQ – P Median Cut Popularity Diversity (Modified) Sequential Scalar Quantization D DM SSQ Algorithm - GLA applying - no GLA applying 79

Summary (cont) 32. 697 31. 187 PSNR 34. 042 33. 397 31. 606 30. 333 28. 735 27. 122 25. 856 18. 747 256 color quantization MC MC P D DM SSQ – P Median Cut Popularity Diversity (Modified) Sequential Scalar Quantization D DM SSQ Algorithm - GLA applying - no GLA applying 80

CR 311 HW n Mult-color edge detector: • Input a color image, img, and color quanitzation algorithm, imgk = Q(img, k) • Create img 4, img 8 and img 16 with 4 8 and 16 colors • Edge detect img[] with an isotropic edge detector • Create img. Sum = img 4+img 8+img 16 • Normalize imgsum and threshold, with an adjustment. 81

New HW for CR 311 n Implement color quantization algorithms in the ip package using the MDI interface. • • • Linear cut Median cut Wu Octree and Nu. Quant print. Number of Colors 82
 To understand recursion you must understand recursion
 We must first seek to understand
 He must become greater; i must become less
 Make me understand
 Make me understand
 Kristina doubet
 Identify each number as rational or irrational
 Make me understand
 Micro skill
 Signing something you don t understand
 Can we understand god
 Objectives of teaching rhymes
 Www.understand quran and salah
 Lesson 3 understand rational and irrational numbers
 Understand apply analyze evaluate create
 Understandquran.com
 Quran lesson 1
 Je, tu, il/elle nous, vous, ils/elles endings
 Aulaclty
 Make me understand
 The ideal self the perfect self explanation
 Essw3
Essw3 Total potential energy
 6151 san luis gonzaga
 Critical reader definition
 Responsibilities to the individuals you support
 Text features photographs
 I will understand
 How to understand bce and ce
 God understands your pain
 Understand 2-7
 How to understand graphs and charts
 Explain the mechanics of public issue management
 Understand 3 формы
 Understand algebraic expressions iready
 I just kept on smiling
 Lesson 6 understand decimal place value answer key
 Meaning of rule of law
 What do you understand
 Abcye
Abcye Understand past tense
 Www.understandquran.com in english
 Understand quran
 People as media and people in media difference
 Examples of affective domain objectives in mathematics
 Synonym understand
 It makes me understand
 Understand fully
 Seek first to understand then to be understood examples
 How can paleontologists help us understand the past
 Understand strategy
 Kud teaching
 Which plural
 Learn quran and salah the easy way
 We understand you
 Www.understandquran.com
 Aim to understand
 Understand rational and irrational numbers lesson 3
 Factoring is an important process
 Let's understand
 What is self centered listening
 Scale drawings/models & scale factor
 L understand that
 N factorial
 L understand that
 Understand quran and salah the easy way
 Unit 650 understand professional management
 How to understand and apply the old testament
 5 poor listening styles
 Habit 5
 Impossible to understand
 Make me understand
 And understand
 O understand
 Seek first to understand, then to be understood activities
 Younger brother
 What is a comparative adjective
 What do you mean by statistical enquiry
 Understand quran and salah the easy way
 Any fool can write code that a computer can understand
 Understand quran and salah
 History helps us understand people and societies.
 Narrative report with contextual description


