COLEMAN ELEMENTARY SCHOOL UPCOMING SCHOOL YEAR BUDGETING EDUC

COLEMAN ELEMENTARY SCHOOL UPCOMING SCHOOL YEAR BUDGETING EDUC 5139 School Finance & Campus Budgeting Fall 2014 By Baky Saparov , Ismail Ardahanli, Riza Gurlek

Outline • • Descriptive Narrative Mission Statement Student Enrollment Projections Needs Assessment and Priority Analysis of the Campus Improvement Plan Budgeting Conclusion

Descriptive Narrative • Coleman serves a diverse population group of 502 students. Demographic Distribution • Our campus currently is comprised of a population of v v • • 64% Hispanic, 33% African American, 0% White. Other 3 % Economically Disadvantaged population is 65% (321 students). Bilingual Learner population is 17% (85 students), Special Education population is 8% (40 Students) Gifted and Talented population is 6. 3% (32 students) Hispanic African-American White Others

Descriptive Narrative Coleman Elementary Faculty and Staff • • • 1 Principal 2 Assistant Principal 45 teachers 1 Counselor 1 Nurse 1 Social Worker • • • 1 Librarian 7 Instructional aides 1 Diagnostician 1 Secretary 1 Attendance clerk 5 Custodians

Sections and Grade Levels • • Kindergarten: 3 sections, Grade 1: 4 sections, Grade 2: 4 sections, Grade 3: 4 sections, Grade 4: 4 sections and Grade 5: 4 sections. Each section has around 22 -23 students. Every grade level has on section of bilingual students, one section of special education inclusion-monolingual students with the remaining sections serving monolingual students. • Bilingual students at every grade level are served by teachers and instructional aides. • Special education students are served by teachers and instructional aides.

Mission Statement • At Coleman Elementary School, students should be accepted, appreciated, nurtured, and challenged according to their individual needs. Through their education at school, students should gain the skills, strategies, and desire necessary for continued learning. They should also develop a strong sense of responsibility for themselves and toward each other, their community, and the earth's resources. To this end, faculty and staff should create a rich multicultural environment for learning; design an integrated curriculum with strong science, fine arts, and social studies components; provide for children to become self-directed learners; and share their enthusiasm for learning, in an atmosphere of mutual respect and appreciation.

Student Enrollment Projections Enrollment Numbers ENROLLMENT by YEAR • We project to have 520 students for 2014 -15 academic year. 430 Enrollment Numbers 380 15 520 20 14 - 2014 -15 14 502 20 13 - 2013 -14 480 13 500 20 12 - 2012 -13 530 12 439 20 11 - 2011 -12

Needs Assessment and Priority Analysis Performance Data By Year 97 97 77 83 60 82 84 78 50 85 76 84 79 85 84 2013 -2014 90 2012 -2013 80 85 2011 -2012 83 2010 -2011 80 81 22 84 77 2013 -2014 All 84 87 84 78 African American 78 84 78 75 Hispanic 90 89 89 83 White NA NA Econ Disad 86 86 82 79 Special Ed 67 78 67 71 Male 78 84 87 79 Female 90 89 81 80 77 83 74 82 84 84 85 86 NA NA 2012 -2013 Science 2011 -2012 Writing 2010 -2011 Math 2013 -2014 2012 -2013 2011 -2012 2010 -2011 Reading 66 79 79 83 84 96 93 76 96 97 99 79 NA NA 59 68 80 77 74 93 78 87 NA NA 88 97 96 NA NA NA 86 94 93 96 99 99 60 77 80 NA NA NA 72 74 93 61 83 67 75 17 70 84 82 75 91 76

Needs Assessment and Priority Analysis Strength • • Weakness Math and Science scores are well ; good to go with implemented strategies Fact • There is a need to close achievement gap of students about Reading and Writing • Reading and Writing scores are low, strategies should be changed Solution Arranging workshops or sending teachers PDs and getting service from mentors to establish the knowledge they learned during PDs

Needs Assessment and Priority Analysis Strength Weakness • Math score is good for African. American sub group • However Reading, Writing , and Science are in decreasing tendency Fact Solution • Strategies used for • Collaborating with African-American master educators Background experienced by students are not this subgroup to effective in overall establish effective strategies.

Needs Assessment and Priority Analysis Strength • • Math strategies work well Science strategy applied changed negativity to positivity Weakness • • Fact • Hispanic Background • students struggles from Language based classes such as Reading and Writing • Reading continuously goes down Writing has a tremendous decrease last year instead of previous two years Solution ESL trainings should be arranged for teachers in order for students to comprehend these classes better. Arranging interventions.

Needs Assessment and Priority Analysis Strength • • • Weakness Math Scores have • been fluctuating , but it finished increasingly last year • Science has been going up for three years Fact Reading has been going down for three years Writing score went down significantly last year Solution • Arranging interventions for those type of students Following their improvement track to fill out their achievement gaps by using specific software According to researches most of the Economically Disadvantages students` parents take care of their kids` classes less than enough. •

Needs Assessment and Priority Analysis Strength Weakness • All tested subjects • There is no are in increasing decreasing subject tendency area belonging to last year Fact Solution • Applied strategies • Keep going with worked well last those methods. year for all subject areas.

Needs Assessment and Priority Analysis Strength • Just Math looks good for males Fact • Less attention paid to Reading, Writing and Science Weakness • Reading , Writhing and Science scores are low Solution • Lesson preparations should be planned according to engage male students.

Needs Assessment and Priority Analysis Strength • Math and Science scores increase Fact • Reading and Writing Classes could not engage students Weakness • Reading and Writing fell down Solution • These classes` instruction content should be enriched to engage female students more.

Needs Assessment and Priority Analysis Need to spend more money to make weaknesses to strengths Actions • Professional • Sending teachers PDs development based on and getting service campus needs(writing, from mentors to small group establish the instruction, closing the knowledge they achievement gap for learned during PDs minority children)

Needs Assessment and Priority Analysis Need to spend more money to make weaknesses to strengths • Curriculum and instructional alignment Actions • Purchasing new aligned instructional materials and adopting those

Needs Assessment and Priority Analysis Need to spend more money to make weaknesses to strengths Data Analysis and Instructional Planning Actions • Training teachers how to analyze data and according to data how to plan instruction by mentors.

Needs Assessment and Priority Analysis • Need to spend more money to make weaknesses to strengths Actions Leadership Capacity(including collaboration & strategic planning) • Arranging workshops to increase leadership capacity of staff

Needs Assessment and Priority Analysis Need to spend more money to make weaknesses to strengths • Close the • achievement gap for all students and subgroups in reading, writing, math, and science as measured on the STAAR and local • assessment. Actions Hiring or finding intervention teacher to do push-in or small group instruction for the students they have background gaps. Using software to fill out the achievement gap

Needs Assessment and Priority Analysis Need to spend more money to make weaknesses to strengths CSCOPE Training and implementation for 4 year. Actions • Training the teachers to implement CSCOPE in the school and follow the track with mentor teachers.

Needs Assessment and Priority Analysis • No need to spend a lot of money for strengths part: • TAKS math scores • Student attendance • Facilities • Community engagement • Use of technology

Analysis of the Campus Improvement Plan • Goal 1 • Increasing student scores in writing 10 %, reading 5 %, math 5 % and science 5 %. • Strategies • Increasing teacher capacity by offering staff development opportunities designed to address specific campus needs • Utilize district curriculum department resources to improve student performance • Create campus climate and culture as Professional Learning Community

Analysis of the Campus Improvement Plan Goal 2 Strategies • Increasing technology • Decreasing number of students competency for teachers and students by 10 % utilizing STAR results. needing reading and mathematics intervention services • Create a renewed focus on technology TEKS in all content areas • Provide research-based instructional technology software programs and appropriate hardware applications

Analysis of the Campus Improvement Plan • Goal 3 • Increasing Parental Involvement and community participation in academic activities by 10% • Strategies • Inform parents and community through newsletters, district and campus website, TISD TV , newspaper , Alert Now, marquee • Provide opportunities for parent and community participation in the educational process • Establish a formal school/business partnership

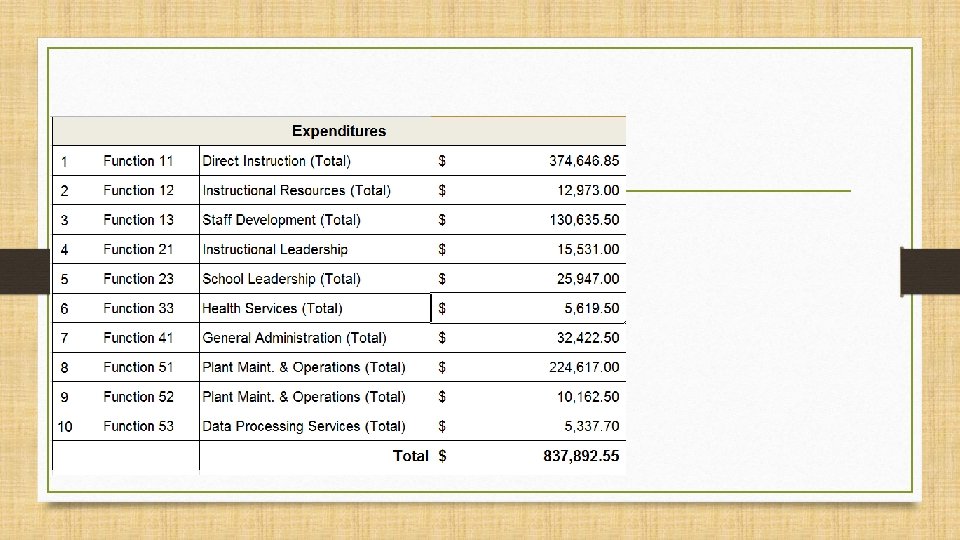
Analysis of the Campus Improvement Plan • According to Goal 1, 2 & 3 in CIP , total expenditure is $69000.

Allocation of Statement Allocation Statement Student Population Average Daily Attendance ADA Funding Special Education (8%) Gifted and Talented (6. 3%) Bilingual/ESL (17%) Title I (65%) State Compensatory Property Tax Revenue (40 %) Total Allocation 520 97. 20% 505. 4 41. 6 35 88. 4 338 653 x x x $2, 537. 00 $1, 282, 199. 80 $7, 125. 00 $296, 400. 00 $285. 00 $9, 975. 00 $237. 50 $20, 995. 00 $262. 50 $88, 725. 00 $475. 00 $310, 175. 00 $1, 812, 267. 65 $3, 820, 568. 45 47. 4 33. 5 % Ada Federal State Local Tax 10. 8 % 8. 1 %

Budgeted Expenditure Information 4. 9 17 Instruction Administration payroll 77 % Other
 Campus Eligibility School’s free-reduced ratio is the criteria An LEA may")
Title I: (65%) Campus Eligibility School’s free-reduced ratio is the criteria An LEA may designate as eligible: any campus with at least 35 percent poverty as ‘targeted assistance’. any campus with at least 40 percent poverty as ‘school-wide program’. Title I revenue: 338 * 262. 50 = $ 88, 725 Title II: No 35%-40% poverty requirement Title II revenue: 520 * 0. 87= $ 452. 4 IDEA-B, Special Education Fund Allocated based on population (65%) and poverty (15%) per prior year PEIMS data. Texas Education Agency provides $87 per qualified ( Free and Reduced) Student for IDEA-B grant # of Free & Reduced Students: 338 * 0. 87= 294. 06 IDEA B Revenue: 41*7, 125 = $292, 125 Federal Funds Title III IDEA-B)

Position Payroll Total Principal Propose 1 Salaries Total $ 100, 000. 00 Assistant Principal 1 $ 75, 000. 00 Teachers 45 $ 48, 000. 00 $ 2, 160, 000. 00 Counselor 1 $ 50, 000. 00 Librarian 1 $ 48, 000. 00 Social Worker 1 $ 40, 000. 00 Secretary 1 $ 35, 000. 00 Nurse 1 $ 48, 000. 00 Diagnostician 1 $ 50, 000. 00 Attendance Clerk 1 $ 28, 000. 00 Custodians 4 $ 40, 000. 00 $ 160, 000. 00 Teacher Aids 7 $ 25, 000. 00 $ 175, 000. 00 Grant Total: $ 2, 969, 000. 00

Teachers' Position Number of Teachers & Distribution Kindergarten Teacher 3 Kindergarten Aide 3 Science Teacher 4 1 st Grade teacher 4 Math Teacher 4 2 nd Grade Teacher 4 Social Studies 4 Career and Technology Teacher 2 ELA Teacher 4 GT Teacher 1 Music Teacher 1 Computer Science Teacher 2 PE Teacher 2 Intervention Teacher 1 LOTE 2 Teacher Aide 3 ESL Teacher 3 Art Teacher 1 Special Ed. Teacher 2 Character Education Teacher 1 SPED Aide 1 Total Number of Teachers 45 Total Number of Teacher Aides 7

SALARY DISTRIBUTION TABLE

Budgetary Reductions 1 -Instead of 5, there will be 4 custodians 2 -Travels for conferences 3 -Position change : one of the character education teachers will be used as intervention teacher for reading.

Questions

Thank You…
- Slides: 38