CODE TUNING AND OPTIMIZATION Kadin Tseng Boston University

CODE TUNING AND OPTIMIZATION Kadin Tseng Boston University Scientific Computing and Visualization
Code Tuning and Optimization Outline • Introduction • Timing • Example Code • Profiling • Cache • Tuning • Parallel Performance 2
Code Tuning and Optimization Introduction • Timing • Where is most time being used? • Tuning • How to speed it up • Often as much art as science • Parallel Performance • How to assess how well parallelization is working 3
Code Tuning and Optimization Timing 4
Code Tuning and Optimization Timing • When tuning/parallelizing a code, need to assess effectiveness of your efforts • Can time whole code and/or specific sections • Some types of timers • unix time command • function/subroutine calls • profiler 5
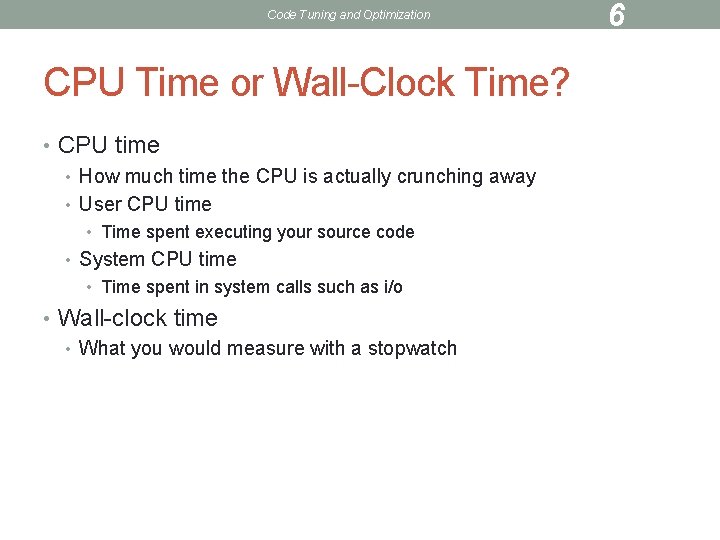
Code Tuning and Optimization CPU Time or Wall-Clock Time? • CPU time • How much time the CPU is actually crunching away • User CPU time • Time spent executing your source code • System CPU time • Time spent in system calls such as i/o • Wall-clock time • What you would measure with a stopwatch 6
Code Tuning and Optimization 7 CPU Time or Wall-Clock Time? (cont’d) • Both are useful • For serial runs without interaction from keyboard, CPU and wall-clock times are usually close • If you prompt for keyboard input, wall-clock time will accumulate if you get a cup of coffee, but CPU time will not
Code Tuning and Optimization 8 CPU Time or Wall-Clock Time? (3) • Parallel runs • Want wall-clock time, since CPU time will be about the same or even increase as number of procs. is increased • Wall-clock time may not be accurate if sharing processors • Wall-clock timings should always be performed in batch mode
Code Tuning and Optimization 9 Unix Time Command • easiest way to time code • simply type time before your run command • output differs between c-type shells (cshell, tcshell) and Bourne-type shells (bsh, bash, ksh)
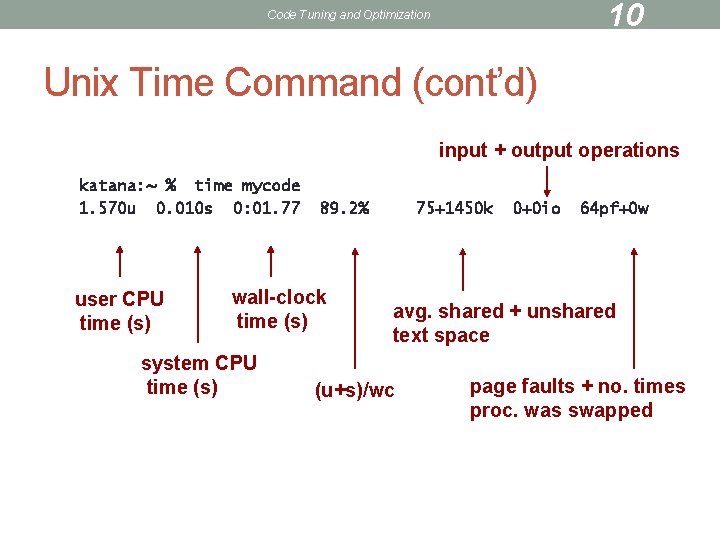
10 Code Tuning and Optimization Unix Time Command (cont’d) input + output operations katana: ~ % time mycode 1. 570 u 0. 010 s 0: 01. 77 user CPU time (s) 89. 2% wall-clock time (s) system CPU time (s) 75+1450 k 0+0 io 64 pf+0 w avg. shared + unshared text space (u+s)/wc page faults + no. times proc. was swapped
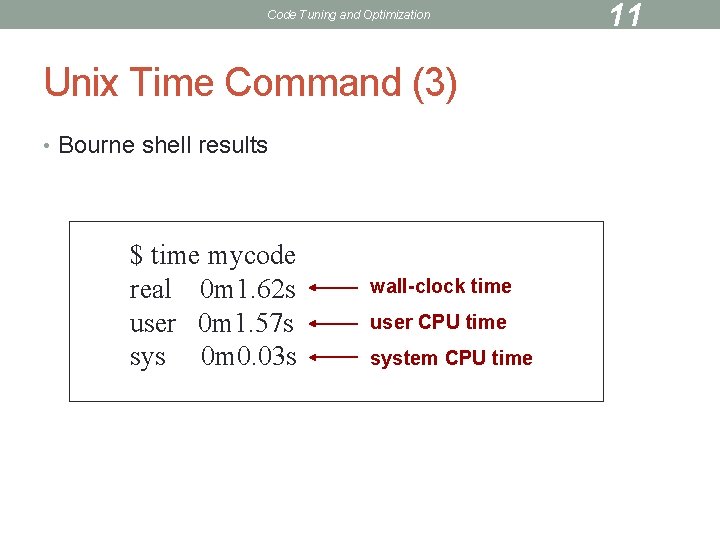
Code Tuning and Optimization Unix Time Command (3) • Bourne shell results $ time mycode real 0 m 1. 62 s user 0 m 1. 57 s sys 0 m 0. 03 s wall-clock time user CPU time system CPU time 11
Code Tuning and Optimization Example Code 12
Code Tuning and Optimization 13 Example Code • Simulation of response of eye to stimuli (CNS Dept. ) • Based on Grossberg & Todorovic paper • Contains 6 levels of response • Our code only contains levels 1 through 5 • Level 6 takes a long time to compute, and would skew our timings!
Code Tuning and Optimization 14 Example Code (cont’d) • All calculations done on a square array • Array size and other constants are defined in gt. h (C) or in the “mods” module at the top of the code (Fortran)
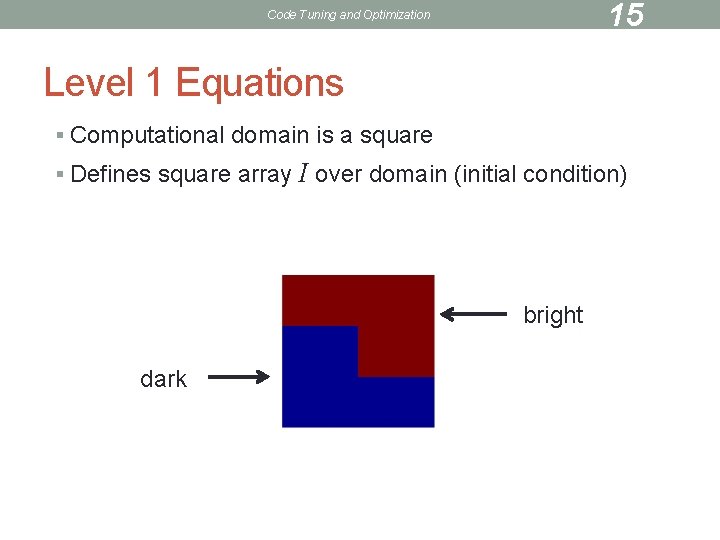
15 Code Tuning and Optimization Level 1 Equations § Computational domain is a square § Defines square array I over domain (initial condition) bright dark
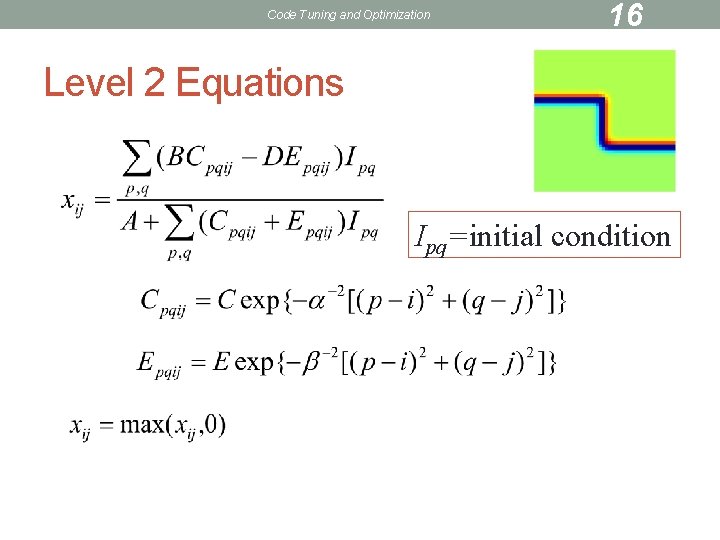
Code Tuning and Optimization 16 Level 2 Equations Ipq=initial condition
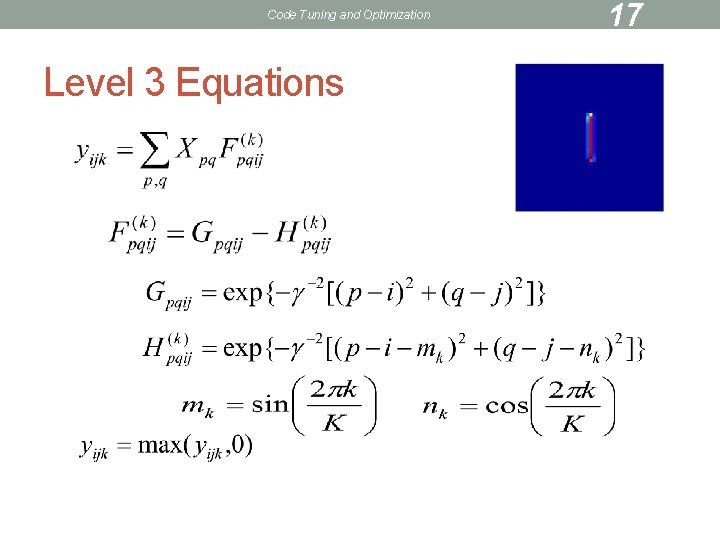
Code Tuning and Optimization Level 3 Equations 17
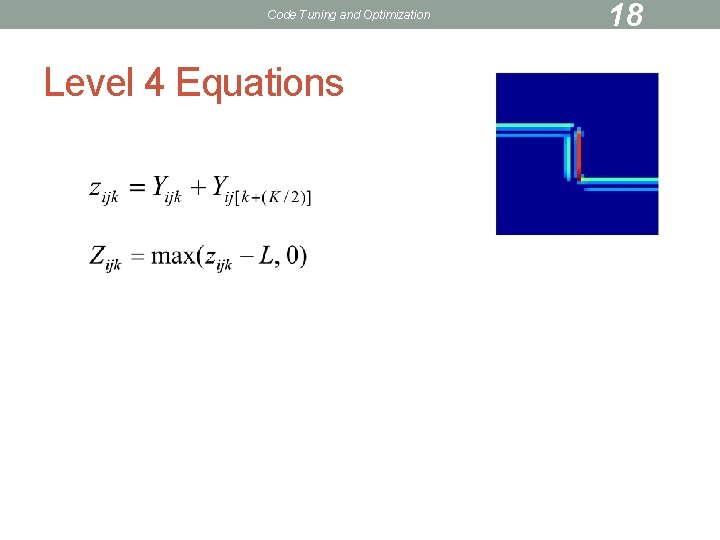
Code Tuning and Optimization Level 4 Equations 18
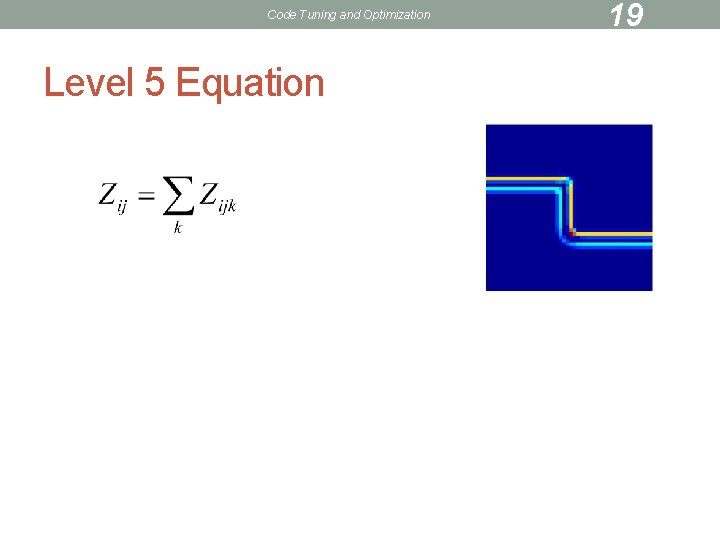
Code Tuning and Optimization Level 5 Equation 19
Code Tuning and Optimization Exercise 1 • Copy files from /scratch disc Katana% cp /scratch/kadin/tuning/*. • Choose C (gt. c and gt. h) or Fortran (gt. f 90) • Compile with no optimization: pgcc –O 0 –o gt gt. cc pgf 90 –O 0 –o gt gt. f 90 capital oh zero small oh • Submit rungt script to batch queue katana% qsub -b y rungt 20
Code Tuning and Optimization 21 Exercise 1 (cont’d) • Check status qstat –u username • • After run has completed a file will appear named rungt. o? ? ? , where ? ? ? represents the process number File contains result of time command • • • Write down wall-clock time Re-compile using –O 3 Re-run and check time
Code Tuning and Optimization Function/Subroutine Calls • often need to time part of code • timers can be inserted in source code • language-dependent 22
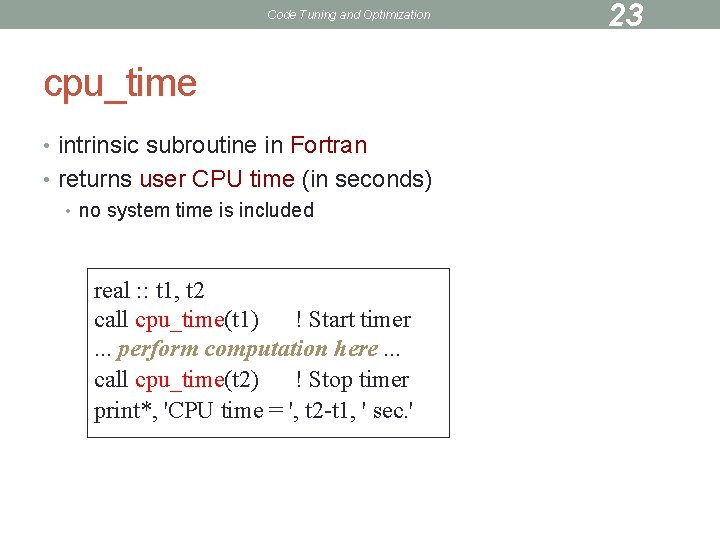
Code Tuning and Optimization cpu_time • intrinsic subroutine in Fortran • returns user CPU time (in seconds) • no system time is included real : : t 1, t 2 call cpu_time(t 1) ! Start timer. . . perform computation here. . . call cpu_time(t 2) ! Stop timer print*, 'CPU time = ', t 2 -t 1, ' sec. ' 23
Code Tuning and Optimization system_clock • intrinsic subroutine in Fortran • good for measuring wall-clock time 24
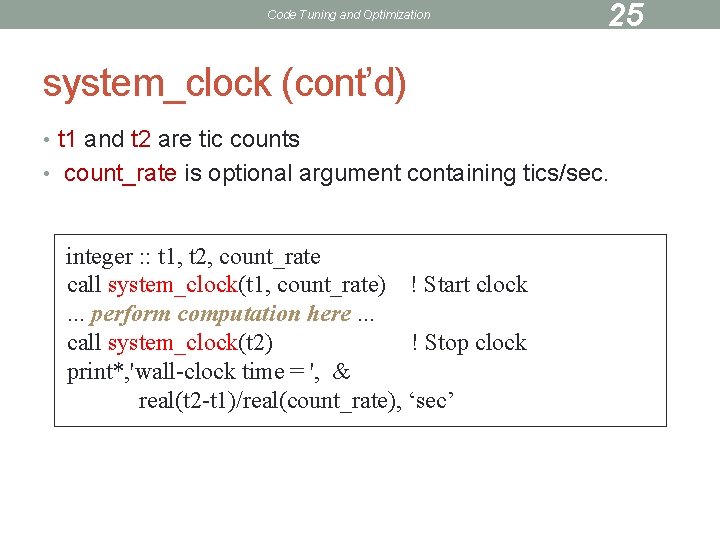
Code Tuning and Optimization 25 system_clock (cont’d) • t 1 and t 2 are tic counts • count_rate is optional argument containing tics/sec. integer : : t 1, t 2, count_rate call system_clock(t 1, count_rate) ! Start clock. . . perform computation here. . . call system_clock(t 2) ! Stop clock print*, 'wall-clock time = ', & real(t 2 -t 1)/real(count_rate), ‘sec’
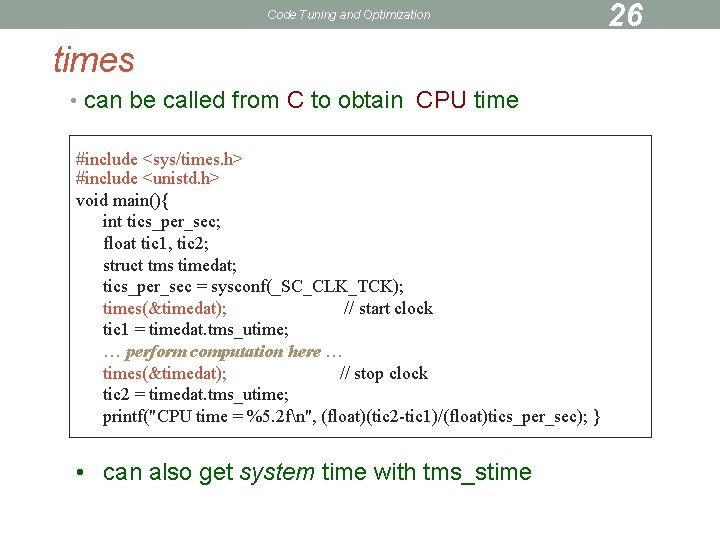
Code Tuning and Optimization times • can be called from C to obtain CPU time #include <sys/times. h> #include <unistd. h> void main(){ int tics_per_sec; float tic 1, tic 2; struct tms timedat; tics_per_sec = sysconf(_SC_CLK_TCK); times(&timedat); // start clock tic 1 = timedat. tms_utime; … perform computation here … times(&timedat); // stop clock tic 2 = timedat. tms_utime; printf("CPU time = %5. 2 fn", (float)(tic 2 -tic 1)/(float)tics_per_sec); } • can also get system time with tms_stime 26
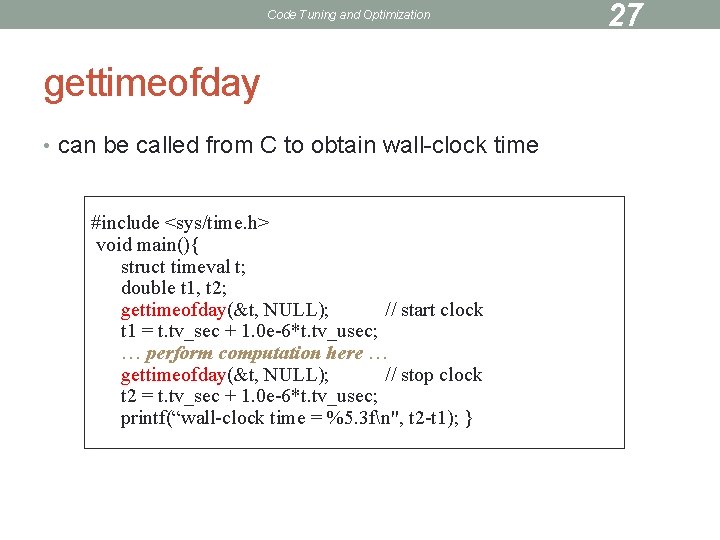
Code Tuning and Optimization gettimeofday • can be called from C to obtain wall-clock time #include <sys/time. h> void main(){ struct timeval t; double t 1, t 2; gettimeofday(&t, NULL); // start clock t 1 = t. tv_sec + 1. 0 e-6*t. tv_usec; … perform computation here … gettimeofday(&t, NULL); // stop clock t 2 = t. tv_sec + 1. 0 e-6*t. tv_usec; printf(“wall-clock time = %5. 3 fn", t 2 -t 1); } 27
Code Tuning and Optimization MPI_Wtime • convenient wall-clock timer for MPI codes 28
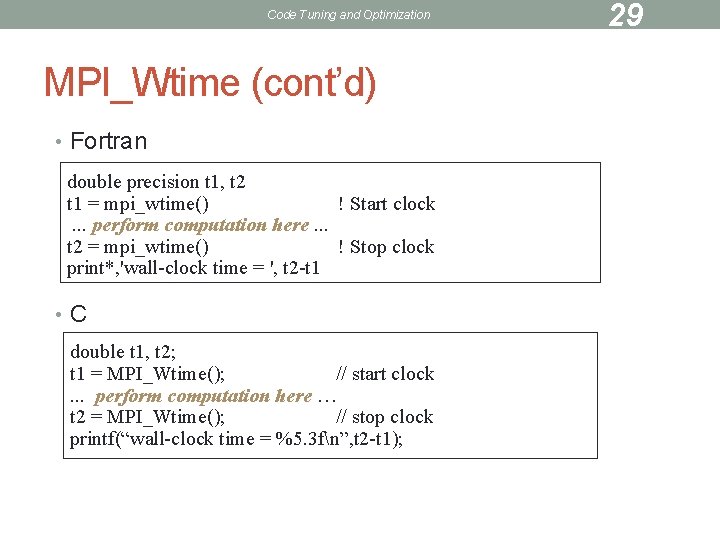
Code Tuning and Optimization MPI_Wtime (cont’d) • Fortran double precision t 1, t 2 t 1 = mpi_wtime() ! Start clock. . . perform computation here. . . t 2 = mpi_wtime() ! Stop clock print*, 'wall-clock time = ', t 2 -t 1 • C double t 1, t 2; t 1 = MPI_Wtime(); // start clock. . . perform computation here … t 2 = MPI_Wtime(); // stop clock printf(“wall-clock time = %5. 3 fn”, t 2 -t 1); 29
Code Tuning and Optimization omp_get_time • convenient wall-clock timer for Open. MP codes • resolution available by calling omp_get_wtick() 30
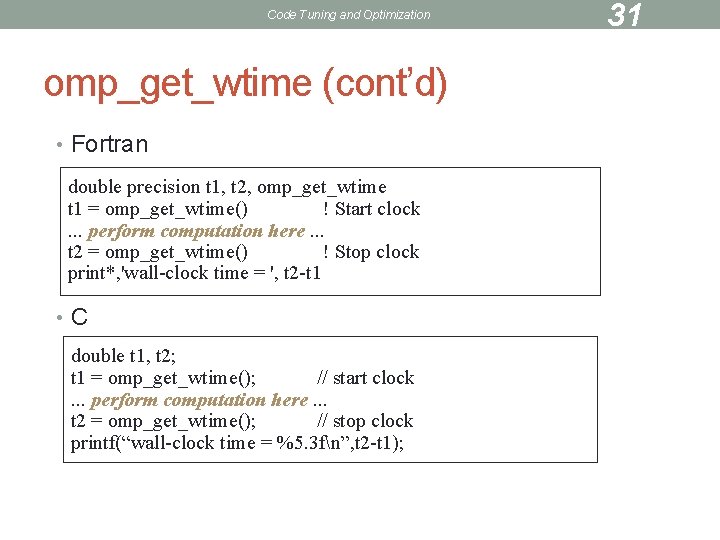
Code Tuning and Optimization omp_get_wtime (cont’d) • Fortran double precision t 1, t 2, omp_get_wtime t 1 = omp_get_wtime() ! Start clock. . . perform computation here. . . t 2 = omp_get_wtime() ! Stop clock print*, 'wall-clock time = ', t 2 -t 1 • C double t 1, t 2; t 1 = omp_get_wtime(); // start clock. . . perform computation here. . . t 2 = omp_get_wtime(); // stop clock printf(“wall-clock time = %5. 3 fn”, t 2 -t 1); 31
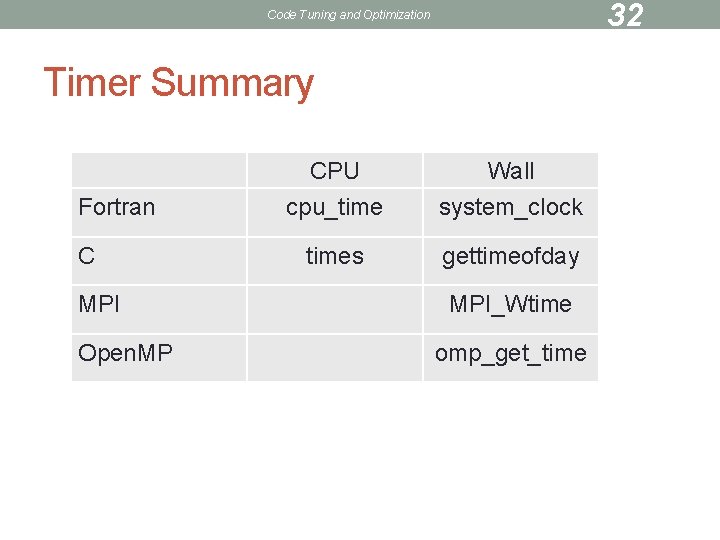
32 Code Tuning and Optimization Timer Summary Fortran C MPI Open. MP CPU cpu_time Wall system_clock times gettimeofday MPI_Wtime omp_get_time
Code Tuning and Optimization 33 Exercise 2 • Put wall-clock timer around each “level” in the example code • Print time for each level • Compile and run
Code Tuning and Optimization PROFILING 34
Code Tuning and Optimization 35 Profilers • profile tells you how much time is spent in each routine • gives a level of granularity not available with previous timers • e. g. , function may be called from many places • various profilers available, e. g. • gprof (GNU) -- function level profiling • pgprof (Portland Group) -- function and line level profiling
Code Tuning and Optimization 36 gprof • compile with -pg • when you run executable, file gmon. out will be created • gprof executable > myprof • this processes gmon. out into myprof • for multiple processes (MPI), copy or link gmon. out. n to gmon. out, then run gprof
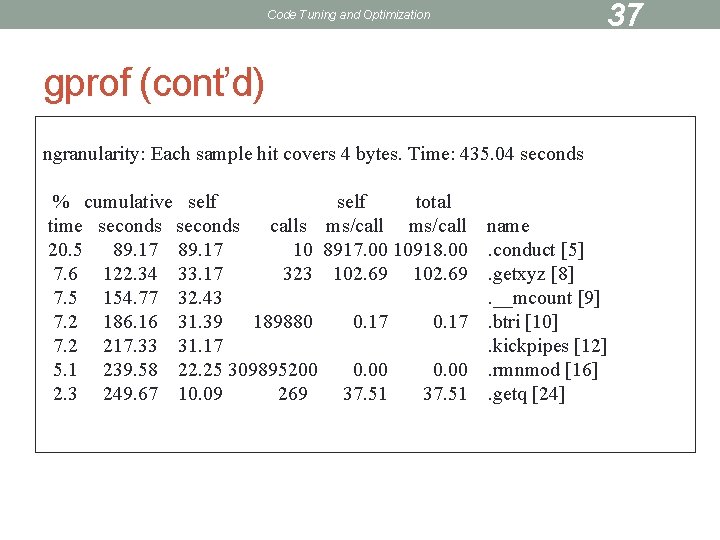
Code Tuning and Optimization 37 gprof (cont’d) ngranularity: Each sample hit covers 4 bytes. Time: 435. 04 seconds % cumulative self total time seconds calls ms/call name 20. 5 89. 17 10 8917. 00 10918. 00. conduct [5] 7. 6 122. 34 33. 17 323 102. 69. getxyz [8] 7. 5 154. 77 32. 43. __mcount [9] 7. 2 186. 16 31. 39 189880 0. 17. btri [10] 7. 2 217. 33 31. 17. kickpipes [12] 5. 1 239. 58 22. 25 309895200 0. 00. rmnmod [16] 2. 3 249. 67 10. 09 269 37. 51. getq [24]
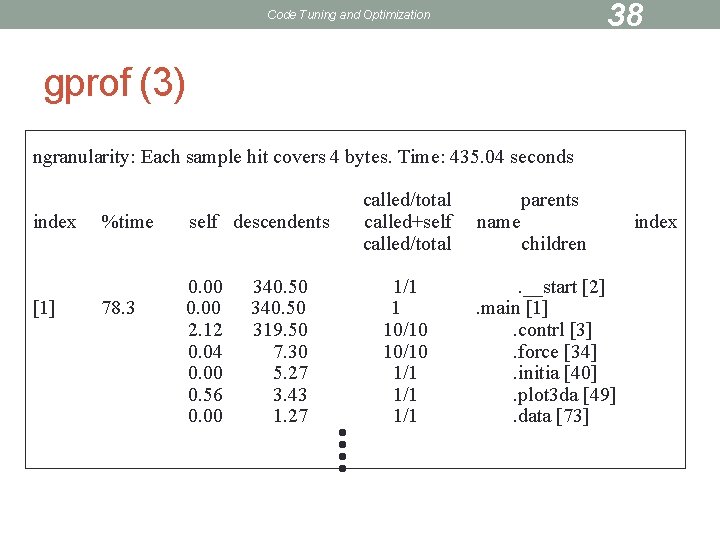
38 Code Tuning and Optimization gprof (3) ngranularity: Each sample hit covers 4 bytes. Time: 435. 04 seconds index [1] %time 78. 3 self descendents 0. 00 2. 12 0. 04 0. 00 0. 56 0. 00 340. 50 319. 50 7. 30 5. 27 3. 43 1. 27 called/total called+self called/total 1/1 1 10/10 1/1 1/1 name parents children . __start [2]. main [1]. contrl [3]. force [34]. initia [40]. plot 3 da [49]. data [73] index
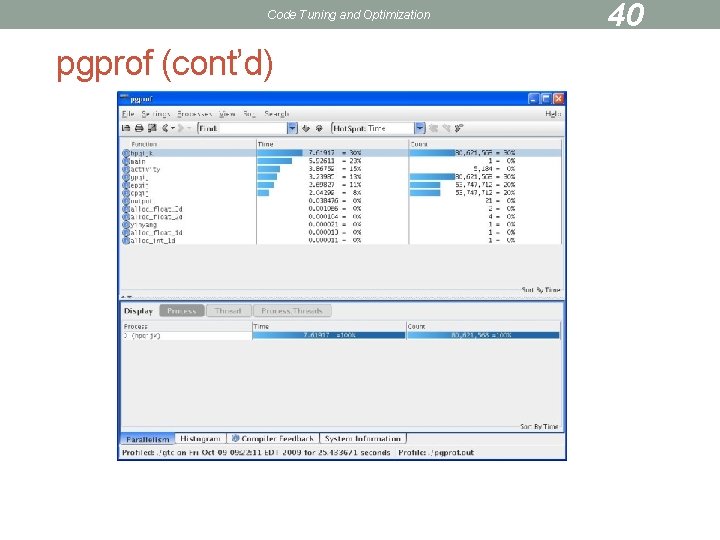
Code Tuning and Optimization pgprof • compile with Portland Group compiler • pgf 90 (pgf 95, etc. ) • pgcc • –Mprof=func • similar to –pg • run code • pgprof –exe executable • pops up window with flat profile 39
Code Tuning and Optimization pgprof (cont’d) 40
Code Tuning and Optimization 41 pgprof (3) • To save profile data to a file: • re-run pgprof using –text flag • at command prompt type p > filename • filename is the name you want to give the profile • type quit to get out of profiler • Close pgprof as soon as you’re through • Leaving window open ties up a license (only a few available)
Code Tuning and Optimization 42 Line-Level Profiling • Times individual lines • For pgprof, compile with the flag –Mprof=line • Optimizer will re-order lines • profiler will lump lines in some loops or other constructs • may want to compile without optimization, may not • In flat profile, double-click on function to get line-level data
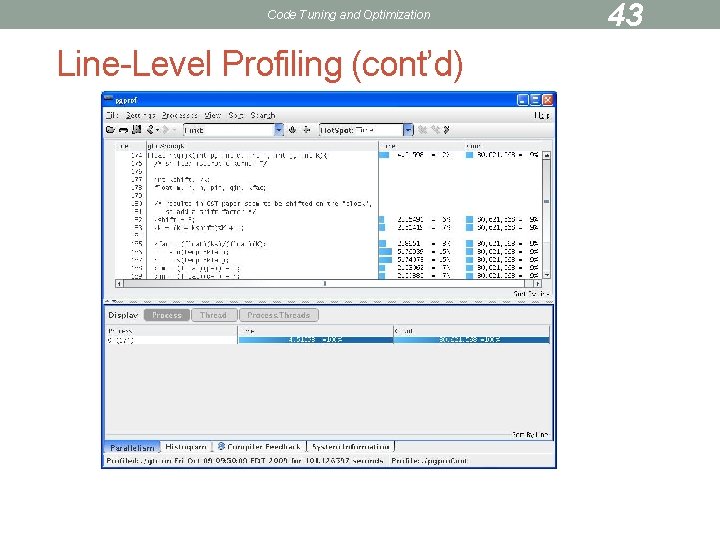
Code Tuning and Optimization Line-Level Profiling (cont’d) 43

Code Tuning and Optimization CACHE 44
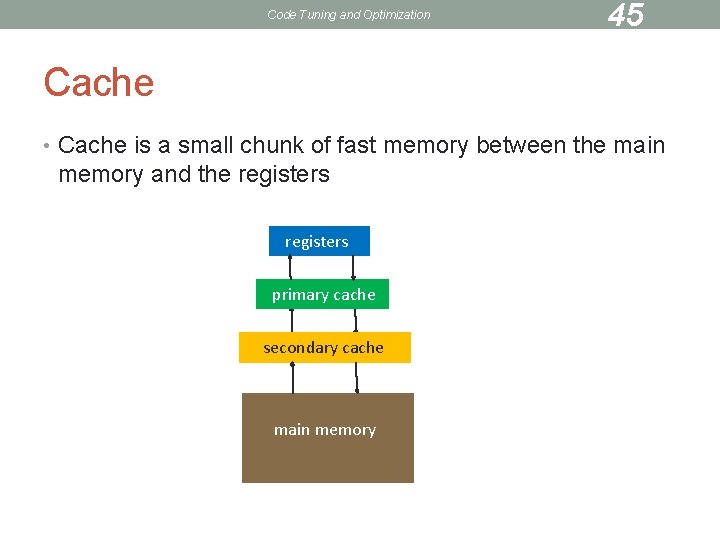
Code Tuning and Optimization 45 Cache • Cache is a small chunk of fast memory between the main memory and the registers primary cache secondary cache main memory
Code Tuning and Optimization 46 Cache (cont’d) • If variables are used repeatedly, code will run faster since cache memory is much faster than main memory • Variables are moved from main memory to cache in lines • L 1 cache line sizes on our machines • Opteron (katana cluster) 64 bytes • Xeon (katana cluster) 64 bytes • Power 4 (p-series) 128 bytes • PPC 440 (Blue Gene) 32 bytes • Pentium III (linux cluster) 32 bytes
Code Tuning and Optimization 47 Cache (3) • Why not just make the main memory out of the same stuff as cache? • Expensive • Runs hot • This was actually done in Cray computers • Liquid cooling system
Code Tuning and Optimization 48 Cache (4) • Cache hit • Required variable is in cache • Cache miss • Required variable not in cache • If cache is full, something else must be thrown out (sent back to main memory) to make room • Want to minimize number of cache misses
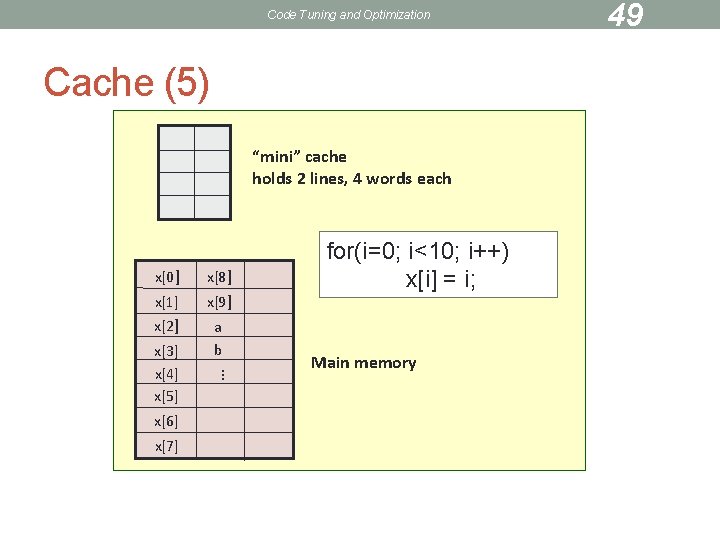
Code Tuning and Optimization Cache (5) “mini” cache holds 2 lines, 4 words each x[0] x[8] x[1] x[9] x[2] a b x[7] … x[6] Main memory … x[3] x[4] x[5] for(i=0; i<10; i++) x[i] = i; 49
![Code Tuning and Optimization Cache (6) x[0] • will ignore i for simplicity • Code Tuning and Optimization Cache (6) x[0] • will ignore i for simplicity •](http://slidetodoc.com/presentation_image_h2/6f004f4fc2b4260aab1e4d08b1713199/image-50.jpg)
Code Tuning and Optimization Cache (6) x[0] • will ignore i for simplicity • need x[0], not in cache miss • load line from memory into cache • next 3 loop indices result in cache hits x[1] x[2] x[3] x[0] x[8] x[1] x[9] x[2] a b x[7] … x[6] … x[3] x[4] x[5] for(i=0; i<10; i++) x[i] = i; 50
![Code Tuning and Optimization Cache (7) x[0] x[4] • need x[4], not in cache Code Tuning and Optimization Cache (7) x[0] x[4] • need x[4], not in cache](http://slidetodoc.com/presentation_image_h2/6f004f4fc2b4260aab1e4d08b1713199/image-51.jpg)
Code Tuning and Optimization Cache (7) x[0] x[4] • need x[4], not in cache miss • load line from memory into cache • next 3 loop indices result in cache hits x[1] x[5] x[2] x[6] x[3] x[7] x[0] x[8] x[1] x[9] x[2] a b x[7] … x[6] … x[3] x[4] x[5] for(i=0; i<10; i++) x[i] = i; 51
![Code Tuning and Optimization Cache (8) x[8] x[4] • need x[8], not in cache Code Tuning and Optimization Cache (8) x[8] x[4] • need x[8], not in cache](http://slidetodoc.com/presentation_image_h2/6f004f4fc2b4260aab1e4d08b1713199/image-52.jpg)
Code Tuning and Optimization Cache (8) x[8] x[4] • need x[8], not in cache miss • load line from memory into cache • no room in cache! • replace old line x[9] x[5] a x[6] b x[7] x[0] x[8] x[1] x[9] x[2] a b x[7] … x[6] … x[3] x[4] x[5] for(i=0; i<10; i++) x[i] = i; 52
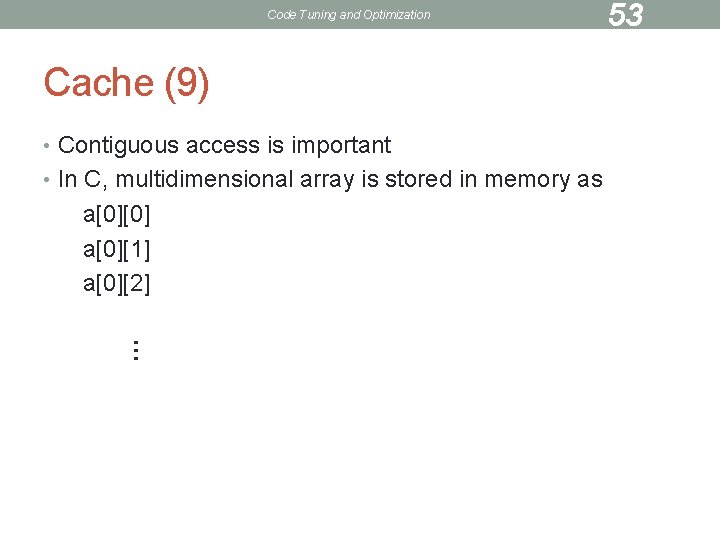
Code Tuning and Optimization Cache (9) • Contiguous access is important • In C, multidimensional array is stored in memory as a[0][0] a[0][1] a[0][2] 53 …
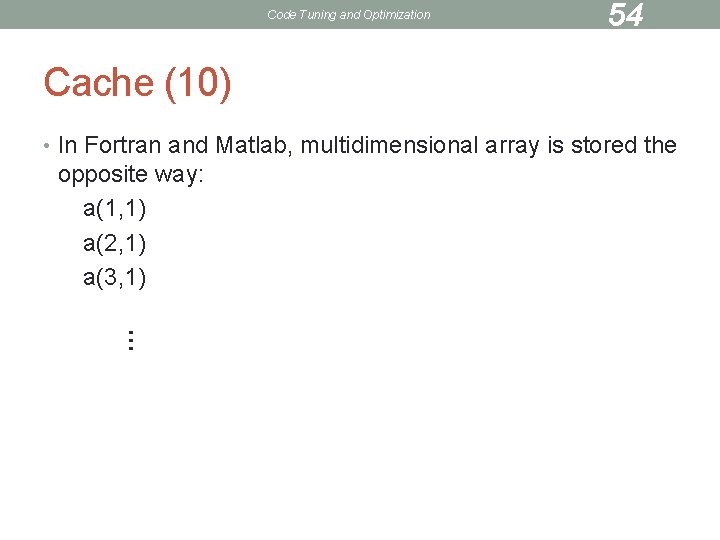
Code Tuning and Optimization 54 Cache (10) • In Fortran and Matlab, multidimensional array is stored the opposite way: a(1, 1) a(2, 1) a(3, 1) …
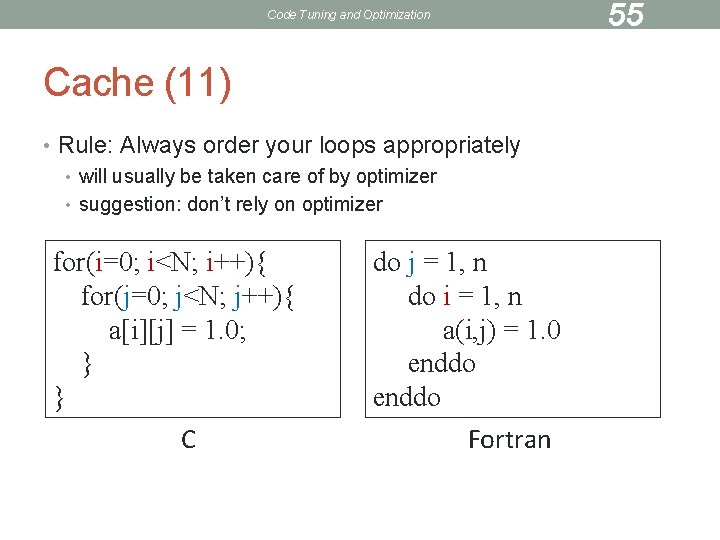
Code Tuning and Optimization Cache (11) • Rule: Always order your loops appropriately • will usually be taken care of by optimizer • suggestion: don’t rely on optimizer for(i=0; i<N; i++){ for(j=0; j<N; j++){ a[i][j] = 1. 0; } } C do j = 1, n do i = 1, n a(i, j) = 1. 0 enddo Fortran 55

Code Tuning and Optimization TUNING TIPS 56
Code Tuning and Optimization 57 Tuning Tips • Some of these tips will be taken care of by compiler optimization • It’s best to do them yourself, since compilers vary • Two important rules • minimize number of operations • access cache contiguously
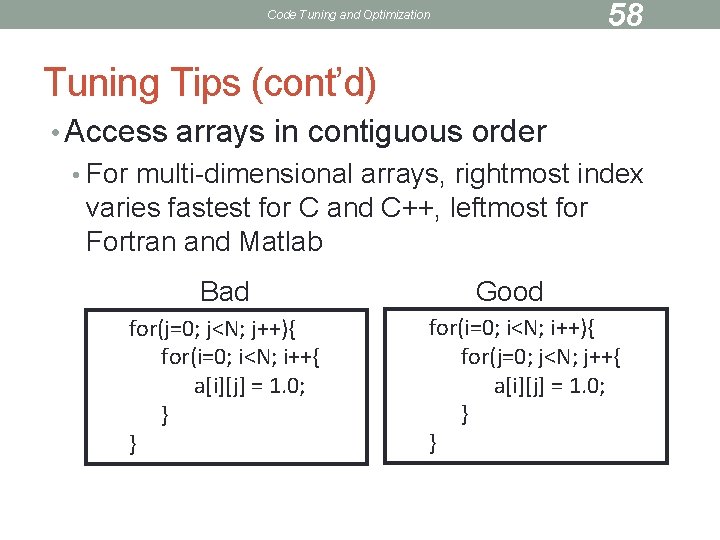
58 Code Tuning and Optimization Tuning Tips (cont’d) • Access arrays in contiguous order • For multi-dimensional arrays, rightmost index varies fastest for C and C++, leftmost for Fortran and Matlab Bad for(j=0; j<N; j++){ for(i=0; i<N; i++{ a[i][j] = 1. 0; } } Good for(i=0; i<N; i++){ for(j=0; j<N; j++{ a[i][j] = 1. 0; } }
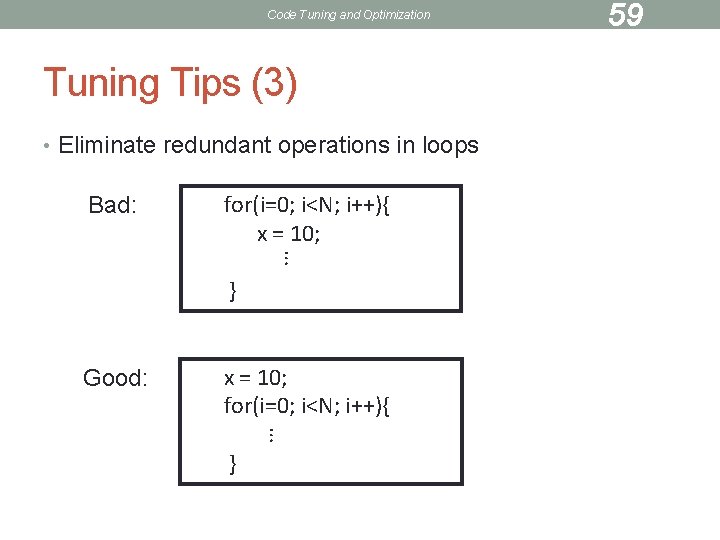
Code Tuning and Optimization Tuning Tips (3) • Eliminate redundant operations in loops Bad: for(i=0; i<N; i++){ x = 10; … } Good: x = 10; for(i=0; i<N; i++){ … } 59
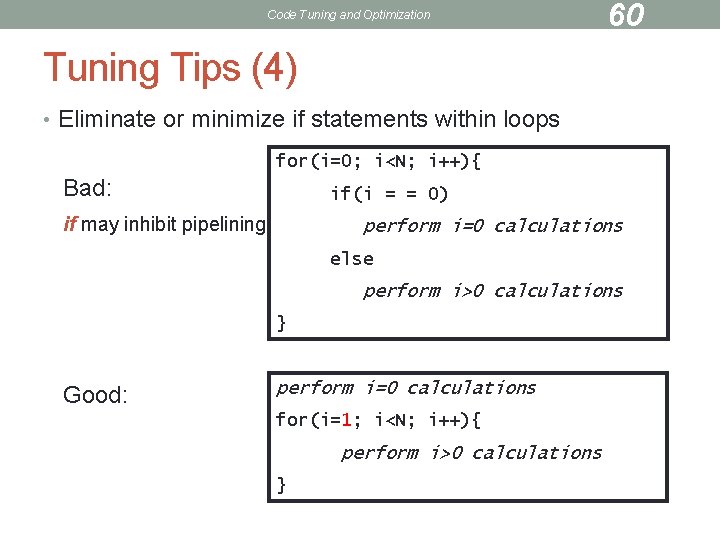
Code Tuning and Optimization 60 Tuning Tips (4) • Eliminate or minimize if statements within loops for(i=0; i<N; i++){ Bad: if(i = = 0) if may inhibit pipelining perform i=0 calculations else perform i>0 calculations } Good: perform i=0 calculations for(i=1; i<N; i++){ perform i>0 calculations }
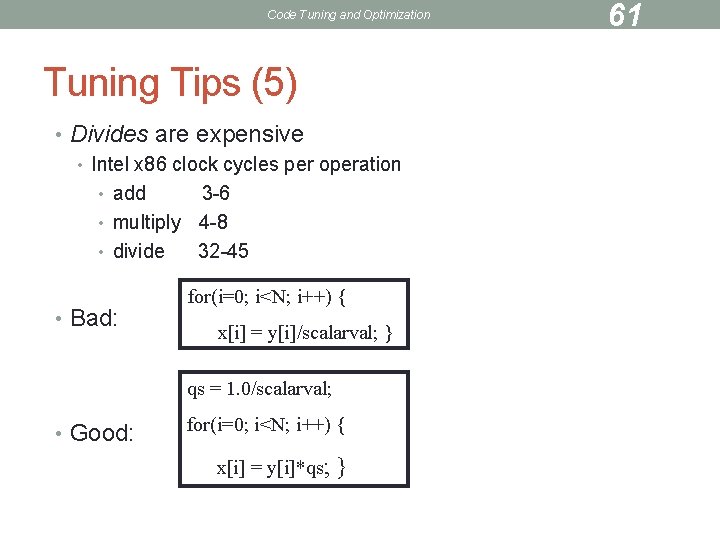
Code Tuning and Optimization Tuning Tips (5) • Divides are expensive • Intel x 86 clock cycles per operation • add 3 -6 • multiply 4 -8 • divide 32 -45 • Bad: for(i=0; i<N; i++) { x[i] = y[i]/scalarval; } qs = 1. 0/scalarval; • Good: for(i=0; i<N; i++) { x[i] = y[i]*qs; } 61
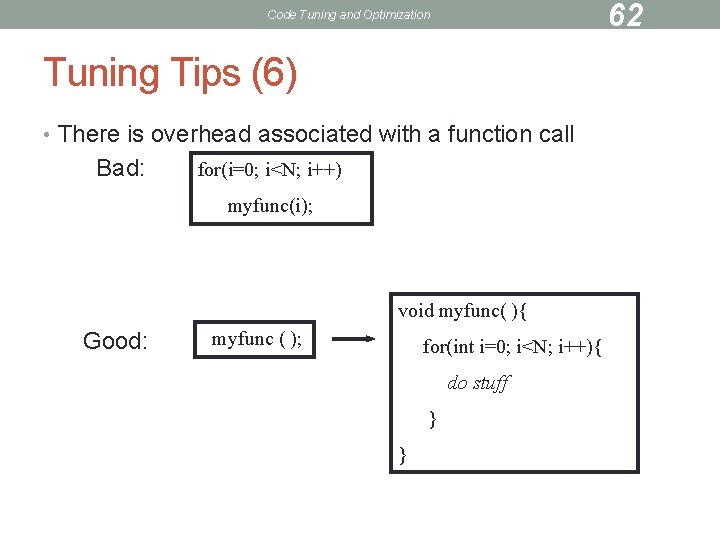
62 Code Tuning and Optimization Tuning Tips (6) • There is overhead associated with a function call Bad: for(i=0; i<N; i++) myfunc(i); void myfunc( ){ Good: myfunc ( ); for(int i=0; i<N; i++){ do stuff } }
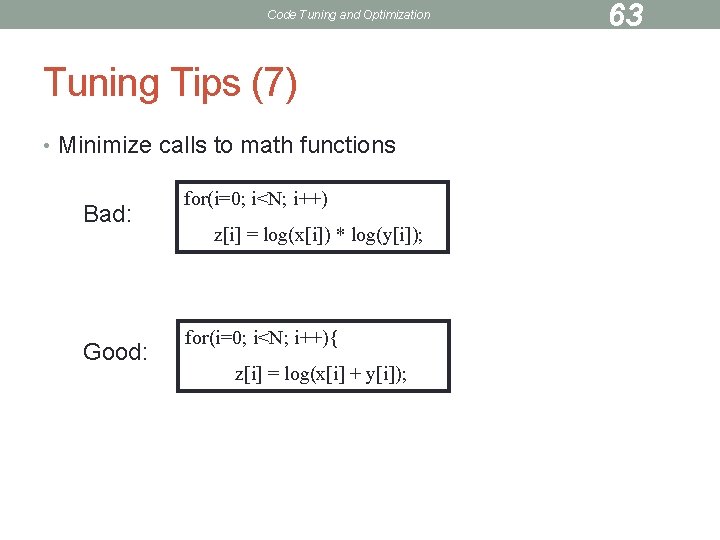
Code Tuning and Optimization Tuning Tips (7) • Minimize calls to math functions Bad: Good: for(i=0; i<N; i++) z[i] = log(x[i]) * log(y[i]); for(i=0; i<N; i++){ z[i] = log(x[i] + y[i]); 63
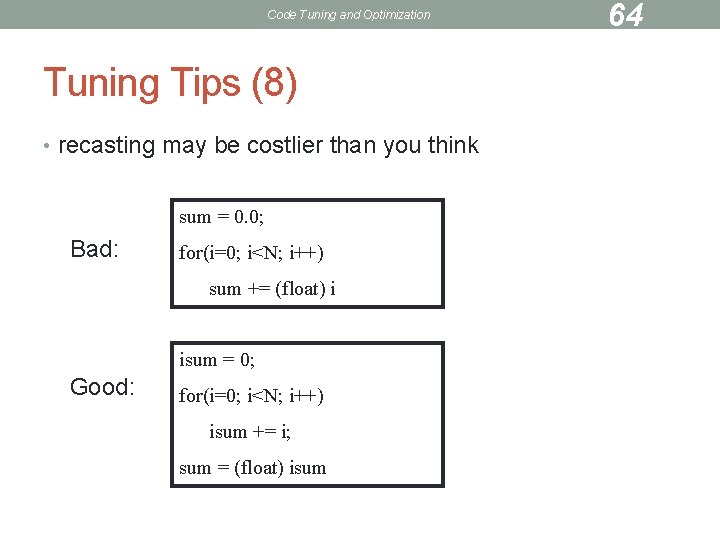
Code Tuning and Optimization Tuning Tips (8) • recasting may be costlier than you think sum = 0. 0; Bad: for(i=0; i<N; i++) sum += (float) i isum = 0; Good: for(i=0; i<N; i++) isum += i; sum = (float) isum 64
Code Tuning and Optimization 65 Exercise 3 (not in class) • The example code provided is written in a clear, readable style, that also happens to violate lots of the tuning tips that we have just reviewed. • Examine the line-level profile. What lines are using the most time? Is there anything we might be able to do to make it run faster? • • • We will discuss options as a group come up with a strategy modify code re-compile and run compare timings • Re-examine level profile, come up with another strategy, repeat procedure, etc.
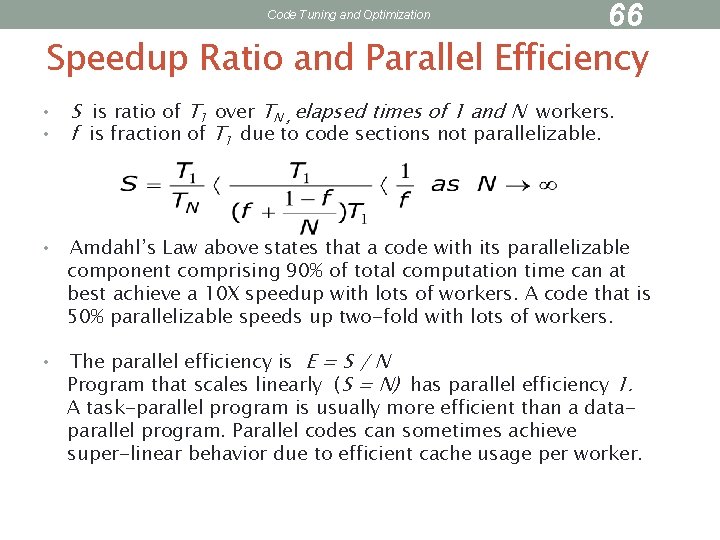
Code Tuning and Optimization 66 Speedup Ratio and Parallel Efficiency • • S is ratio of T 1 over TN , elapsed times of 1 and N workers. f is fraction of T 1 due to code sections not parallelizable. • Amdahl’s Law above states that a code with its parallelizable component comprising 90% of total computation time can at best achieve a 10 X speedup with lots of workers. A code that is 50% parallelizable speeds up two-fold with lots of workers. • The parallel efficiency is E = S / N Program that scales linearly (S = N) has parallel efficiency 1. A task-parallel program is usually more efficient than a dataparallel program. Parallel codes can sometimes achieve super-linear behavior due to efficient cache usage per worker.
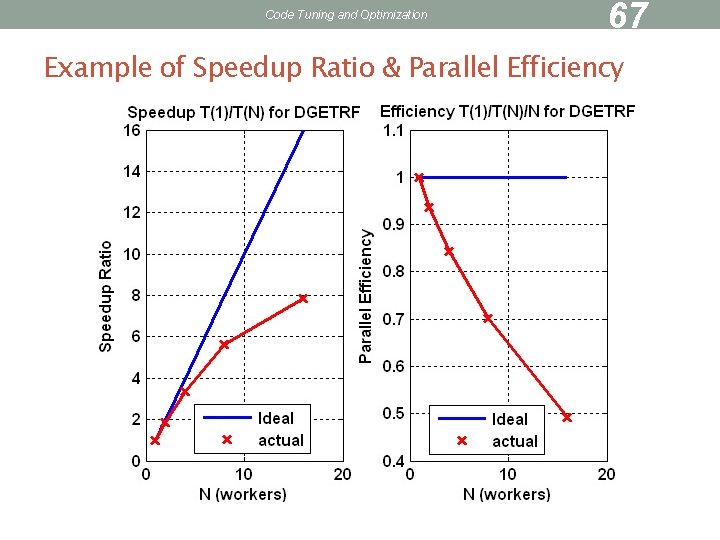
Code Tuning and Optimization 67 Example of Speedup Ratio & Parallel Efficiency
- Slides: 67