COCOMO MODEL Effort computationarpma Effort Adjustment Factor Cost

 • Effort Adjustment Factor Cost Driver Low Nominal High Required Reliability Very")

 • · External inquiries – interactive inputs requiring a response •")
 • STEP 2: Multiply each number by a weight factor,")
 • STEP 3: Calculate the total UFP (Unadjusted Function")
 • Technical Complexity Factors: • • • • SEG 3300")
 • Technical Complexity Factors: • • • • 1. 2.")
 • STEP 5: Sum the resulting numbers too obtain")
 • Function Points • FP=UFP*(0. 65+0. 01*DI)= 55*(0. 65+0. 01*30)=52. 25 •")

 Assuming LOC’s per FP for: Java = 53,")


 • Effort Adjustment Factor Cost Driver Low Nominal High Required Reliability")
 Total EAF = Product of the selected factors Adjusted")


 The following table gives the recommended percentage distribution of")

- Slides: 25
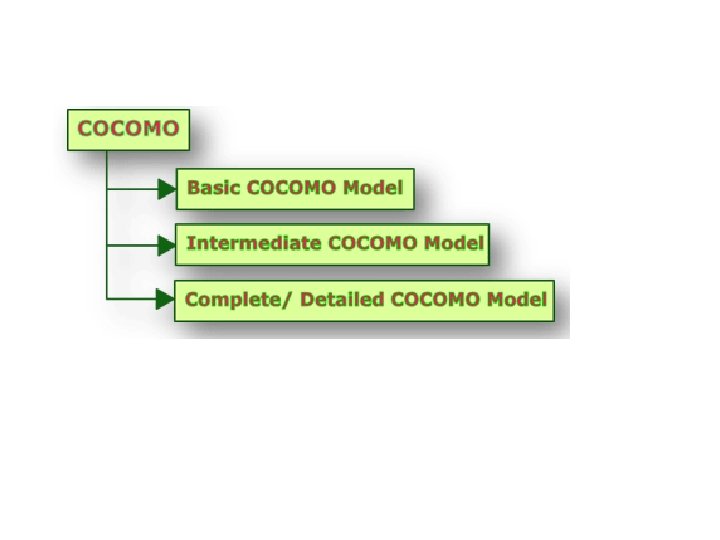
COCOMO MODEL
Effort computation(çarpma) • Effort Adjustment Factor Cost Driver Low Nominal High Required Reliability Very Low. 75 1. 15 Very High 1. 40 Extra High 1. 40 . 88 1. 00 Database Size . 94 1. 00 1. 08 1. 16 Product Complexity . 70 . 85 1. 00 1. 15 1. 30 1. 65 Execution Time Constraint 1. 00 1. 11 1. 30 1. 66 Main Storage Constraint 1. 00 1. 06 1. 21 1. 56 Virtual Machine Volatility . 87 1. 00 1. 15 1. 30 Comp Turn Around Time . 87 1. 00 1. 07 1. 15 Analyst Capability 1. 46 1. 19 1. 00 . 86 . 71 Application Experience 1. 29 1. 13 1. 00 . 91 . 82 Programmers Capability 1. 42 1. 17 1. 00 . 86 . 70 Virtual machine Experience 1. 21 1. 10 1. 00 . 90 Language Experience 1. 14 1. 07 1. 00 . 95 Modern Prog Practices 1. 24 1. 10 1. 00 . 91 . 82 SW Tools 1. 24 1. 10 1. 00 . 91 . 83 Required Dev Schedule 1. 23 1. 08 1. 00 1. 04 1. 10 1, 10 SEG 3300 A&B W 2004 R. L. Probert 5
Function Points • STEP 1: measure size in terms of the amount of functionality in a system. Function points are computed by first calculating an unadjusted function point count (UFC). Counts are made for the following categories • ·External inputs – those items provided by the user that describe distinct application-oriented data (such as file names and menu selections) • ·External outputs – those items provided to the user that generate distinct application-oriented data (such as reports and messages, rather than the individual components of these) SEG 3300 A&B W 2004 R. L. Probert 6
Function Points(. ) • · External inquiries – interactive inputs requiring a response • · External files – machine-readable interfaces to other systems • · Internal files – logical master files in the system SEG 3300 A&B W 2004 R. L. Probert 7
Function Points(. . ) • STEP 2: Multiply each number by a weight factor, according to complexity (simple, average or complex) of the parameter, associated with that number. The value is given by a table: SEG 3300 A&B W 2004 R. L. Probert 8
Function Points(. . . ) • STEP 3: Calculate the total UFP (Unadjusted Function Points) • STEP 4: Calculate the total TCF (Technical Complexity Factor) by giving a value between 0 and 5 according to the importance of the following points: TCF=0. 65+0. 01*DI SEG 3300 A&B W 2004 R. L. Probert 9
Function Points(. . ) • Technical Complexity Factors: • • • • SEG 3300 A&B W 2004 1. 2. 3. 4. 5. 6. 7. 8. 9. 10. 11. 12. 13. 14. Data Communication Distributed Data Processing Performance Criteria Heavily Utilized Hardware High Transaction Rates Online Data Entry Online Updating End-user Efficiency Complex Computations Reusability Ease of Installation Ease of Operation Portability Maintainability R. L. Probert 10
Example (. . ) • Technical Complexity Factors: • • • • 1. 2. 3. 4. 5. 6. 7. 8. 9. 10. 11. 12. 13. 14. Data Communication Distributed Data Processing Performance Criteria Heavily Utilized Hardware High Transaction Rates Online Data Entry Online Updating End-user Efficiency Complex Computations Reusability Ease of Installation Ease of Operation Portability Maintainability 3 0 4 0 3 3 5 3 3 • DI =30 (Degree of Influence) SEG 3300 A&B W 2004 R. L. Probert 11
Function Points(. . . ) • STEP 5: Sum the resulting numbers too obtain DI (degree of influence) • STEP 6: TCF (Technical Complexity Factor) by given by the formula • TCF=0. 65+0. 01*DI • STEP 6: Function Points are by given by the formula • FP=UFP*TCF SEG 3300 A&B W 2004 R. L. Probert 12
Example (…) • Function Points • FP=UFP*(0. 65+0. 01*DI)= 55*(0. 65+0. 01*30)=52. 25 • That means the is FP=52. 25 SEG 3300 A&B W 2004 R. L. Probert 13
Relation between LOC and FP • Relationship: • LOC = Language Factor * FP • where • LOC (Lines of Code) • FP (Function Points) SEG 3300 A&B W 2004 R. L. Probert 14
Relation between LOC and FP(. ) Assuming LOC’s per FP for: Java = 53, (1 FP= 53 LOC) C++ = 64 KLOC = FP * LOC_per_FP / 1000 It means for the Spell. Chekcer Example: (Java) LOC=52. 25*53=2769. 25 LOC or 2. 76 KLOC SEG 3300 A&B W 2004 R. L. Probert 15
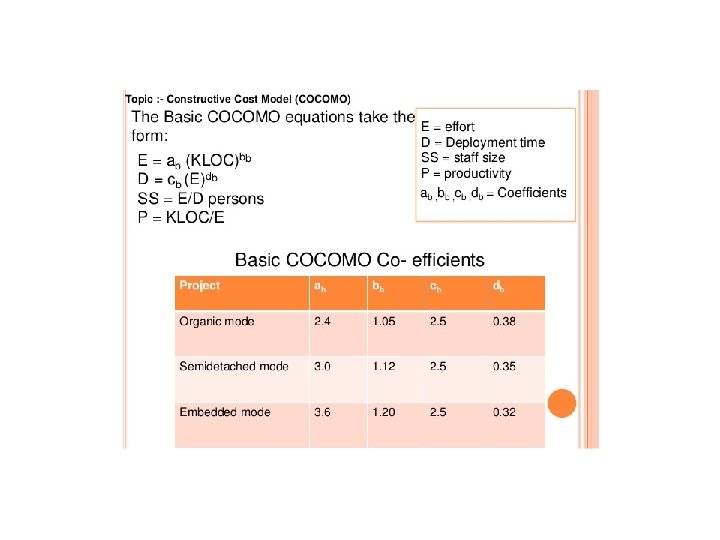
Effort Computation • The Basic COCOMO model computes effort as a function of program size. The Basic COCOMO equation is: • E = a. KLOC^b • Effort for three modes of Basic COCOMO. Mode SEG 3300 A&B W 2004 a b Organic 2. 4 1. 05 Semidetached 3. 0 1. 12 Embedded 3. 6 1. 20 R. L. Probert 16
Example SEG 3300 A&B W 2004 R. L. Probert 17
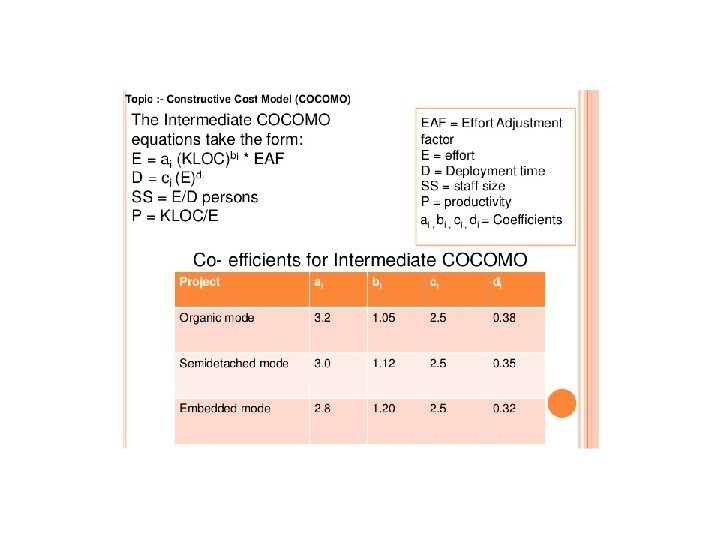
Effort Computation • The intermediate COCOMO model computes effort as a function of program size and a set of cost drivers. The Intermediate COCOMO equation is: • E = a. KLOC^b*EAF • Effort for three modes of intermediate COCOMO. Mode SEG 3300 A&B W 2004 a b Organic 3. 2 1. 05 Semidetached 3. 0 1. 12 Embedded 2. 8 1. 20 R. L. Probert 18
Effort computation(. ) • Effort Adjustment Factor Cost Driver Low Nominal High Required Reliability Very Low. 75 1. 15 Very High 1. 40 Extra High 1. 40 . 88 1. 00 Database Size . 94 1. 00 1. 08 1. 16 Product Complexity . 70 . 85 1. 00 1. 15 1. 30 1. 65 Execution Time Constraint 1. 00 1. 11 1. 30 1. 66 Main Storage Constraint 1. 00 1. 06 1. 21 1. 56 Virtual Machine Volatility . 87 1. 00 1. 15 1. 30 Comp Turn Around Time . 87 1. 00 1. 07 1. 15 Analyst Capability 1. 46 1. 19 1. 00 . 86 . 71 Application Experience 1. 29 1. 13 1. 00 . 91 . 82 Programmers Capability 1. 42 1. 17 1. 00 . 86 . 70 Virtual machine Experience 1. 21 1. 10 1. 00 . 90 Language Experience 1. 14 1. 07 1. 00 . 95 Modern Prog Practices 1. 24 1. 10 1. 00 . 91 . 82 SW Tools 1. 24 1. 10 1. 00 . 91 . 83 Required Dev Schedule 1. 23 1. 08 1. 00 1. 04 1. 10 1, 10 SEG 3300 A&B W 2004 R. L. Probert 19
Effort Computation (. . ) Total EAF = Product of the selected factors Adjusted value of Effort: Adjusted Person Months: APM = (Total EAF) * PM SEG 3300 A&B W 2004 R. L. Probert 20
Example SEG 3300 A&B W 2004 R. L. Probert 21
Software Development Time • Development Time Equation Parameter Table: Parameter Organic Semidetached Embedded C 2. 5 D 0. 38 0. 35 0. 32 Development Time, TDEV = C * (APM **D) Number of Personnel, NP = APM / TDEV SEG 3300 A&B W 2004 R. L. Probert 22
Distribution of Effort • A development process typically consists of the following stages: • • - Requirements Analysis - Design (High Level + Detailed) - Implementation & Coding - Testing (Unit + Integration) SEG 3300 A&B W 2004 R. L. Probert 23
Distribution of Effort (. ) The following table gives the recommended percentage distribution of Effort (APM) and TDEV for these stages: Percentage Distribution of Effort and Time Table: Req Analysis Design, HLD + DD Implementation Testing Effort 23% 29% 22% 21% 100% TDEV 39% 25% 15% 21% 100% SEG 3300 A&B W 2004 R. L. Probert 24
Error Estimation • Calculate the estimated number of errors in your design, i. e. total errors found in requirements, specifications, code, user manuals, and bad fixes: • Adjust the Function Point calculated in step 1 AFP = FP ** 1. 25 • Use the following table for calculating error estimates SEG 3300 A&B W 2004 Error Type Error / AFP Requirements 1 Design 1. 25 Implementation 1. 75 Documentation 0. 6 Due to Bug Fixes 0. 4 R. L. Probert 25