CO 2 Diffusion Through Gelatin Experiment Presented by

CO 2 Diffusion Through Gelatin Experiment Presented by Jennifer Welborn June 2012

Learning Goals. . Through this Power. Point, STEMDIGITAL participants will: See how the concept of diffusion is related to a variety of curricular standards Understand how ADI software can be used to show the process and rate of diffusion both qualitatively and quantitatively

OVERVIEW Multidiscipline Standards Alignment Concept Development Factors Affecting Rate of Diffusion and Global Environmental Change Research Questions Experiment--Diffusion of CO 2 Through Gelatin: Model of Diffusion in Cells Using the Digital Camera as a Data Collection Tool Analyzing Data Using ADI Software

Standards Alignment • Physical Science/Chemistry: particle motion theory; p. H; temperature; mixtures and solutions; color change as an indicator of a change in physical properties/chemical composition; acid/base indicators and protonation • Biology: passive transport; cellular structure, etc. • Ecology/Environmental Science: environmental effects on living cells/systems • Math: rates; relationships; data collection, organization, analysis, interpretation, ratios and proportions

Diffusion– movement of a substance from a region of higher concentration to a region of lower concentration. Diffusion continues until equilibrium--- the concentration of a substance is equal throughout a space

Diffusion and Cells • Dissolved particles that are small or non-polar can diffuse through the cell membranes. • The process of diffusion is one of the ways in which substances like oxygen, carbon dioxide and water move into and out of cells. Carbon dioxide from the environment diffuses into plant cells

Factors That Affect Rate of Diffusion • Temperature • Concentration of material diffusing • Density of substance material is diffusing into • Particle Size Diffusion and Global Environmental Change • What might be the impact of increasing temperatures and atmospheric CO 2 levels on diffusion in cells?

Research Questions • Can a digital camera be used to quantify a change in the color of gelatin with BTB in it as carbon dioxide diffuses through it over time? • What affect might an increase in the concentration of CO 2 have on the rate of CO 2 diffusion through the gelatin? • What effect might an increase in temperature have on the rate of diffusion? • How might this model apply to living organisms and changes in the environment?

Conducting the Experiment/Gathering and Analyzing Data 1. Set up the experiment according to the directions on the lab directions handout. 2. Photograph the control at the beginning, then a sample of each cube exposed to CO 2 over time (1 hour, 6 hours). 3. Use the ADI line tool, R, G, B values and graph colors option (SPACIAL ANALYSIS ) to analyze data both qualitatively and quantitatively.

QUALITATIVE ANALYSIS

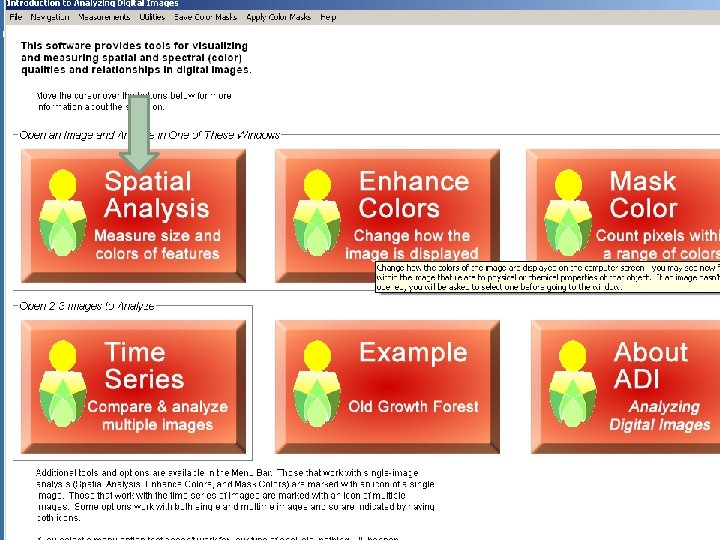
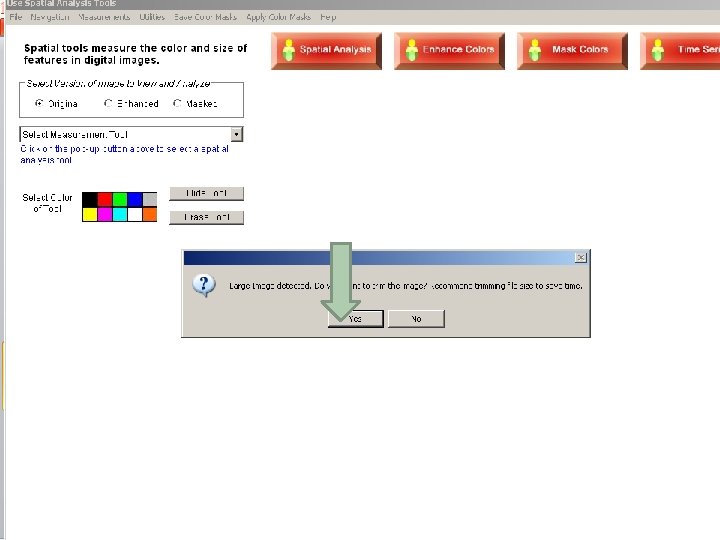
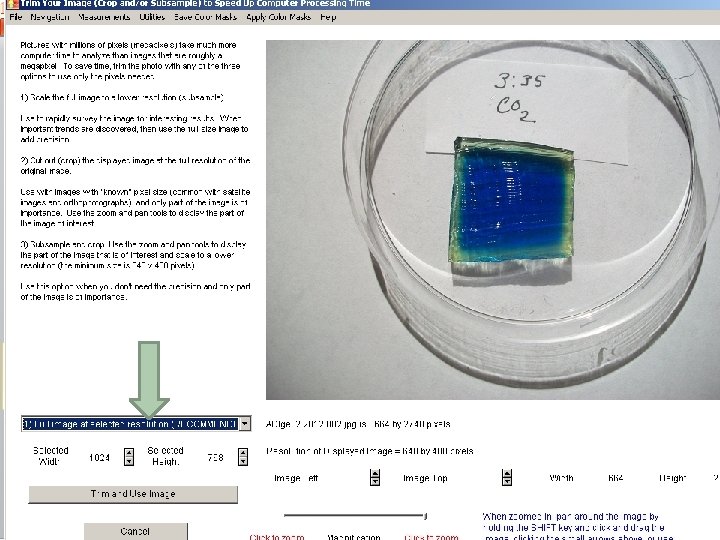
Open a picture, then trim the photo to increase processing time

Click on Full Image. . Recommended

Click on Trim and Use Image

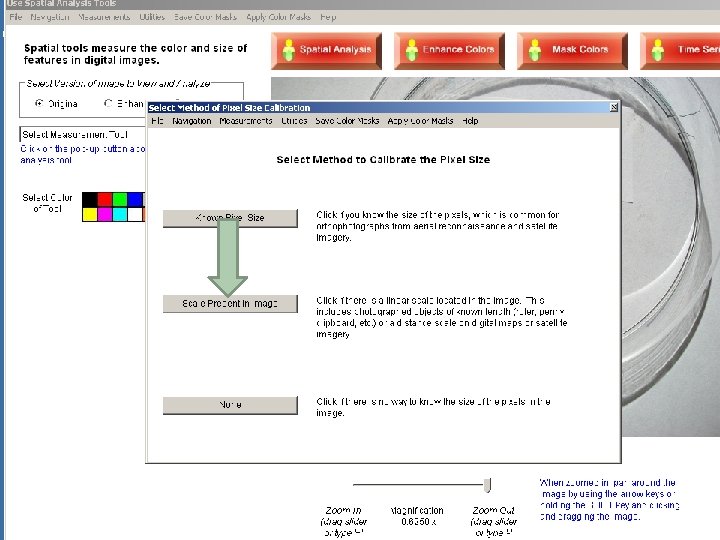
Choose None

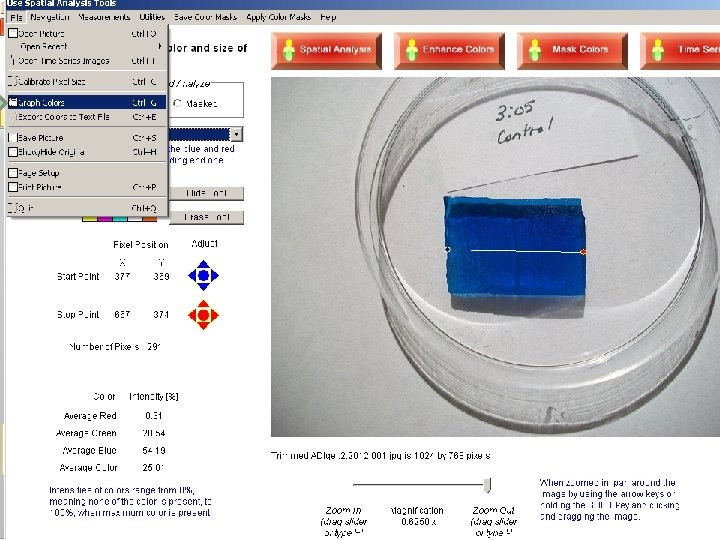
Select line tool option

Click these to fine tune Placement of starting and ending points ending Note R, G, B values Zoom in to help you Place the beginning and ending points Draw a line using a color of choice

You can see all the colors or turn off some of them to focus on just one

All colors off except green

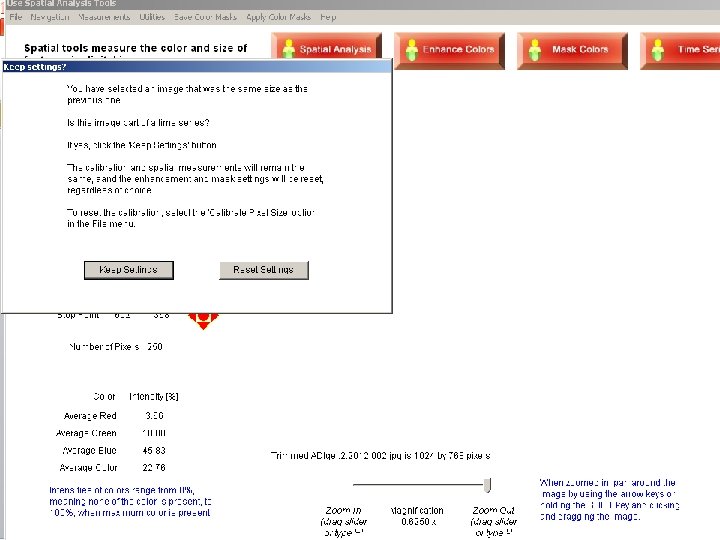
The Value of The Control The color graph for the control offers a baseline of R, G, B values to the student. The next set of slides shows a sample of gelatin exposed to CO 2 and its corresponding graph after 30 minutes. ADI lets you keep the settings if you are photographing the same thing over time.
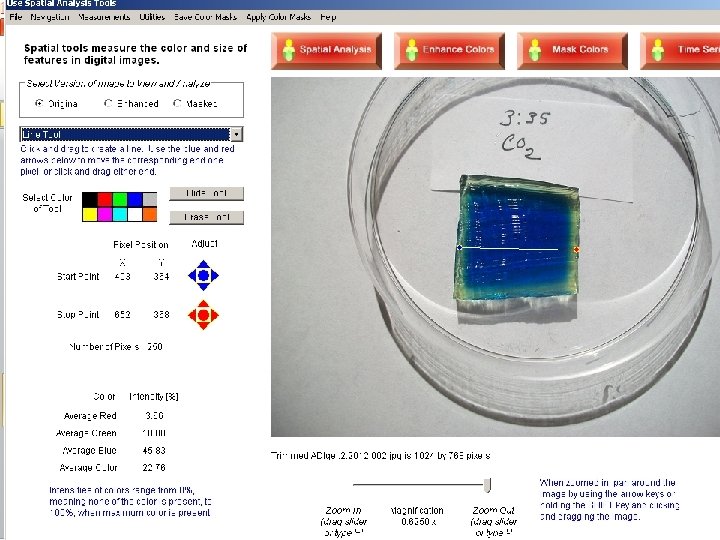
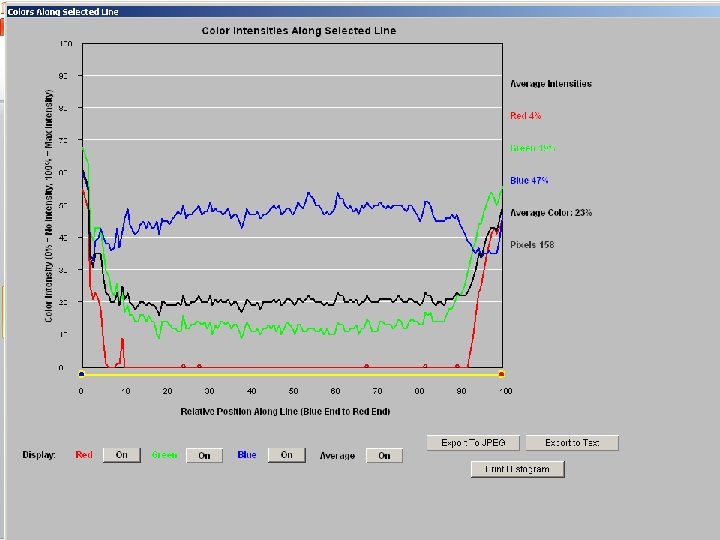

This is a qualitative graph of diffusion At 30 minutes, the point at which the CO 2 appears to have diffused is 10/100.

ADI for Quantitative Analysis of Diffusion • ADI can be used to quantify diffusion as well. • The petri dish in the photo has a known diameter. • To quantify diffusion, follow the same steps for opening the photo but choose scale present in image.

Draw a diagonal across the petri dish Record actual length

Draw line across gelatin Length of gelatin line Zoom in to help with accuracy

Draw a line to where It looks like the diffusion ends Length of diffusion line

Future Inquiry Possibilities Using the Digital Camera as a data collection tool, observe how changing: temperature; density of gelatin; or concentration of the solute (CO 2)--to mimic increasing CO 2 levels--affects the rate of diffusion.
- Slides: 33