
Clustering Methods Part 7 Outlier removal Pasi Frnti

- Slides: 26
Clustering Methods: Part 7 Outlier removal Pasi Fränti Speech and Image Processing Unit School of Computing University of Eastern Finland
Outlier detection methods Distance-based methods • Knorr & Ng Density-based methods • KDIST: Kth nearest distance • Mean. DIST: Mean distance Graph-based methods • Mk. NN: Mutual K-nearest neighbor • ODIN: Indegree of nodes in k-NN graph
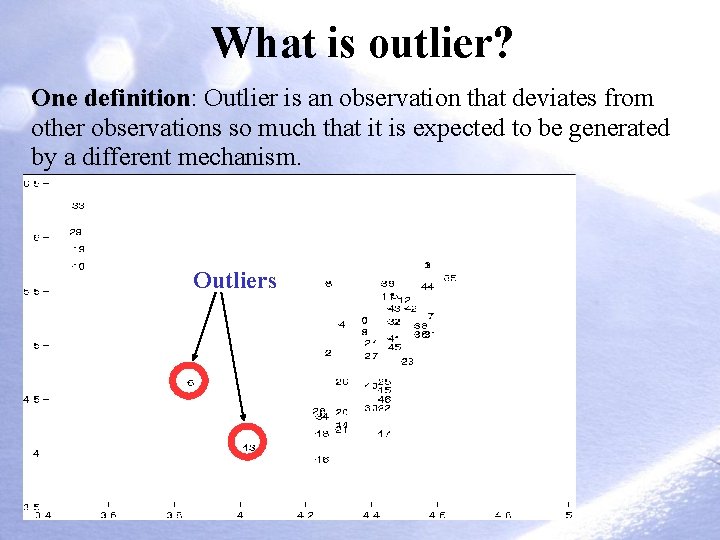
What is outlier? One definition: Outlier is an observation that deviates from other observations so much that it is expected to be generated by a different mechanism. Outliers
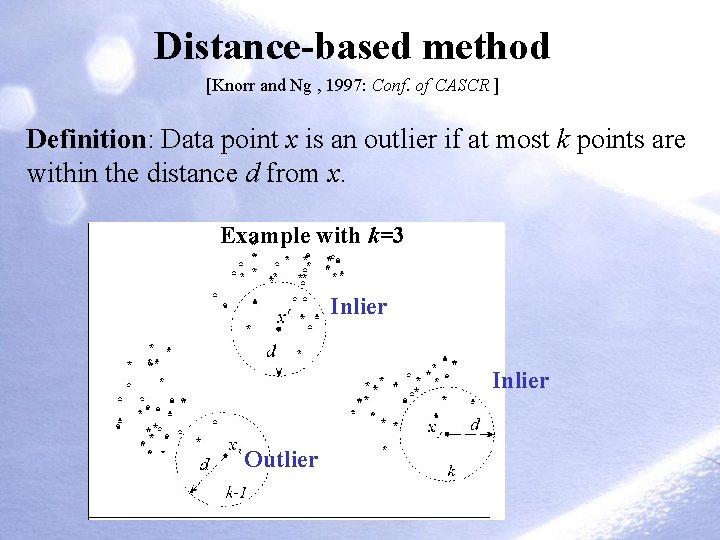
Distance-based method [Knorr and Ng , 1997: Conf. of CASCR ] Definition: Data point x is an outlier if at most k points are within the distance d from x. Example with k=3 Inlier Outlier
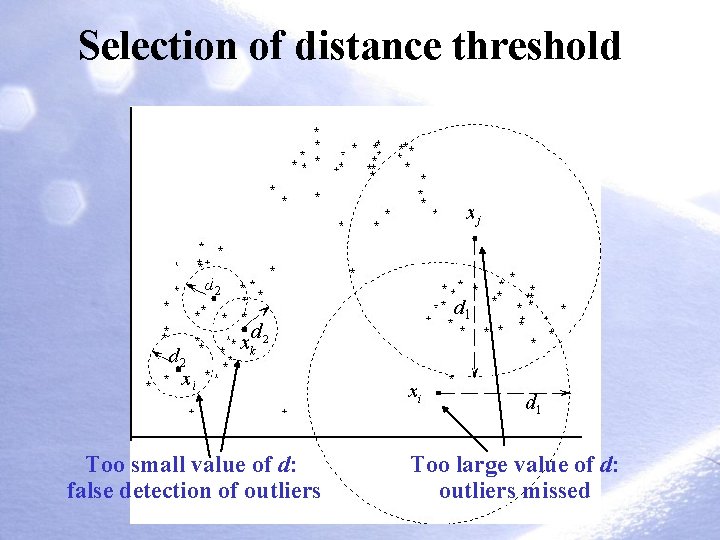
Selection of distance threshold Too small value of d: false detection of outliers Too large value of d: outliers missed
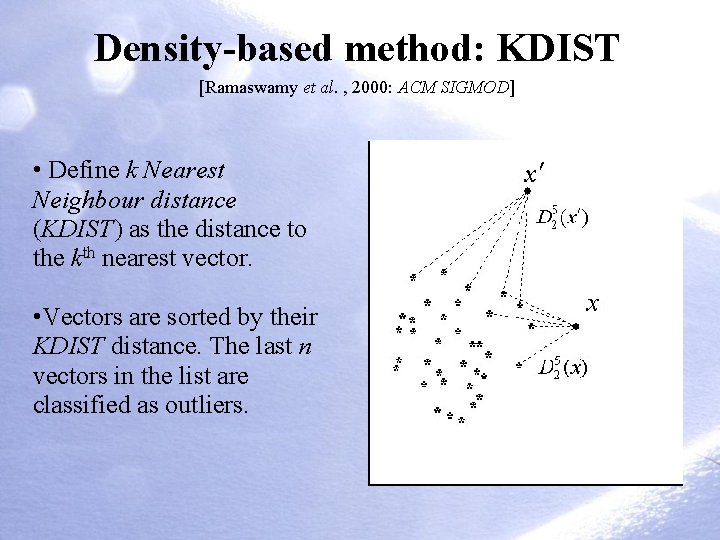
Density-based method: KDIST [Ramaswamy et al. , 2000: ACM SIGMOD] • Define k Nearest Neighbour distance (KDIST) as the distance to the kth nearest vector. • Vectors are sorted by their KDIST distance. The last n vectors in the list are classified as outliers.
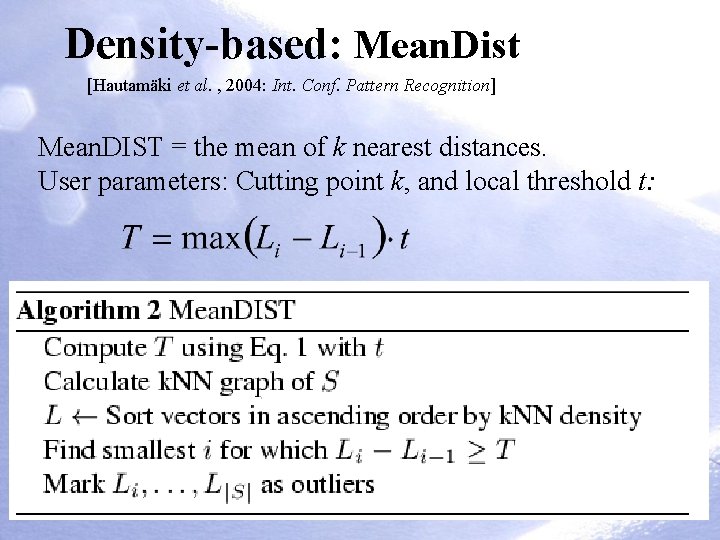
Density-based: Mean. Dist [Hautamäki et al. , 2004: Int. Conf. Pattern Recognition] Mean. DIST = the mean of k nearest distances. User parameters: Cutting point k, and local threshold t:
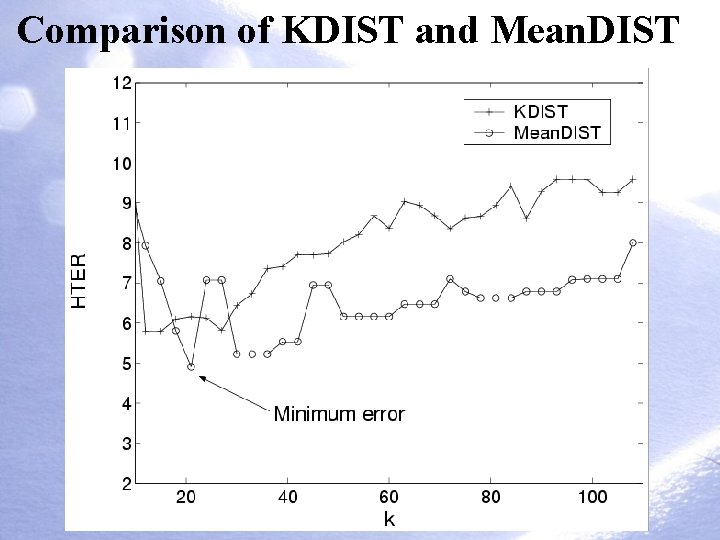
Comparison of KDIST and Mean. DIST
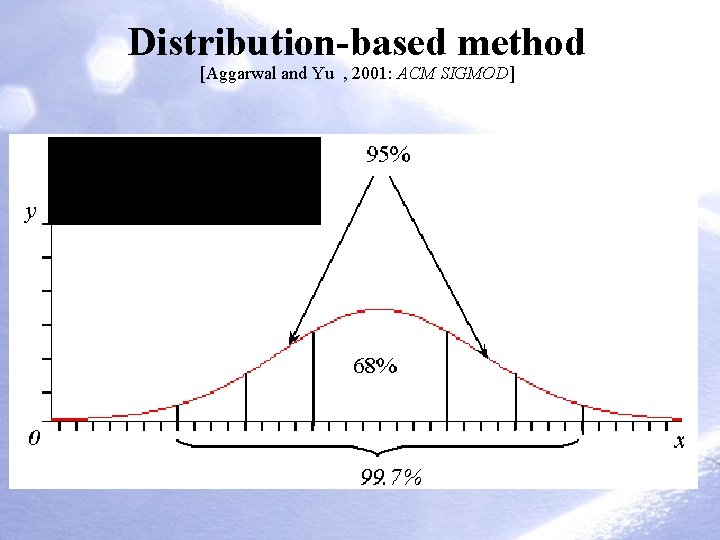
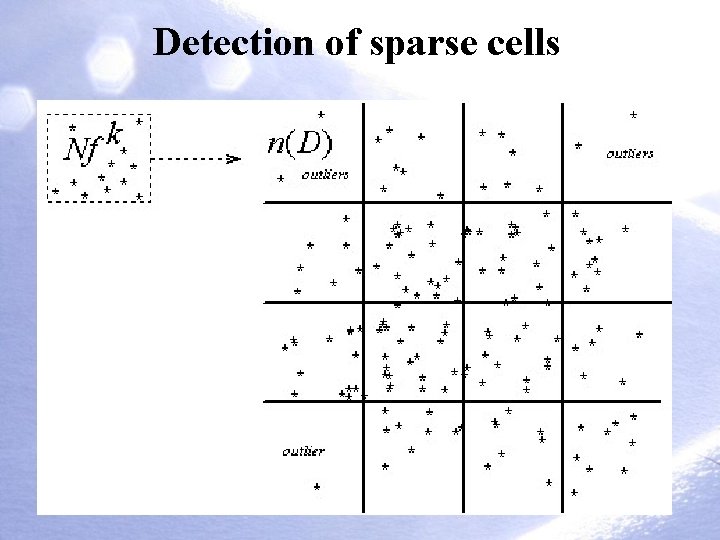
Distribution-based method [Aggarwal and Yu , 2001: ACM SIGMOD]
Detection of sparse cells
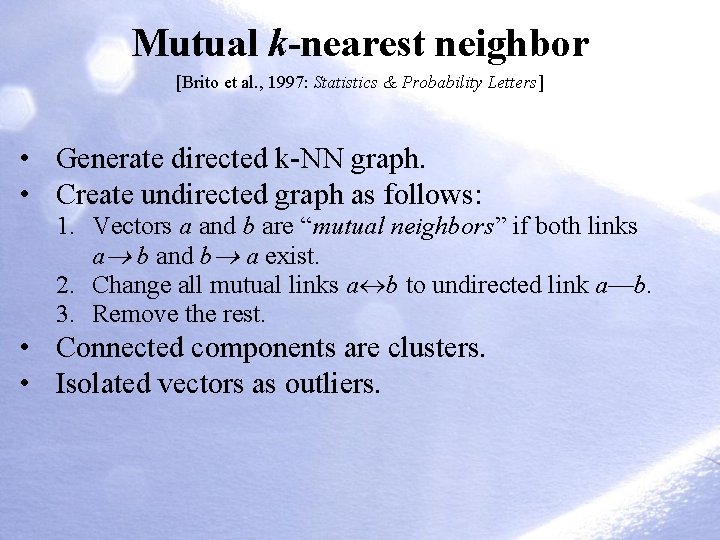
Mutual k-nearest neighbor [Brito et al. , 1997: Statistics & Probability Letters] • Generate directed k-NN graph. • Create undirected graph as follows: 1. Vectors a and b are “mutual neighbors” if both links a b and b a exist. 2. Change all mutual links a b to undirected link a—b. 3. Remove the rest. • Connected components are clusters. • Isolated vectors as outliers.
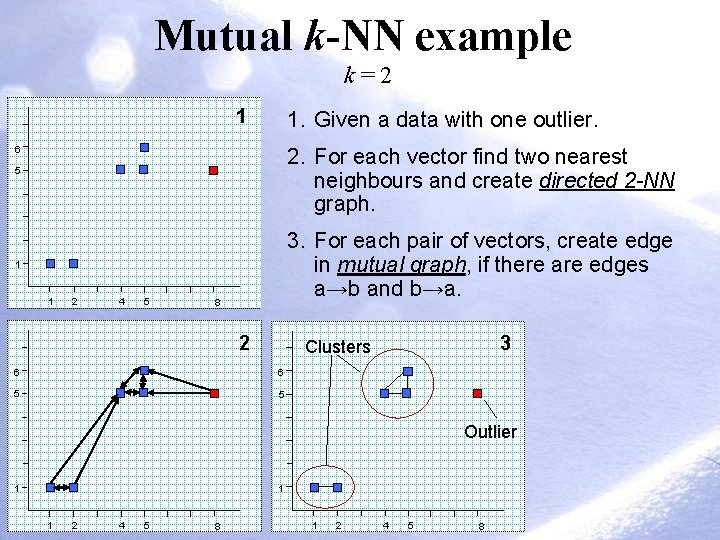
Mutual k-NN example k=2 1 1. Given a data with one outlier. 2. For each vector find two nearest neighbours and create directed 2 -NN graph. 6 5 3. For each pair of vectors, create edge in mutual graph, if there are edges a→b and b→a. 1 1 2 4 5 8 2 3 Clusters 6 6 5 5 Outlier 1 1 1 2 4 5 8
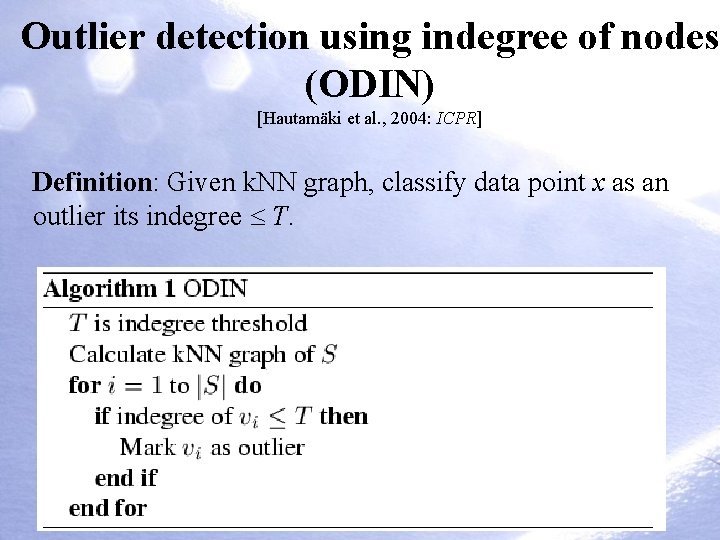
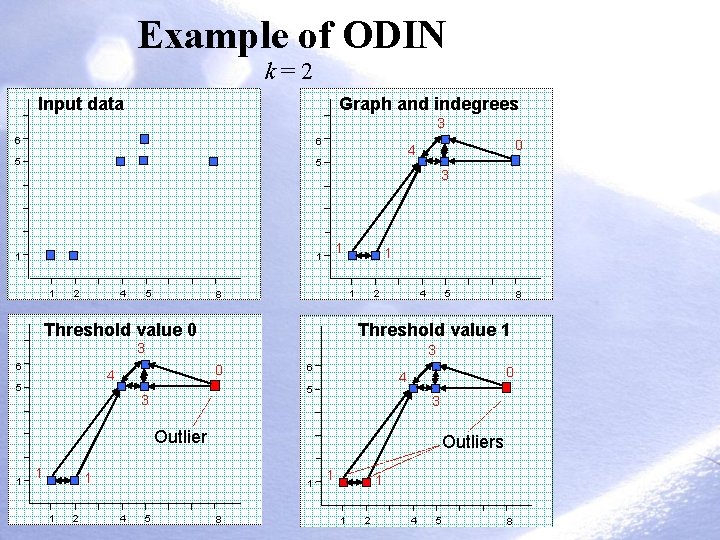
Outlier detection using indegree of nodes (ODIN) [Hautamäki et al. , 2004: ICPR] Definition: Given k. NN graph, classify data point x as an outlier its indegree T.
Example of ODIN k=2 Input data Graph and indegrees 3 6 6 5 5 1 1 1 2 4 5 3 1 1 2 1 8 Threshold value 0 4 0 6 5 3 0 4 3 Outlier 1 1 Outliers 1 1 2 1 4 8 3 4 5 5 Threshold value 1 3 6 0 4 5 8 1 1 1 2 4 5 8
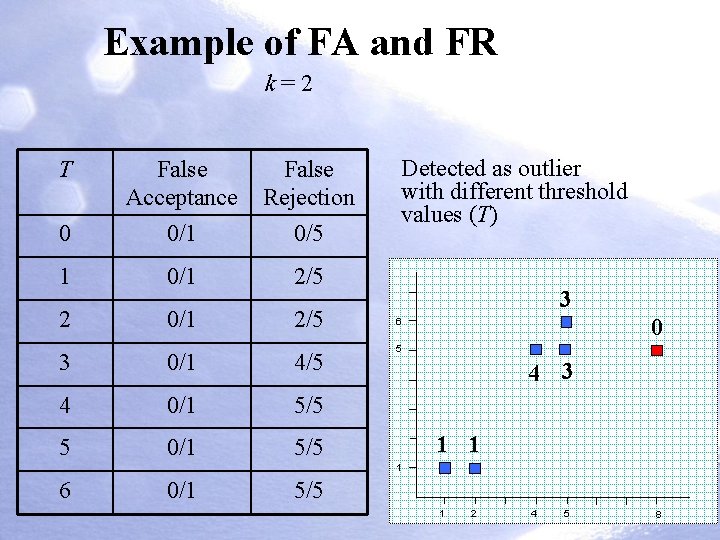
Example of FA and FR k=2 T False Acceptance False Rejection 0 0/1 0/5 1 0/1 2/5 2 0/1 2/5 3 0/1 4/5 4 0/1 5/5 5 0/1 5/5 Detected as outlier with different threshold values (T) 3 0 6 5 4 3 1 1 1 6 0/1 5/5 1 2 4 5 8
6 5 1 1 2 4 5 8
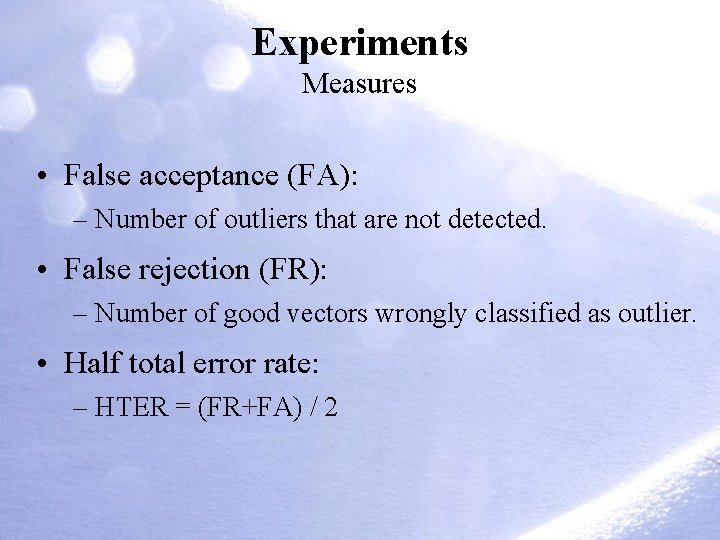
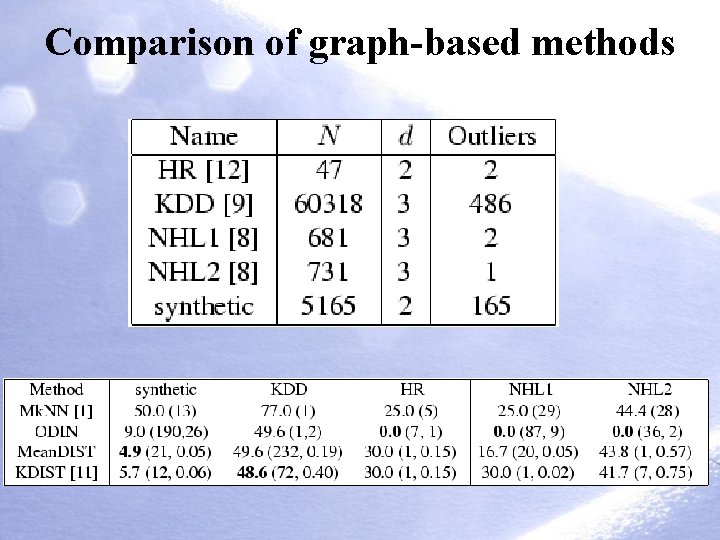
Experiments Measures • False acceptance (FA): – Number of outliers that are not detected. • False rejection (FR): – Number of good vectors wrongly classified as outlier. • Half total error rate: – HTER = (FR+FA) / 2
Comparison of graph-based methods
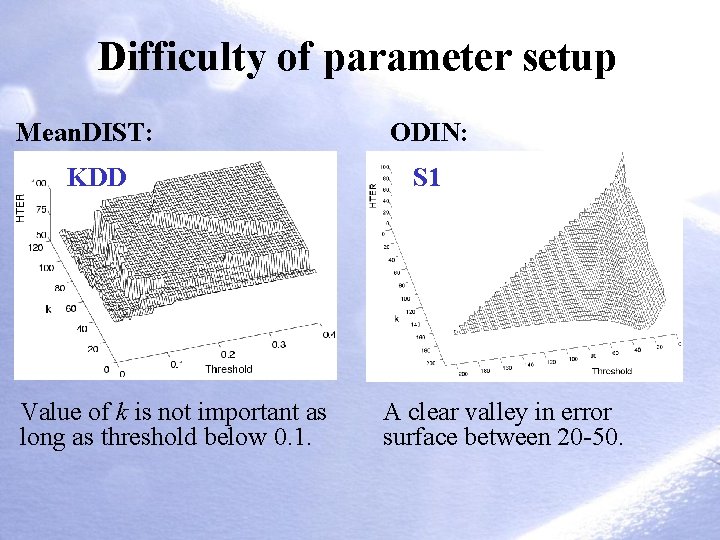
Difficulty of parameter setup Mean. DIST: KDD Value of k is not important as long as threshold below 0. 1. ODIN: S 1 A clear valley in error surface between 20 -50.
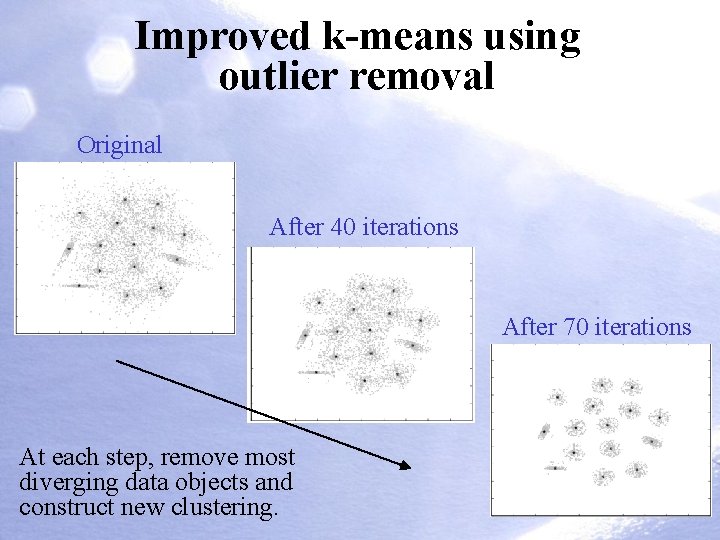
Improved k-means using outlier removal Original After 40 iterations After 70 iterations At each step, remove most diverging data objects and construct new clustering.
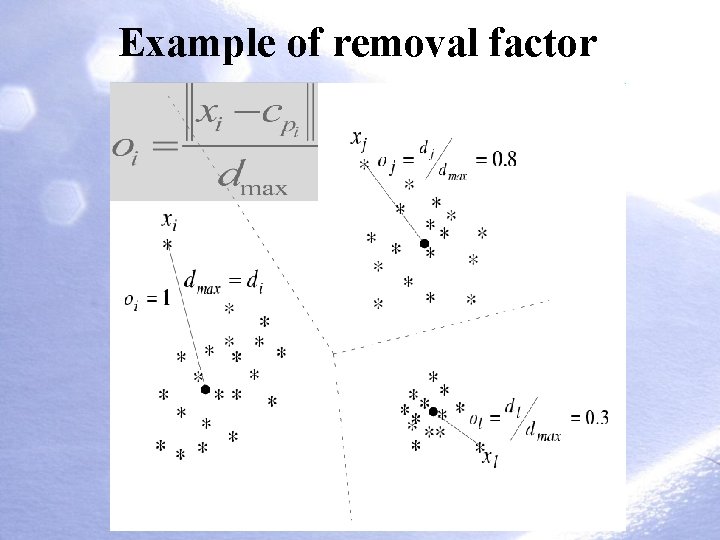
Example of removal factor Outlier factor:
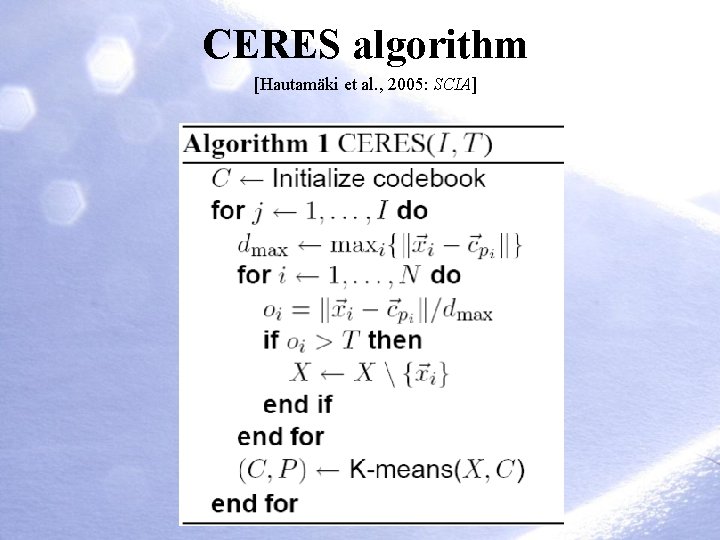
CERES algorithm [Hautamäki et al. , 2005: SCIA]
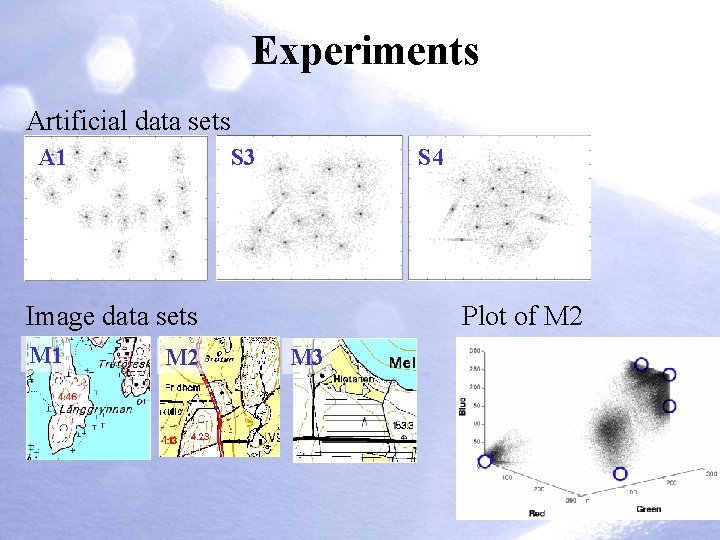
Experiments Artificial data sets A 1 S 3 S 4 Image data sets M 1 M 2 Plot of M 2 M 3
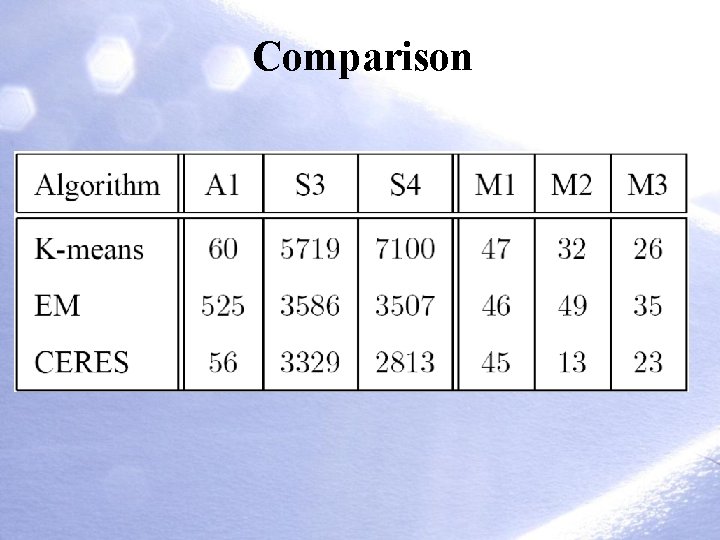
Comparison
Literature 1. D. M. Hawkins, Identification of Outliers, Chapman and Hall, London, 1980. 2. W. Jin, A. K. H. Tung, J. Han, "Finding top-n local outliers in large database", In Proc. 7 th ACM SIGKDD Int. Conf. on Knowledge Discovery and Data Mining, pp. 293 -298, 2001. 3. E. M. Knorr, R. T. Ng, "Algorithms for mining distance-based outliers in large datasets", In Proc. 24 th Int. Conf. Very Large Data Bases, pp. 392 -403, New York, USA, 1998. 4. M. R. Brito, E. L. Chavez, A. J. Quiroz, J. E. Yukich, "Connectivity of the mutual k-nearest-neighbor graph in clustering and outlier detection", Statistics & Probability Letters, 35 (1), 33 -42, 1997.
Literature 5. C. C. Aggarwal and P. S. Yu, "Outlier detection for high dimensional data", Proc. Int. Conf. on Management of data ACM SIGMOD, pp. 3746, Santa Barbara, California, United States, 2001. 6. V. Hautamäki, S. Cherednichenko, I. Kärkkäinen, T. Kinnunen and P. Fränti, Improving K-Means by Outlier Removal, In Proc. 14 th Scand. Conf. on Image Analysis (SCIA’ 2005), 978 -987, Joensuu, Finland, June, 2005. 7. V. Hautamäki, I. Kärkkäinen and P. Fränti, "Outlier Detection Using k -Nearest Neighbour Graph", In Proc. 17 th Int. Conf. on Pattern Recognition (ICPR’ 2004), 430 -433, Cambridge, UK, August, 2004.