CLR MD A New Swiss Army Knife tool





- Slides: 24

CLR MD A New Swiss Army Knife tool for Advanced Debugging Kamran Bilgrami

Agenda Production Debugging Methodology & Challenges CLR Memory Diagnostics (CLR MD) What, Why, Where, How Lots of Demos

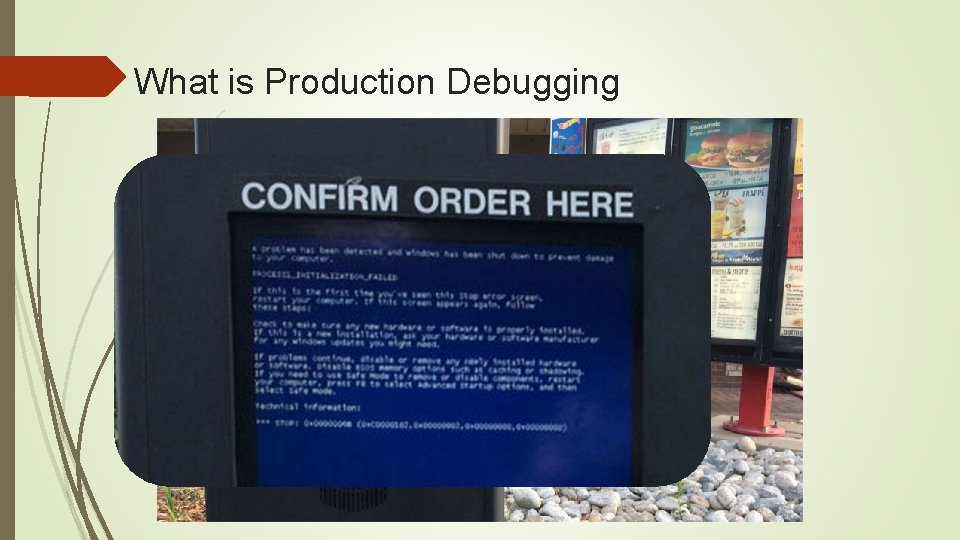
What is Production Debugging

Bugs Lifecycle

Production Debugging - Goals Find Actionable information Fast Constrained Environment Limited Access to Client DCs Can’t run intrusive tools

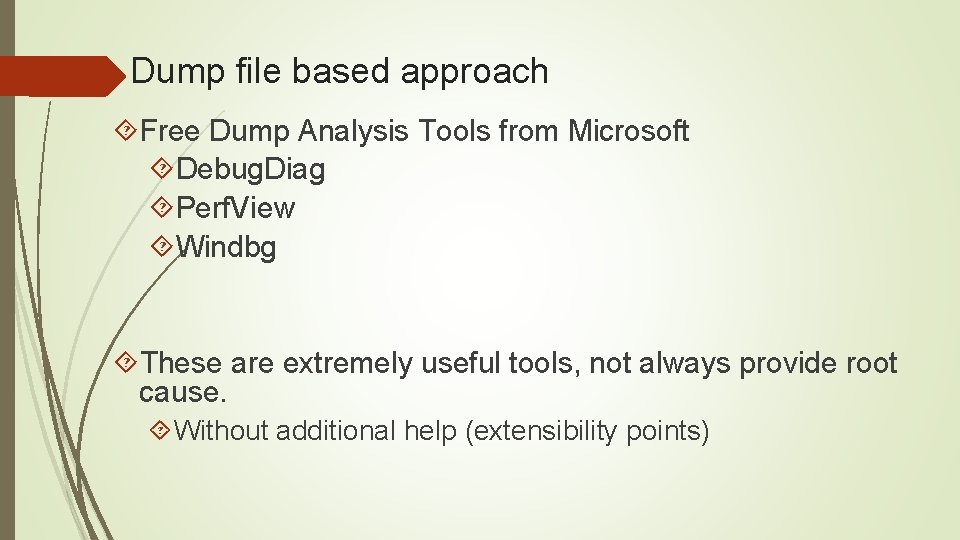
Dump file based approach Free Dump Analysis Tools from Microsoft Debug. Diag Perf. View Windbg These are extremely useful tools, not always provide root cause. Without additional help (extensibility points)

Real Life Example Extremely slow Web Portal IIS consuming High Memory Dump file collected Dump file Analysis Debug. Diag Perf. View Windbg

Where CLR MD fits in puzzle Extending existing tools Custom Analysis Rules for Debug. Diag Extension Dlls for Windbg Beyond Production Debugging Write your own tools for analysis

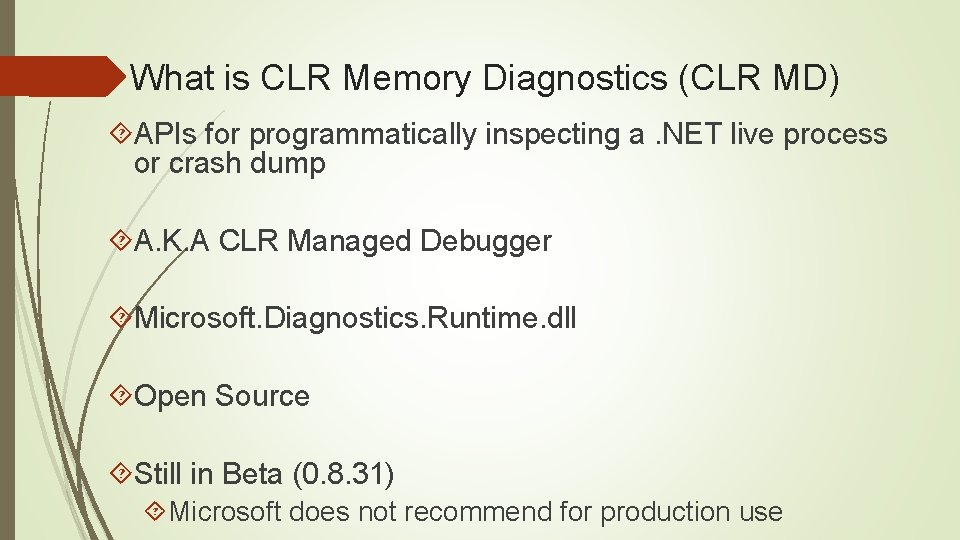
What is CLR Memory Diagnostics (CLR MD) APIs for programmatically inspecting a. NET live process or crash dump A. K. A CLR Managed Debugger Microsoft. Diagnostics. Runtime. dll Open Source Still in Beta (0. 8. 31) Microsoft does not recommend for production use

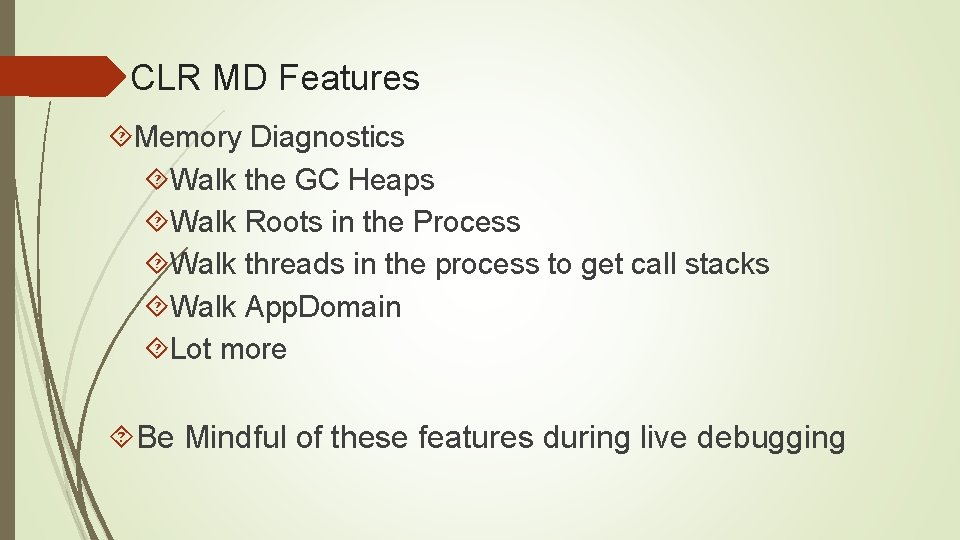
CLR MD Features Memory Diagnostics Walk the GC Heaps Walk Roots in the Process Walk threads in the process to get call stacks Walk App. Domain Lot more Be Mindful of these features during live debugging

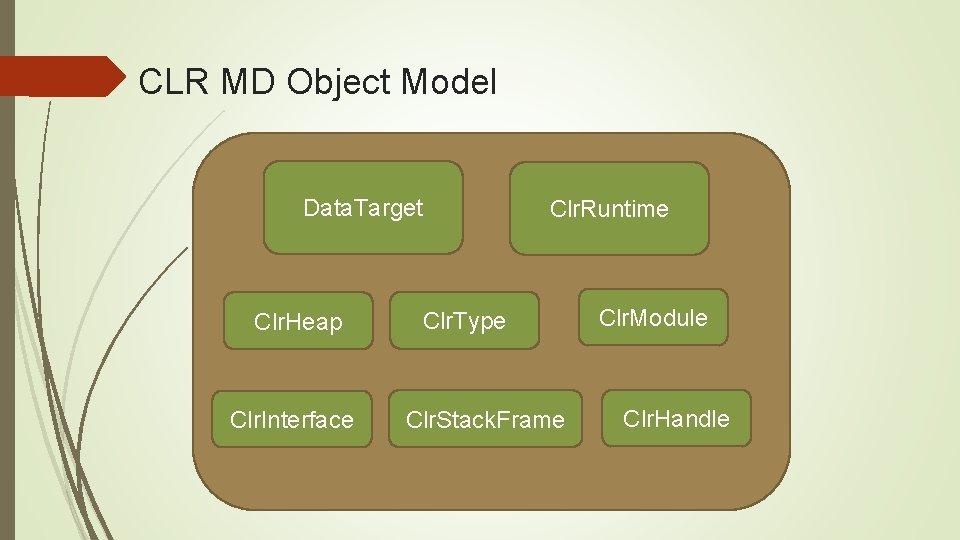
CLR MD Object Model Data. Target Clr. Heap Clr. Interface Clr. Runtime Clr. Type Clr. Stack. Frame Clr. Module Clr. Handle

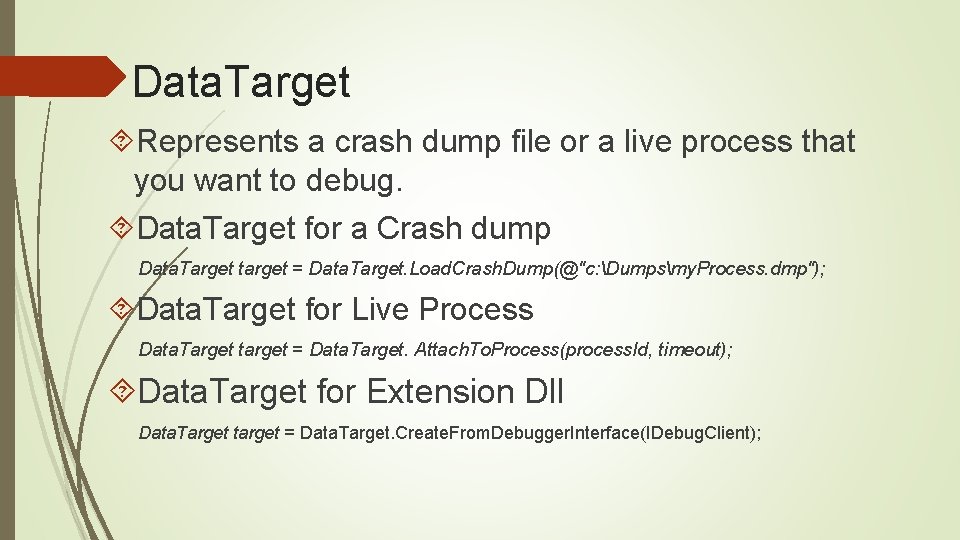
Data. Target Represents a crash dump file or a live process that you want to debug. Data. Target for a Crash dump Data. Target target = Data. Target. Load. Crash. Dump(@"c: Dumpsmy. Process. dmp"); Data. Target for Live Process Data. Target target = Data. Target. Attach. To. Process(process. Id, timeout); Data. Target for Extension Dll Data. Target target = Data. Target. Create. From. Debugger. Interface(IDebug. Client);

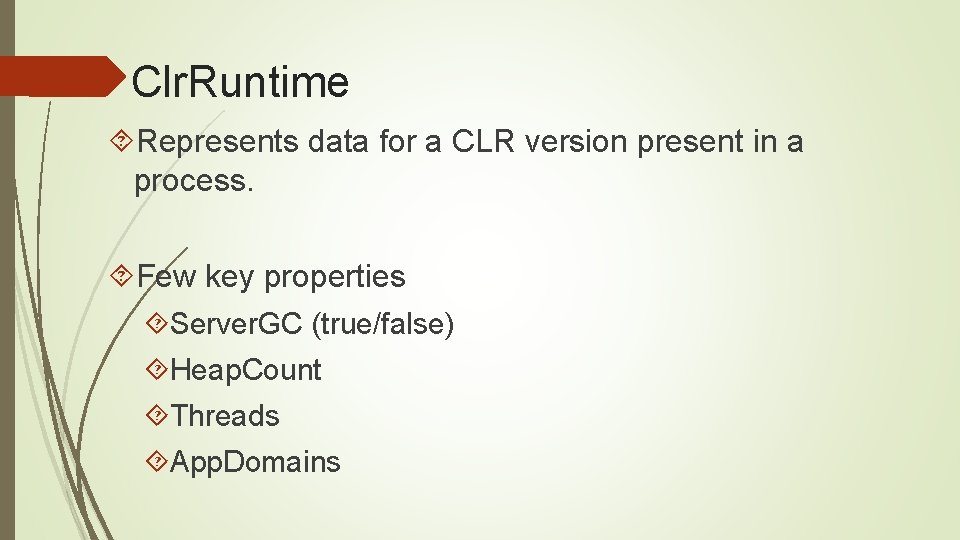
Clr. Runtime Represents data for a CLR version present in a process. Few key properties Server. GC (true/false) Heap. Count Threads App. Domains

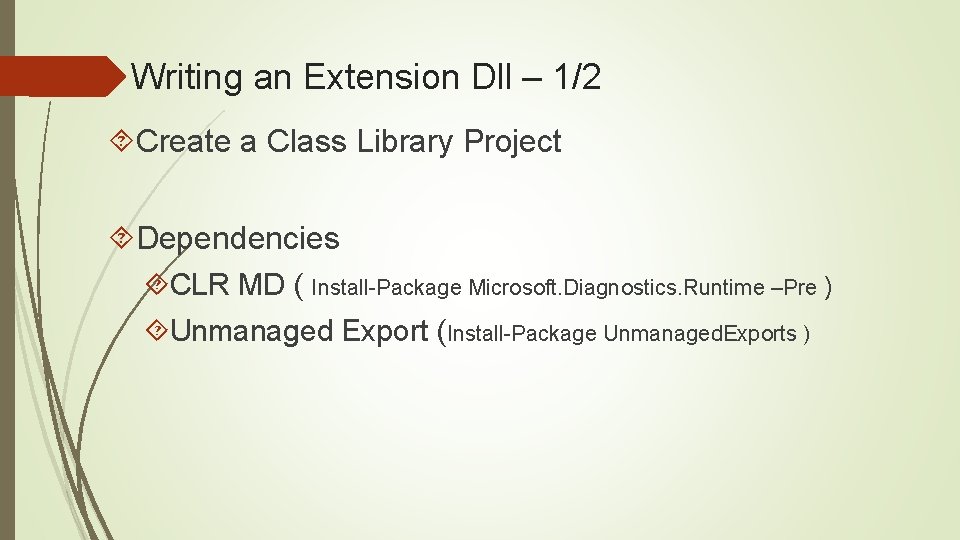
Writing an Extension Dll – 1/2 Create a Class Library Project Dependencies CLR MD ( Install-Package Microsoft. Diagnostics. Runtime –Pre ) Unmanaged Export (Install-Package Unmanaged. Exports )

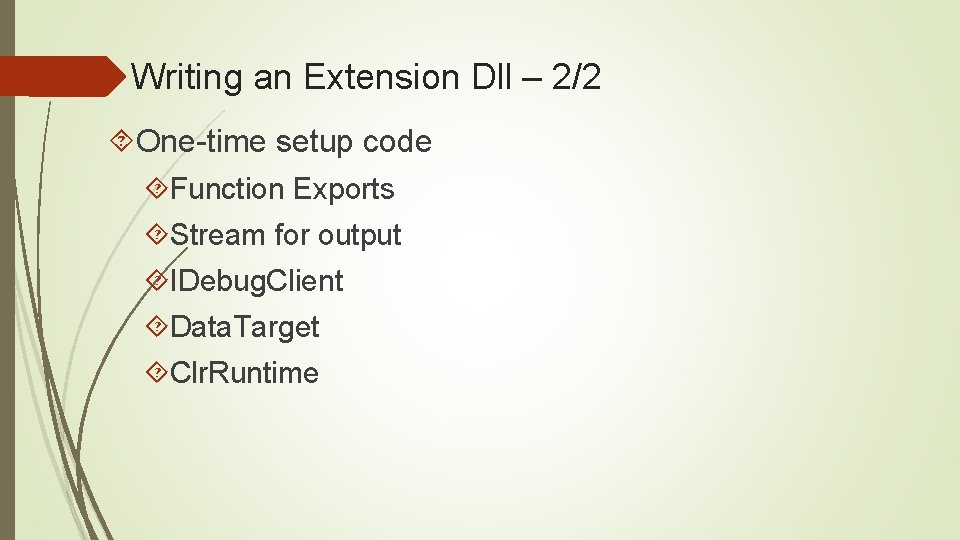
Writing an Extension Dll – 2/2 One-time setup code Function Exports Stream for output IDebug. Client Data. Target Clr. Runtime

Creating Extension dll

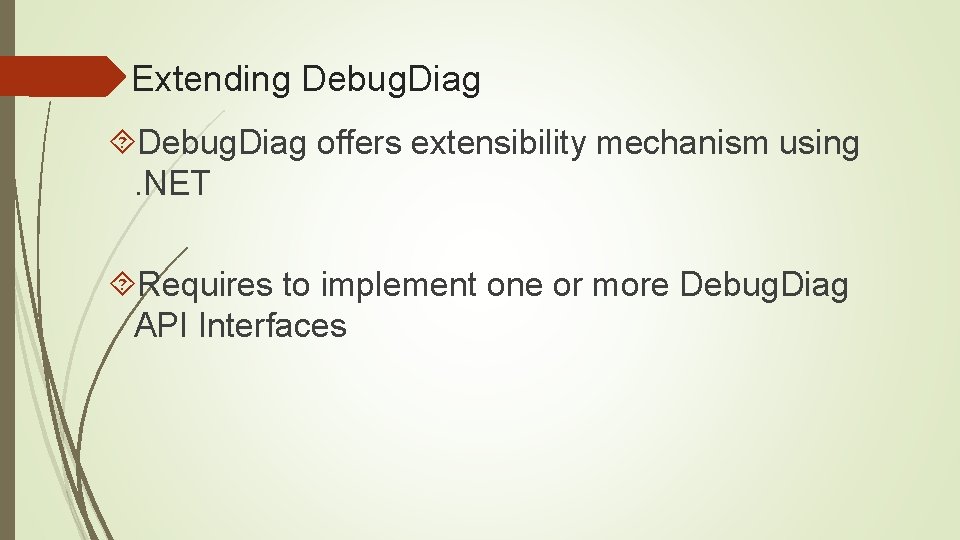
Extending Debug. Diag offers extensibility mechanism using. NET Requires to implement one or more Debug. Diag API Interfaces

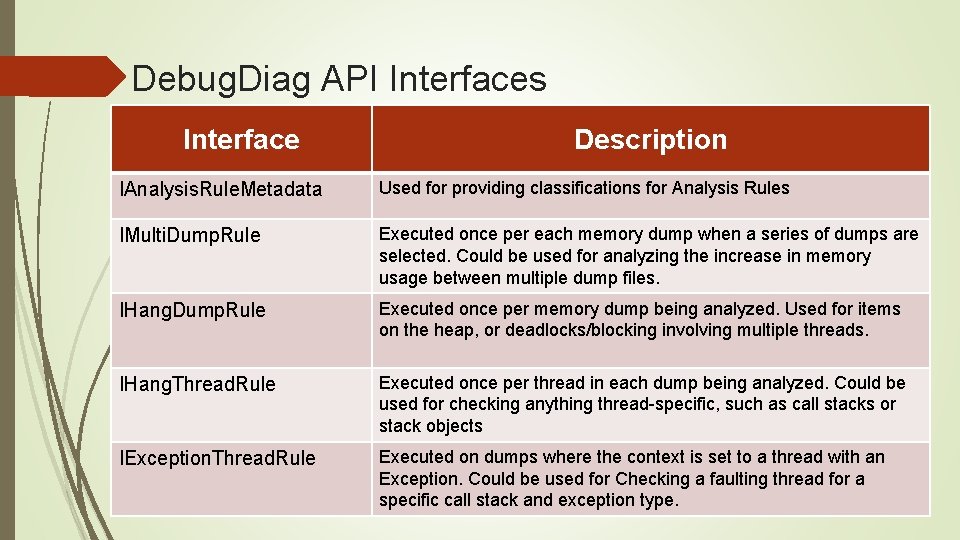
Debug. Diag API Interfaces Interface Description IAnalysis. Rule. Metadata Used for providing classifications for Analysis Rules IMulti. Dump. Rule Executed once per each memory dump when a series of dumps are selected. Could be used for analyzing the increase in memory usage between multiple dump files. IHang. Dump. Rule Executed once per memory dump being analyzed. Used for items on the heap, or deadlocks/blocking involving multiple threads. IHang. Thread. Rule Executed once per thread in each dump being analyzed. Could be used for checking anything thread-specific, such as call stacks or stack objects IException. Thread. Rule Executed on dumps where the context is set to a thread with an Exception. Could be used for Checking a faulting thread for a specific call stack and exception type.

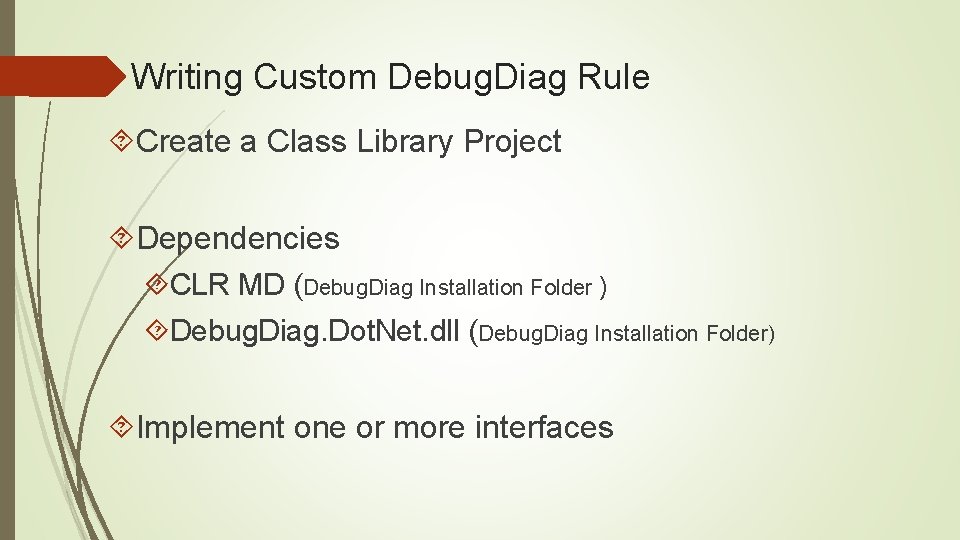
Writing Custom Debug. Diag Rule Create a Class Library Project Dependencies CLR MD (Debug. Diag Installation Folder ) Debug. Diag. Dot. Net. dll (Debug. Diag Installation Folder) Implement one or more interfaces

Custom Debug. Diag Rule

Beyond Production Debugging


Useful Links Defrag Tools – Debug. Diags Series https: //channel 9. msdn. com/Shows/Defrag-Tools-124 -Debug. Diag-Part-4 Defrag Tools – Writing CLR Debugger Extension https: //channel 9. msdn. com/Shows/Defrag-Tools-109 -Writing-a-CLR-Debugger. Extension-Part-1 My contact id: kamran@windowsdebugging. com
