
Clinical Research WenChi Chen MD Ph D Medical


- Slides: 64
Clinical Research Wen-Chi Chen, MD, Ph. D.
Medical research as part of postgraduate training l l l l Scientific interest Contribution to medical knowledge Understanding research and statistical methods Development of information technology skills Ability to critically appraise a research paper Career advancement through publication and obtaining a research degree Identify if suited to academic career
Undertaking a successful research project 1. Developing a research idea 2. Expectations 3. Realistic targets 4. Paient recruitment and data collection Good Research: a good idea with a clear hypothesis, examined using a rigorous method, undertaken under the supervision of an experienced supervisor with adequate infrastructure and an enthusiastic and dedicated researcher.
Research process l l l l Choosing a topic and a supervisor Reviewing the literature Stating the hypothesis Project outline Record keeping and note making Registering your research project Research protocol
Research process l l l l Ethical approval Funding Data collection Interpretation of data Writing the report Presenting a paper Writing a paper for publication
Basic skills for a laboratory scientist l Scientific attitude: Desire to get the bottom of things (打 破沙鍋問到底) l l l Resistant the idea of coming to the premature conclusion that things cannot be better understood or improved Willingness to “bite the bullet” to spend some time and effort to make things better and/or more efficient Not afraid of learn new things Wanting to fully understand everything including the instruments in the experiment Not willing to leave any “mysteries” or poorly understood phenomenon behind Low tolerance for “black box”
Basic skills for a laboratory scientist l Good citizenship in a laboratory l l Willingness to help and collaborate with colleagues Being a considerate colleague l l l Take assigned lab responsibilities seriously Ordering lab stocks and common supplies in time Never leave a mess in public areas Keep a clean and neat bench instead of a eye sore Clean up your bench and shelves at the end of the day Help maintain and fix instruments
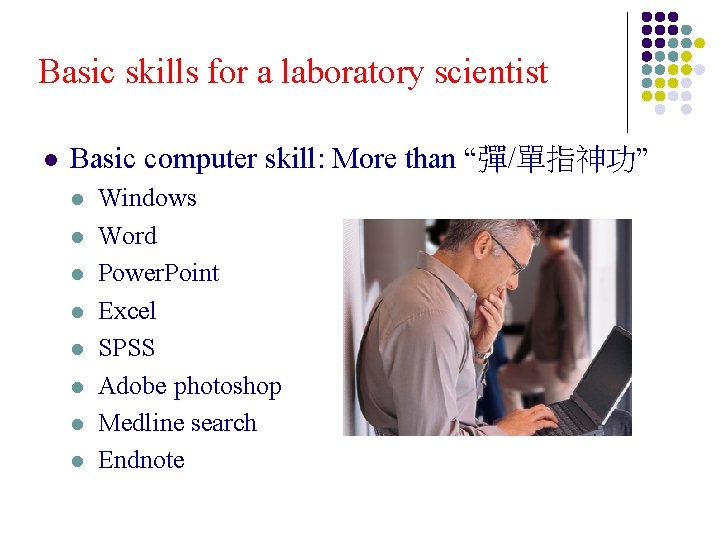
Basic skills for a laboratory scientist l Basic computer skill: More than “彈/單指神功” l l l l Windows Word Power. Point Excel SPSS Adobe photoshop Medline search Endnote
Basic skills for a laboratory scientist l Paper reading (will be introduced in another text) l l l Critically and actively Ability to recognize problems in the experimental design Ability to recognize key sentences
Basic skills for a laboratory scientist l Understanding and use of the literature l l l Ability to evaluate a paper critically and accurately Familiarity to a broad-based, relevant and current literature Ability to generate useful notes while reading the literature Ability to generate interesting and important questions Ability to generate original ideas on the literature
Basic skills for a laboratory scientist l Experimental design l l l Ability to get techniques to work predictably and reproducibly Ability to generate high quality data with both positive and negative controls that can give clear cut answer to a question Ability to find the best available information from the best sources Ability to interpret fully your data, generate next question or hypothesis and design the next experiment Ability to troubleshoot and solve a technical problem Resistance to doing an incomplete experiment using whatever reagents or cells that happen to be available ”to see what happens”
Basic skills for a laboratory scientist l Paper writing l l l Ability to group data in a logical fashion into good figures Ability to make a good-looking figure Ability to interpret data in relation to existing literature and come up with new ideas Ability to write a good and useful first draft Ability to use key sentence
Basic skills for a laboratory scientist l Productivity l l l Ability to carry out a project to completion and fruition Ability to prioritize and focus on high priority items Ability to carry out more than one project simultaneously and efficiently through detailed planning
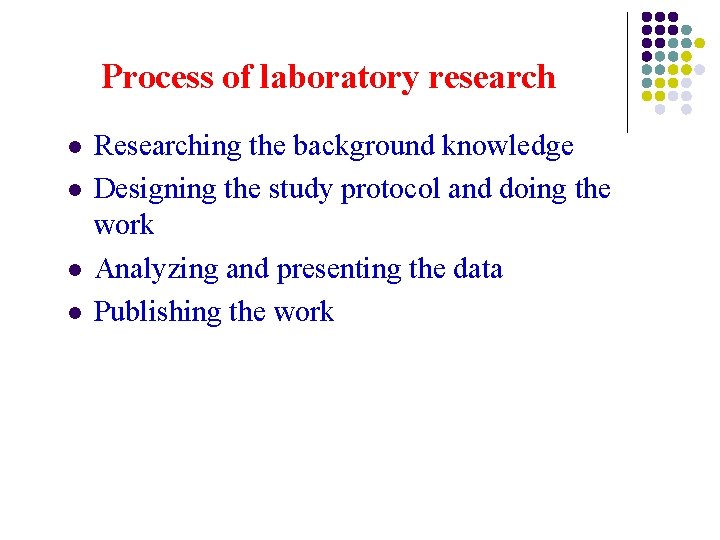
Process of laboratory research l l Researching the background knowledge Designing the study protocol and doing the work Analyzing and presenting the data Publishing the work
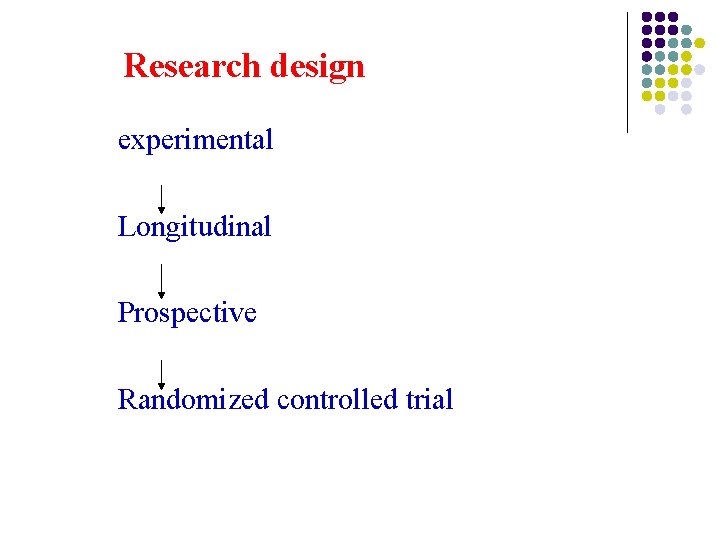
Research design experimental Longitudinal Prospective Randomized controlled trial
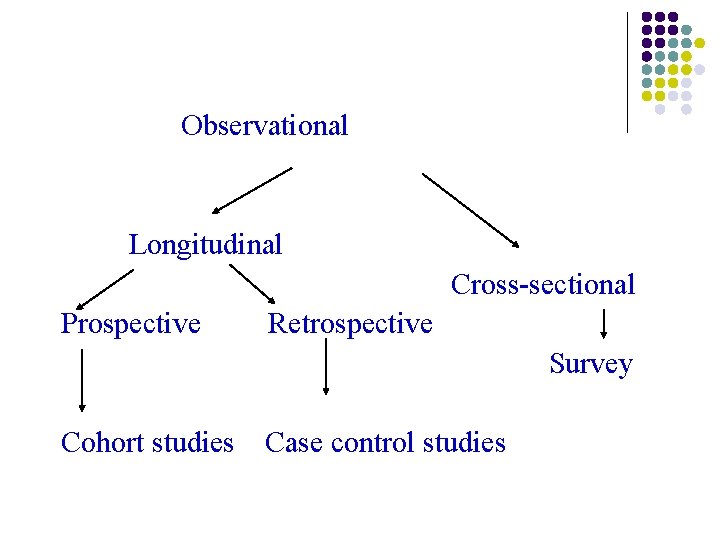
Observational Longitudinal Cross-sectional Prospective Retrospective Survey Cohort studies Case control studies
(a) Bias l l Bias is a systematic distortion of a result due to a factor not allowed for in the design of the study. For example, bias would occur if, when testing two different treatments, the two groups were given tablets that looked different; or if one group was given a tablet and the control group was not given a tablet. The two groups of patients are managed differently and it is possible these differences might influence the trial results. Hawthorne effect: the presence of the researcher affects the behavior of the subjects
(a) Bias l A fundamental flow in design might confound a trial, invalidation the results. For example, if the investigator, when studying the incidence of upper respiratory tract infections (URI) in doctors and ancillary staff in a hospital, failed to take into account their smoking histories. It is likely that there would be a significant difference in this regard between the two groups. Therefore, it becomes impossible to distinguish the effects of occupation from the effects of smoking on the incidence of URI.
(b) Types of control groups l l A no-treatment-group study is likely to be confounded because of the placebo effect in the treatment group, even if the treatment is inactive. Placebo: the control group receives an insert, dummy treatment which is indistinguishable from the treatment under study.
(b) Types of control groups l l l A low-dose group: for the situation when a placebo group can not be used because of ethical issues. A group treated with a standard current therapy. ‘Gold Standard’ treatment group receiving the best current therapy.
(b) Types of control groups l Historical controls, where the treatment group is compared with results obtained in previous ‘similar’ patients, are unreliable. The controls may well be significantly different than the current treatment group. The results will be different.
(a) Random allocation to groups l Randomization is used to ensure that the allocation of the patients to the groups is independent of the characteristics of the patient. All patients have the same chance of being assigned to either intervention.
l If patients were allocated to groups by the investigator, it is impossible to exclude the possibility that, albeit unconsciously, the allocation is affected by patient factors that may influence the trial outcome, e. g. low-risk patients may be allocated to the treatment group. Randomization removes any chance of allocation bias.
l It is highly desirable that the treatment and control groups are similar with regard to factors that might affect outcome. Randomization, however, does not guarantee that this will be the case, although it does guarantee that differences will only occur by chance. For instance, there may be more females in one group than in the other, or the average weight of patients in the groups may be significantly different.
l Stratified randomization should therefore be used for factors that are believed to significantly influence the outcome.
(b) Methods of blindness l Double-blind means that neither the patients nor the investigator is aware of the treatment. This is the most desirable methods to prevent assessment and response biases. However, in several fields, such as surgery, it may be impossible to run a double-blind study.
l In a single-blind trial, only the patient is unaware of the treatment. l In a triple-blind trial, patient, investigator and also the datamonitoring body are unaware of the treatment group.
The double dummy technique is used for drug trials comparing two active treatment, e. g. each patient receives one of the active tablets and a dummy tablet that looks like the alternative active tablet. l In open trials, the investigators and patients know what treatment each patient is getting. l
Case-control study l l Definition The retrospective case-control study starts with the identification of a group of individuals with the disease or condition of interest (cases) and a group of individuals without the disease (controls).
The two groups are then compared with respect to their previous exposure to the risk factor or factors. l A greater degree of exposure in the cases than in the controls suggests that factor might be causally related to the disease. l
Potential biases l l (a) Recall bias (b) Unreliable memories (c) Unreliable records (d) Interview bias
Cohort study l l Definition The prospective cohort study starts with the identify and examination of a group of subjects (the cohort) who are then followed up over a period of time looking for the development of a disease or other specified end-point.
Potential biases Subjects may be lost to follow-up during a long cohort study. This may lead to bias if the reason for loss of contact is related to the risk factors or the outcomes. l A large loss to follow-up may significantly affect the validity of the results. l
l l l Exposed subjects may reduce, while other subjects might increase, their exposure to the risk factors, e. g. by giving up or starting smoking. A change of occupation may reduce or increase exposure to, for example, asbestos. If the investigators are aware of the subject’s group they may investigate exposed subjects more closely, so the ‘surveillance bias’ occurs.
Cross-sectional study Methods l l In a cross-sectional study all subjects are contacted or surveyed just once and at about the same time, usually by means of a questionnaire. The subjects may be a random sample of a defined population such as general practitioners or patients presenting with arthritis, etc.
Potential biases l l Non-response in cross-sectional surveys can be a major problem. There are likely to be important differences between the people respond to surveys and the people who do not respond (volunteer bias), which may have a major impact on the results of the study. For example, responders may be healthier or older or more altruistic-minded or females. Hence the subjects responding to a survey may not be possible to extrapolate the results to the population under review.
Protocol of a clinical trial 1. Definition 2. Importance 3. Format (a) Title page (b) background and hypothesis (c) Study design (d) Materials and methodology (e) Data collection and handling (f) Statistical analysis (g) References (h) Summary
Methodology 1. Ethical approval and informed consent. 2. Inclusion and exclusion criteria. 3. Evalution and endpoint measurements. 4. Protocol deviations.
Drug development studies: Phase I-IV Phase I studies: are usually carried out in 25 -50 healthy volunteers. Phase II studies: are usually carried out in 100 -200 patients with disease who might benefit from the drug.
Phase III studies: are the formal clinical trials that assess the effectiveness and safety of the agent in several thousand patients. Phase IV studies: are carried out in the general population after the new drug has been approved.
Statistical considerations 1. Sample size 2. Interim analyses ( -adjustment, Bonferroni-adjustment) 3. Intention to treat analysis (protocol violation)
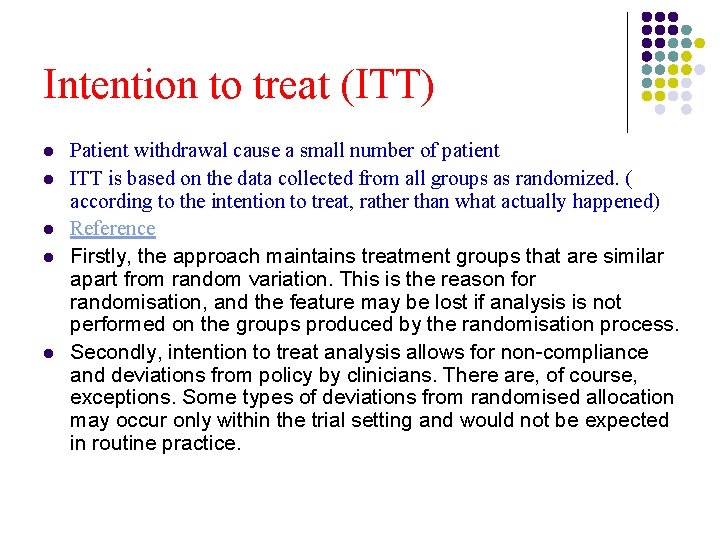
Intention to treat (ITT) l l l Patient withdrawal cause a small number of patient ITT is based on the data collected from all groups as randomized. ( according to the intention to treat, rather than what actually happened) Reference Firstly, the approach maintains treatment groups that are similar apart from random variation. This is the reason for randomisation, and the feature may be lost if analysis is not performed on the groups produced by the randomisation process. Secondly, intention to treat analysis allows for non compliance and deviations from policy by clinicians. There are, of course, exceptions. Some types of deviations from randomised allocation may occur only within the trial setting and would not be expected in routine practice.
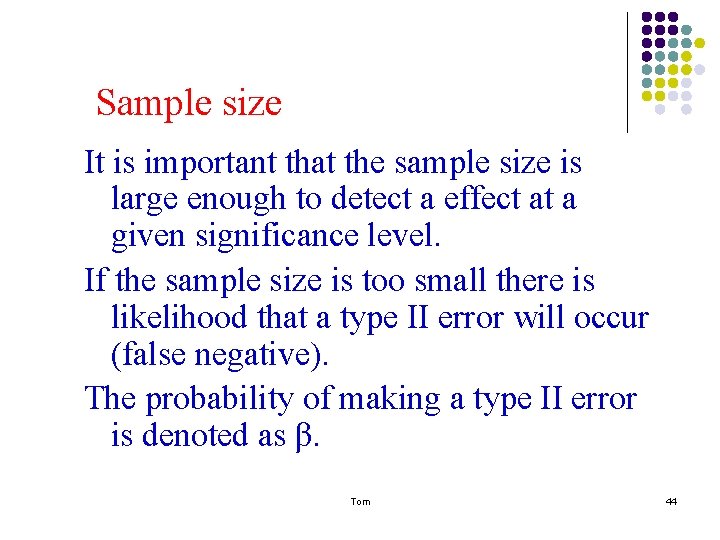
Sample size It is important that the sample size is large enough to detect a effect at a given significance level. If the sample size is too small there is likelihood that a type II error will occur (false negative). The probability of making a type II error is denoted as β. Tom 44
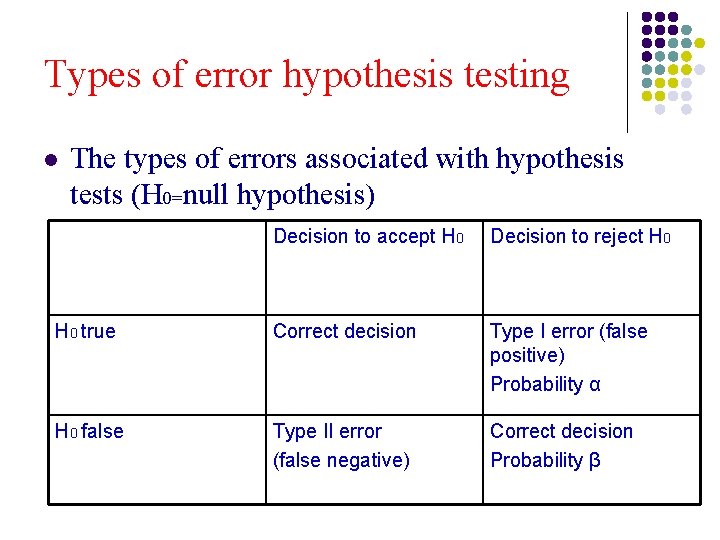
Types of error hypothesis testing l The types of errors associated with hypothesis tests (H 0=null hypothesis) Decision to accept H 0 Decision to reject H 0 true Correct decision Type I error (false positive) Probability α H 0 false Type II error (false negative) Correct decision Probability β
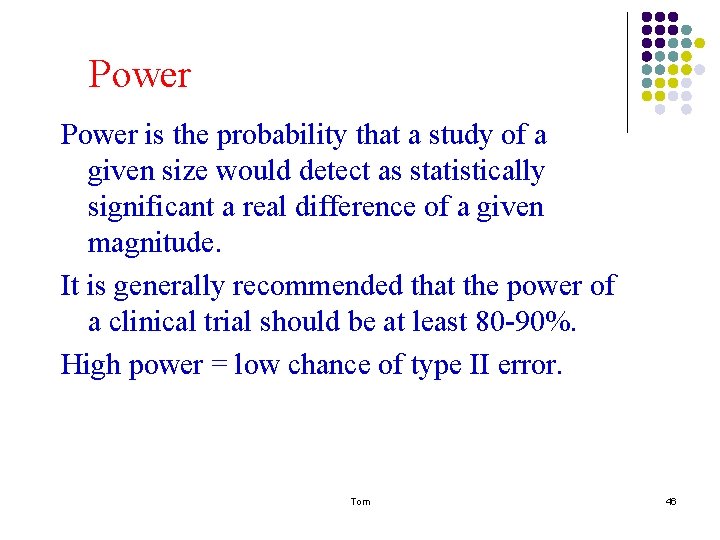
Power is the probability that a study of a given size would detect as statistically significant a real difference of a given magnitude. It is generally recommended that the power of a clinical trial should be at least 80 -90%. High power = low chance of type II error. Tom 46
Power is the probability that a study of a given size would detect as statistically significant a real difference of a given magnitude. l It is general recommended that power of a clinical trials should be at least 80 -90%. l
l l A high power means that is a high chance of detecting a significant difference, if there is one, and a low chance of making a type II error. Since the probability of not detecting a real difference between study groups is β(i. e. the probability of a type II error), the probability of detecting a real difference (the power) is 1 -β.
Type I error Occurs if the null hypothesis is rejected. l False positive l The probability of making a type I error is denoted as l
Type II error A type II error occurs if the null hypothesis is accepted, i. e. an insignificant result is obtained, when the null hypothesis is in fact not true. The probability of making a type II error is denoted as β. Tom 50
Hypothesized difference and sample size If the difference between two treatments is large then relatively small samples are likely to produce a significant result. If the difference between treatment is small then much larger numbers are required. Investigators needs to define the minimum difference between the groups that he is going to consider clinically relevant. Tom 51
Responsibility for research 1. Ethics committee approval. 2. Department of Research and Development. 3. Legal liability. 4. Confidentiality
Data collection: type of data l l Variable: a quantity which during an investigation or experiment is assumed to vary or be capable of varying in value. Data are the values taken by a variable. Qualitative data: Nominal and ordinal Quantitative data: discrete data (e. g. the number of children in the family), continuous data (age, body weight)
Causes of measurement error 1. Observer error (a) Inter-observer inaccuracies (b) Digit preference (c) Question variation
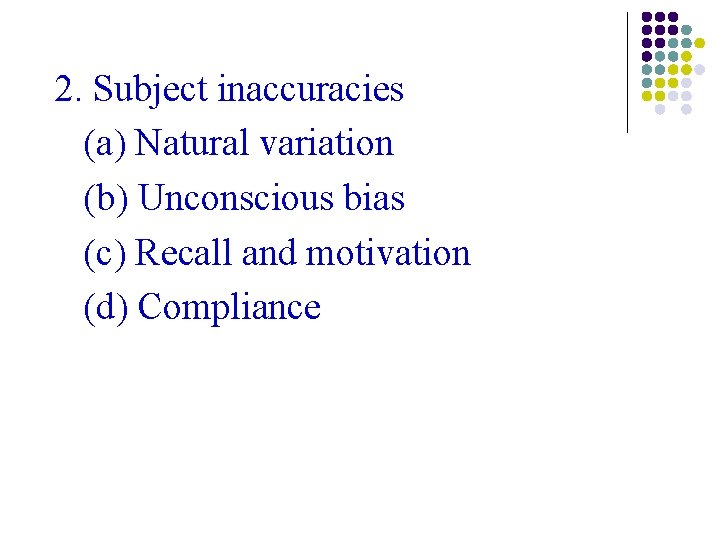
2. Subject inaccuracies (a) Natural variation (b) Unconscious bias (c) Recall and motivation (d) Compliance
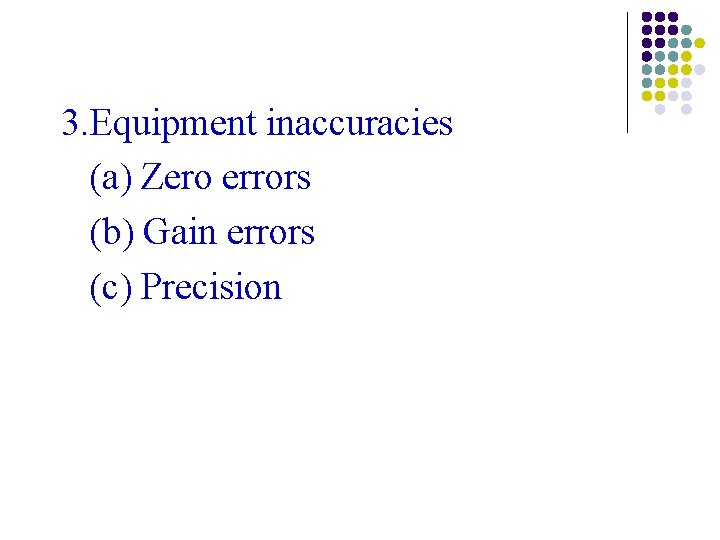
3. Equipment inaccuracies (a) Zero errors (b) Gain errors (c) Precision
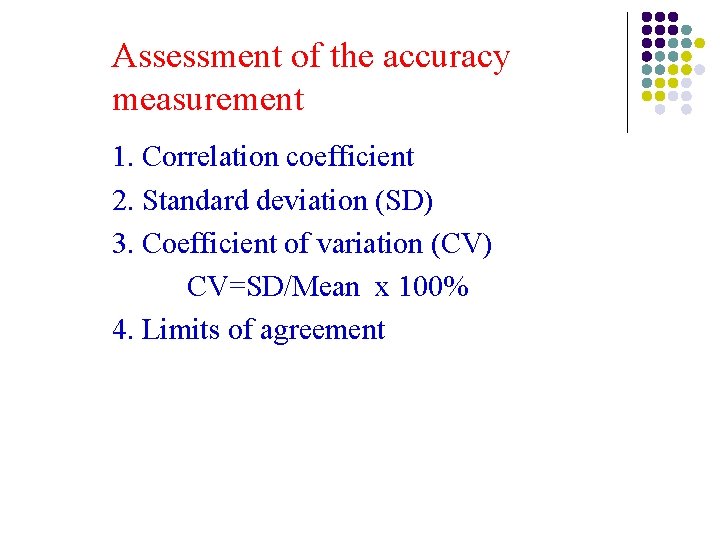
Assessment of the accuracy measurement 1. Correlation coefficient 2. Standard deviation (SD) 3. Coefficient of variation (CV) CV=SD/Mean x 100% 4. Limits of agreement
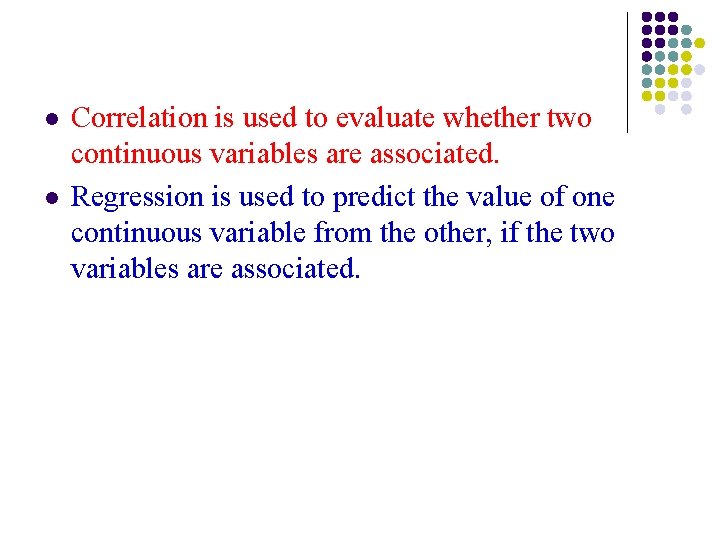
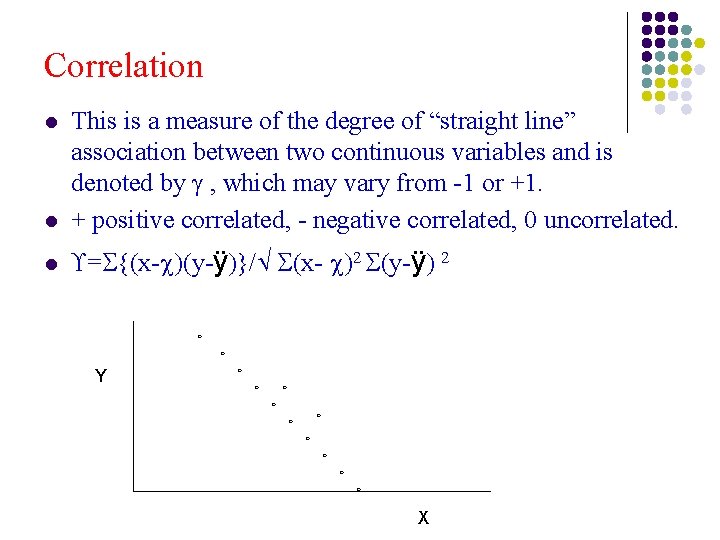
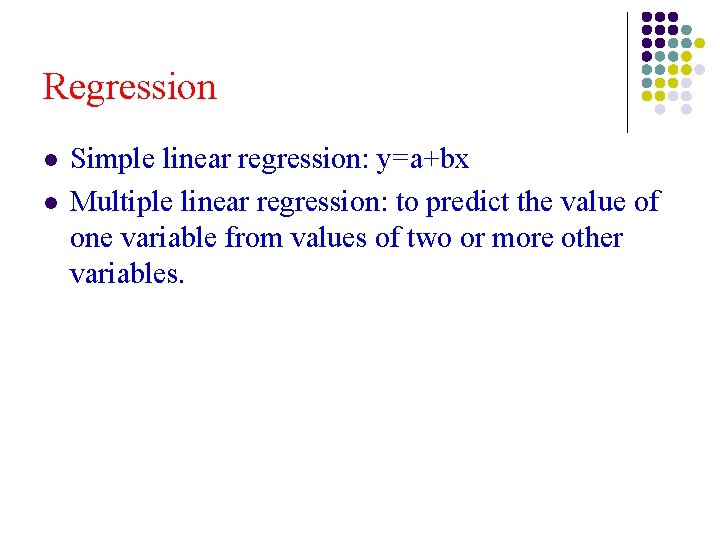
l l Correlation is used to evaluate whether two continuous variables are associated. Regression is used to predict the value of one continuous variable from the other, if the two variables are associated.
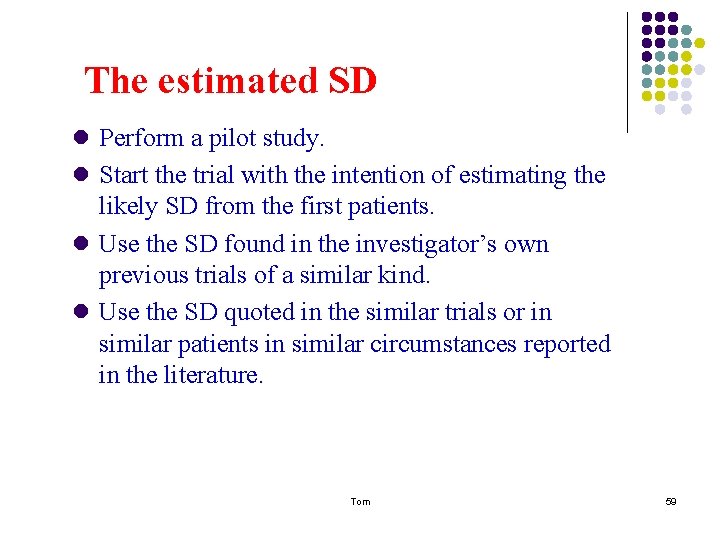
The estimated SD l Perform a pilot study. l Start the trial with the intention of estimating the likely SD from the first patients. l Use the SD found in the investigator’s own previous trials of a similar kind. l Use the SD quoted in the similar trials or in similar patients in similar circumstances reported in the literature. Tom 59
Correlation l This is a measure of the degree of “straight line” association between two continuous variables and is denoted by , which may vary from -1 or +1. + positive correlated, - negative correlated, 0 uncorrelated. l = {(x- )(y-ÿ)}/ (x- )2 (y-ÿ) 2 l 。 Y 。 。 。 X
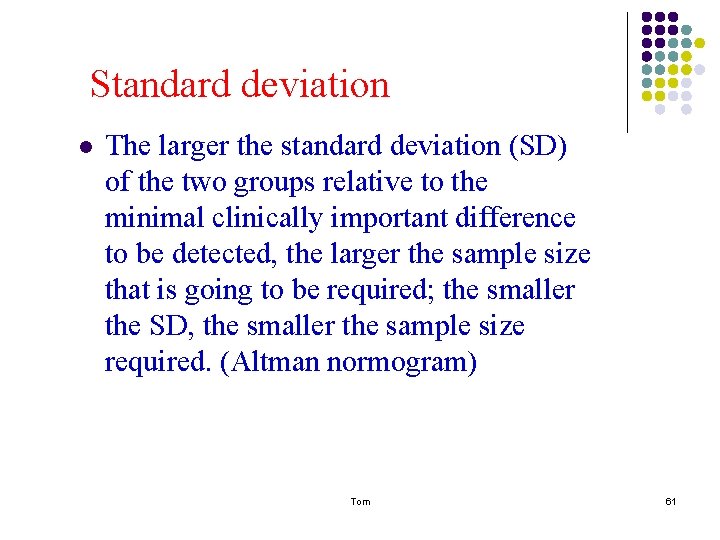
Standard deviation l The larger the standard deviation (SD) of the two groups relative to the minimal clinically important difference to be detected, the larger the sample size that is going to be required; the smaller the SD, the smaller the sample size required. (Altman normogram) Tom 61
Regression l l Simple linear regression: y=a+bx Multiple linear regression: to predict the value of one variable from values of two or more other variables.
References l l l l Smith FG, Smith JE: Clinical Research. Bios Scientific. 2003 呂宗學譯;臨床流行病學精要。第三版,九州圖書文物,2000 Mc. Govern DPB, Valori RM, Summerskill WSM, Levi M: Key topics in evidenced-base medicine. Bios Scientific. 2001 Spilker B: Guide to clinical trials. New York, Raven Press, 1991. Sun TT, Huang PC: Scientific methods: Survival skills for young investigatorws in biomedical research. Taipei, NHRI Pul. 2004 程樹德譯:研究科學的第一步—給年輕探索者的建議。 Day RA: How to write and publish a scientific paper. 2 nd edi. Philadelphia, Isi press, 1990.