Clinical hemodynamic correlation in mitral stenosis Grading of

 >1. 5 1.")


/length of diastole(mm) • Mean gradient=average gr * scale •")


 • Restriction of")
- Slides: 81
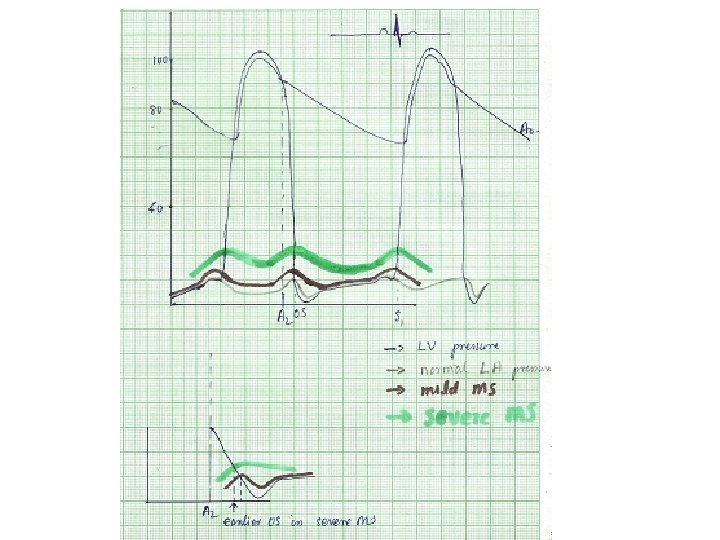
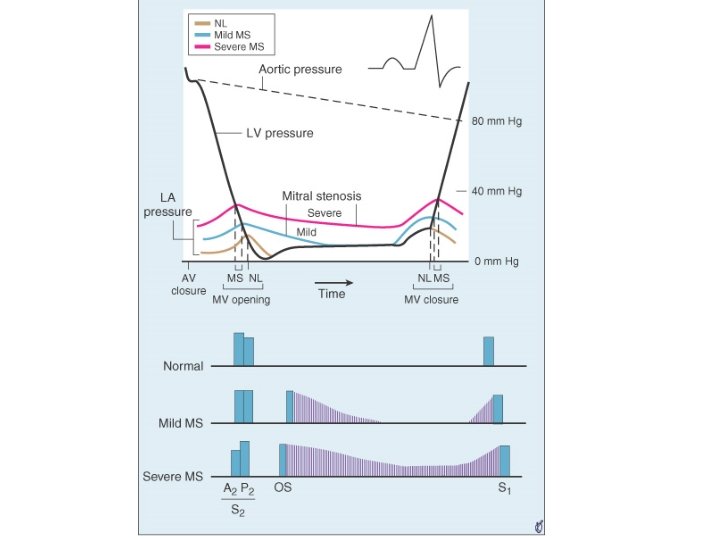
Clinical hemodynamic correlation in mitral stenosis
Grading of severity in MS parameter mild moderate severe MVA(cm 2) >1. 5 1. 0 -1. 5 <1. 5 Mean gradient (mm. Hg) <5 5 -10 >10 PASP(mm. Hg) <30 30 -50 >50
• Normal CSA of mitral valve – 4 to 5 cm 2 • No significant gradient across normal mitral valve during diastolic flow • Progressive narrowing of mitral orifice results in – Pressure gradient b/w LA and LV • Left ventricular end diastolic pressure remaining at 5 mm Hg, LA mean pressure rises gradually • Reaches around 25 mm. Hg when MVA around 1 cm 2 – Reduction of blood flow across mitral valve • COP 3. 0 L/min /m 2 falls to around 2. 5 L/min /m 2 at MVA 1 cm 2 • Dependence of LV filling on LA pressure • Elevation of LA mean pressure-pulmonary venous hypertension
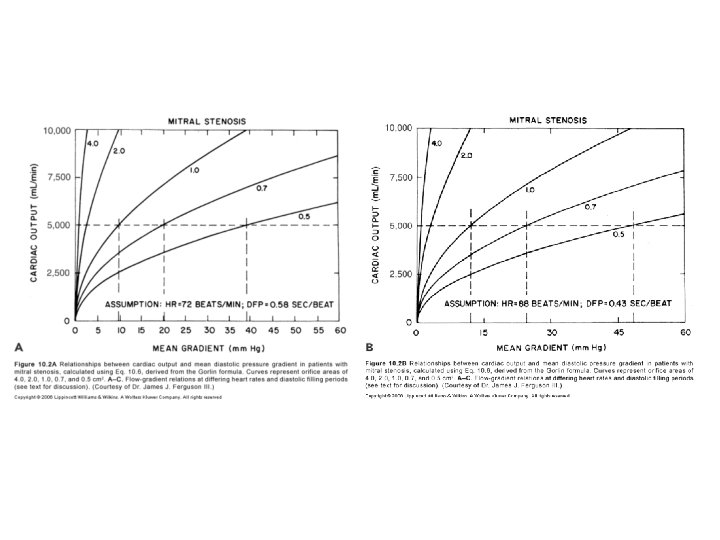
Factors affecting transmitral gradient • √mean grad∞ COP/DFP*MVA • Factors ↑ grad – ↑ COP • Exertion , emotion, high output states – ↓ DFP • Increase HR – ↓ MVA • Progression of disease • thrombus
• Factors decreasing gradient – ↓ COP • Second stenosis • RV failure – ↑ DFP • Slow HR – ↑ MVA
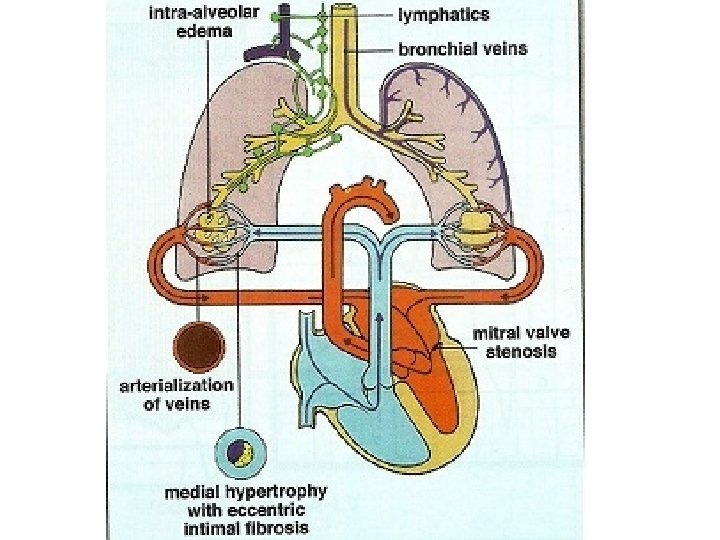
• ↑pul venous pressure – Transudation of fluid into interstitium • Initially lymphatic drainage increases to drain excess fluid-fails as venous pressure increases • Transudate decrease lung compliance-increase work of breathing • Bronchospasm, Alveolar hypoxia, vasoconstriction • Symptoms-dyspnoea, orthopnoea, PND
a/c pulmonary edema • PCWP exceeds tissue oncotic pressure of 25 mm. Hg&lymphatics unable to decompress the transudate • Gradual in a tight MS or abrupt appearance in a moderate to severe MS a/w ↑HR or ↑ transvalvular flow – Onset of AF – tachycardia – Fluid overload – Pregnancy – High output states
Hemoptysis • Pulmonary apoplexy – Sudden, profuse, bright red – Sudden increase in pulmonary venous pressure&rupture of bronchial vein collaterals • • Pink frothy sputum of pulmonary edema Blood stained sputum of PND Blood streaked sputum a/w bronchitis Pulmonary infarction
Winter bronchitis • Pulmonary venous hypertension-c/c passive congestion of lung-bronchial hyperemia • Hypersecretion of seromucinous glands – excessive mucus production • Symptoms of bronchitis
• Effects of c/c elevation of pul venous pressure – Increase in lymphatic drainage – Engorged systemic bronchial veins – Pulmonary arterial hypertension
Pulmonary HTN • Devt of pulmonary hypertension – Passive – Active – Organic obliterative changes • Passive pulmonary HTN – Obligatory increase in response to ↑PCWP to maintain gradient of 10 to 12 across pul vasc bed(PA mean-LA mean) • Active pulmonary HTN – PA mean pressure –LA mean pressure >10 to 12
Cause of reactive pul HTN • Wood-pulmonary vasoconstriction • Doyle-↑pul venous pressure prominent in the lower lobes, produce reflex arterial constriction • Heath &Harris-↑ PA pressure causes reflex arteriolar constriction
• Jordan– ↑pul venous pressure-transudation of fluid – causes thickening and fibrosis of alveolar walls – hypoventilation of lower lobes-hypoxemia in lower lobe vessels – Sensed by chemoreceptors in pulmonary veins – Pulmonary arteriolar vasoconstriction in regions supplying these alveoli – Lower lobe perfusion decreases – This process eventually involve middle and upper lobe
• Anatomical changes in the pulmonary arterioles – Medial hypertrophy – Intimal proliferation – Fibrosis • Decrease in CSA of pulmonary vascular bed • Increase PVR
Sequlae of reactive pul HTN • RV hypertrophy • Functional TR • RV failure
The second stenosis
Symptoms and hemodynamic correlation • Precapillary block – Low cardiac output – Right ventricular hypertrophy – RV dysfunction • Postcapillary block – Left sided failure
Four hemodynamic stages
• Stage 1 – Asymptomatic at rest • Stage 2 – Symptomatic due to elevated LA pressure – Normal pulmonary vasc resistance • Stage 3 – Increased pulmonary vascular resistance – Relatively asymptomatic OR symptoms of low COP • Stage 4 – Both stenoses severe – Extreme elevation of PVR-RV failure
• Elevated precapillary resistance protects against devt of pulmonary congestion at cost of a reduced COP • Severe pulmonary HTN leads to right sided failure
• Exercise hemodynamics-2 types of response – Normal COP&high transvalvular gradientsymptomatic due to pulmonary congestion – Reduced COP &low gradient-symptoms of low COP • Severe MS-combination of low output and pulmonary congestion symptoms
Role of LA compliance • Non compliant LA – Severe elevation of LA pressure and congestive symptoms • Dilated compliant LA – Decompress LA pressure • PHT =11. 6*Cn*√ MPG/(Cc*MVA) – Cn-net compliance – Thomas JD (circulation 1988) • Post BMV – Reduction of LV compliance <improvement in LA compliance – Net compliance increases-overestimate PHT – MVA underestimated
Impact of AF in MS • ↑HR, ↓DFP-elevates transmitral gradient • Loss of atrial contribution to LV filling – Normal contribution of LA contraction to LV filling 15% – In MS, increases upto 25 -30% – Lost in AF • Loss of A wave in M-mode echo and in LA pressure tracing
Physical findings and correlation • Pulse-normal or low volume in ↓ COP • JVP– mean elevated in RV failure – prominent a wave in PAH in SR – Absent a wave in AF • Palpation – Apical impulse • Inconspicous LV • Tapping S 1 • RV apex in exreme RVH – LPH in RVH – Palpable P 2
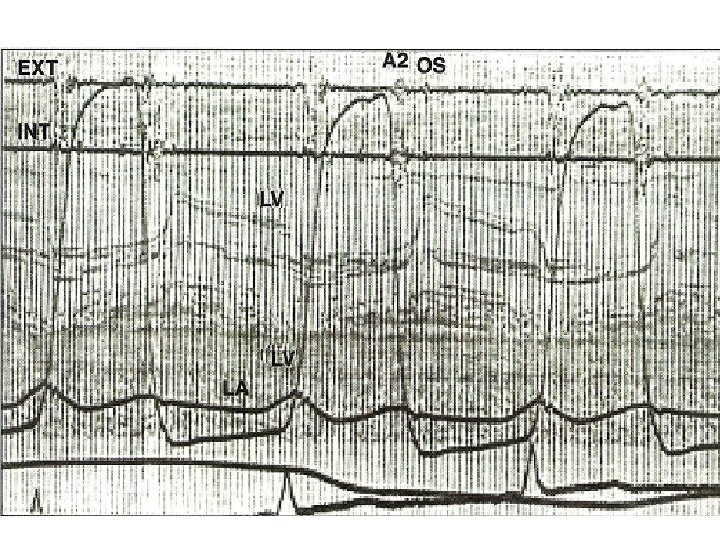
• Loud S 1 – Mitral valve closes at a higher Dp/dt of LV • In MS closure of mitral valve is late due to elevated LA pressure • LA –LV pressure crossover occurs after LV pressure has begun to rise • Rapidity of pressure rise in LV contributes to closing of MV to produce a loud S 1 – Wide closing excursion of leaflets • Persistent LA-LV gradient in late diastole keeps valve open and at a lower position into late diastole • Increased distance that traversed during closing motion contributes to loud S 1 – Quality of valve tissue may affect amplitude of sound • The diseased MV apparatus may resonate with a higher amplitude than normal tissue
• Soft S 1 &decreased intensity of OS in severe MS – MV Calcification especially AML – Severe PAH-reduced COP – CCF-reduced COP – Large RV – AS-reduced LV compliance – AR – Predominant MR – LV dysfunction
Q-S 1 interval • Prolongation of Q-S 1 interval – As LA pressure rises, LA-LV pressure crossover occurs later – Well’s index • Q-S 1 interval-A 2 OS interval expressed in units of 0. 01 sec • >2 unit correlate with MVA <1. 2 cm 2
• S 2 – Loud P 2 – Narrow split as PAH increases • Reduced compliance and earlier closure of pulmonary valve • RVS 4 • LVS 3 rules out significant MS
A 2 -OS interval • OS- – Sudden tensing of valve leaflets after the valve cusps have completed their opening excursion – Movement of mitral dome into LV suddenly stops – Follows LA LV pressure crossover in early diastole by 20 -40 ms • A 2 OS interval ranges from 40 -120 ms • As LA pressure rises, the crossover of LA and LV pressure occurs earlier –MV opening motion begins earlier- A 2 OS interval shortens • Narrow A 2 OS interval <80 ms-severe MS
• Short A 2 OS interval – Severe MS – Tachycardia – Associated MR-Higher LA pressure –MV open earlier • Long A 2 -OS interval in severe MS – Factors that affect MV opening –AR, MV calcification – Factors that decrease LV compliance-AS, syst HTN, old age – Decreased rate of pressure decline in LV during IVRT as in LV dysfunction – Due to low LA pressure in a large compliant LA • In AF-shorter cycle length-LA pressure remains elevated-A 2 OS narrows
Diastolic murmur of MS • Two components– early diastolic component that begins with the opening snap, when isovolumic LV pressure falls below LA pressure – Late diastolic component • Increase in LA-LV pressure gradient due to atrial systole • Persistence of LA-LV gradient upto late diastole in severe MS – closing excursion of mitral valve produces a decreasing orifice area – velocity of flow increases as valve orifice narrows – this cause turbulence to produce presystolic murmur
• Duration of murmur correlates with severity • Murmur persists as long as transmitral gradient>3 mm. Hg • Mild MS– murmur in early diastole – or in presystole with crescendo pattern – or both murmurs present with a gap b/w components • Moderate to severe MS– murmur starts with OS and persists upto S 1
Presystolic accentuation of murmur • Atrial contraction in patients in sinus rhythm • Reduction in mitral valve orifice by LV contraction – Increase velocity of flow as long as there is a pressure gradient LA-LV – Persistence of presystolic accentuation in AF in severe MS
Factors that decrease intensity of diastolic murmur of MS • Low flow states – Severe MS – Severe PAH – CCF – AF with rapid ventricular rate • Associated cardiac lesions – Aortic stenosis-LVH, decreased compliance-decreased opening motion of mitral valve – Aortic regurgitation – ASD – PHT with marked RV enlargement
• Characteristics of mitral valve – Extensive calcification • Others – Apex formed by RV – Inability to localise apex • Obesity • Muscular chest • COPD
Factors increasing intensity of murmur • a/w MR-increased volume of LA bloodincreased transvalvular flow • Tachycardia
Calculation of MVA • Toricelli’s law – – F=AVCc A=F/V Cc F-Flow rate, A-orifice area, V-velocity of flow Cc-coefficient of orifice contraction • Gradient and velocity of flow related by – – V 2=Cv 2*2 g h G=gravitational constant, h=pressure gradient Cv=Coefficient of Velocity V=Cv*√ 2 g h • MVA=F/Cv*Cc* √ 2 g h =F/C*44. 3*√h
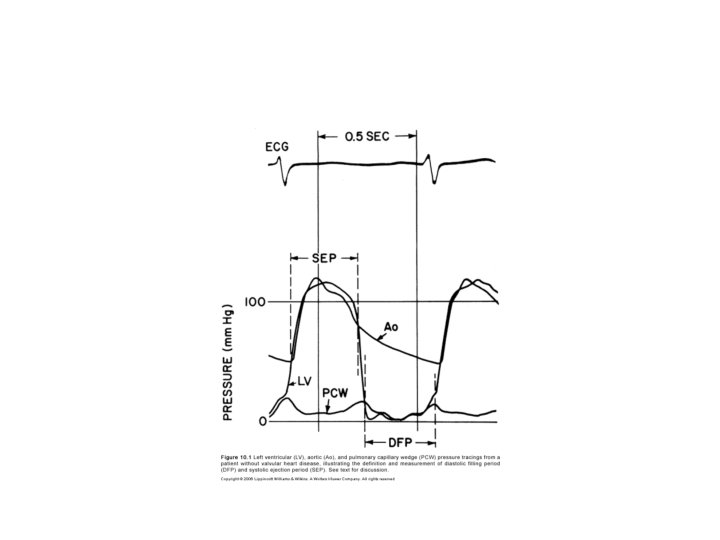
• Flow – Total cardiac output divided by time in seconds during which flow occurs across the valve – F=COP/DFP*HR
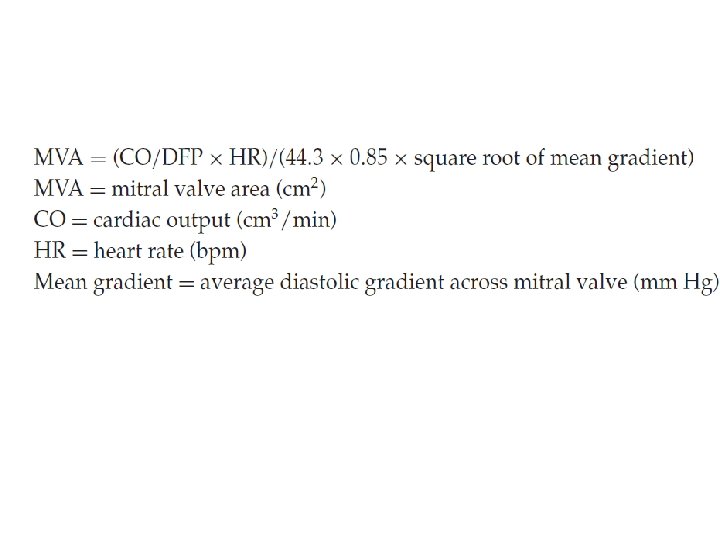
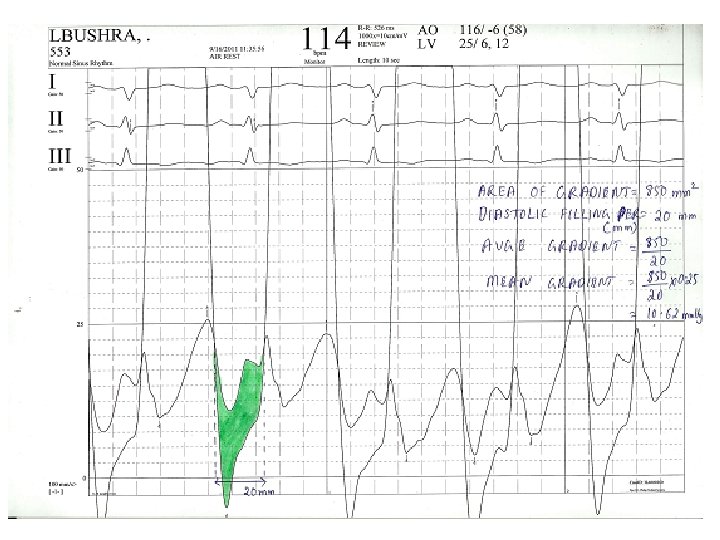
Steps • Average gradient=area(mm 2)/length of diastole(mm) • Mean gradient=average gr * scale • Average diastolic period=length of DFP(mm)/paper speed(mm/s) • HR(bt/min), COP(ml/min) • MVA=cardiac output/HR×average diastolic period÷ 37. 7×√mean gradient
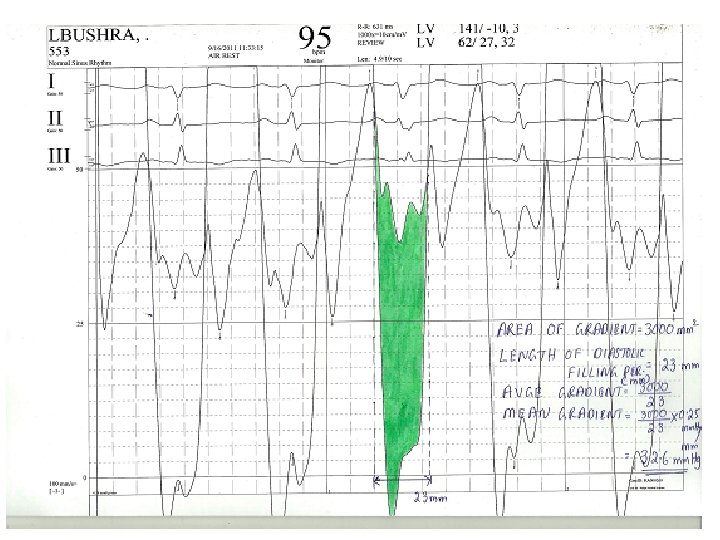
Calculation of mean gradient-pre BMV • • • Area of gradient=30*10*6. 5=1950 mm 2 Diastolic filling period=23 mm Avge gradient=1950/23=84. 78 mm Scale=25/65=0. 38 mm. Hg/mm Mean gradient=84. 78*0. 38=32. 6 mm. Hg
Calculation of MVA-pre BMV • • • Mean gradient=32. 6 mm. Hg Diastolic filling period=23 mm/100 mm/s=. 23 s HR=95/min COP=5000 ml/min MVA=4150/(0. 23*95)÷(37. 7*√ 32. 6) =0. 88 cm 2
Calculation of mean gradient –post BMV • • Area of gradient=8. 5*10*6. 5=552. 5 mm 2 Diastolic filling period=20 mm Avge gradient=552. 5/20=27. 62 mm Mean gradient=27. 62*0. 38=10. 49 mm. Hg
Calculation of MVA post BMV • • • Mean grad=10. 49 DFP=0. 2 s HR=114/min COP=5000 ml/min MVA=5000/(0. 2*114)÷(37. 7*√ 10. 49) =1. 94 cm 2
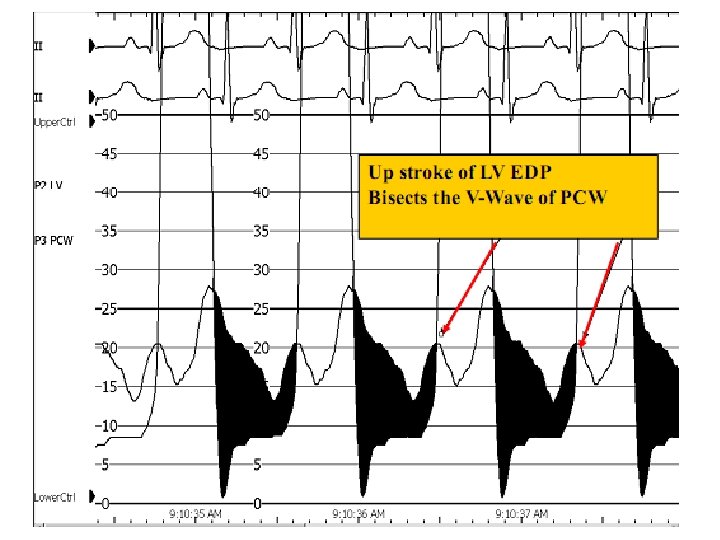
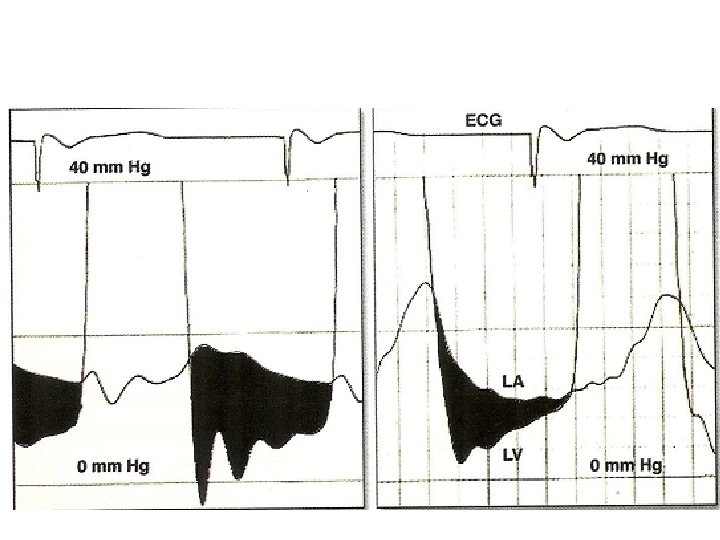
Alignment mismatch • In PCWP there is a delay in transmission of LA pressure through the pulmonary vascular bed • delayed by 50 -70 ms • Realigned by shifting leftward • V wave peak bisected by or slightly to left of LV pressure tracing
Wedge-LV Vs LA-LV
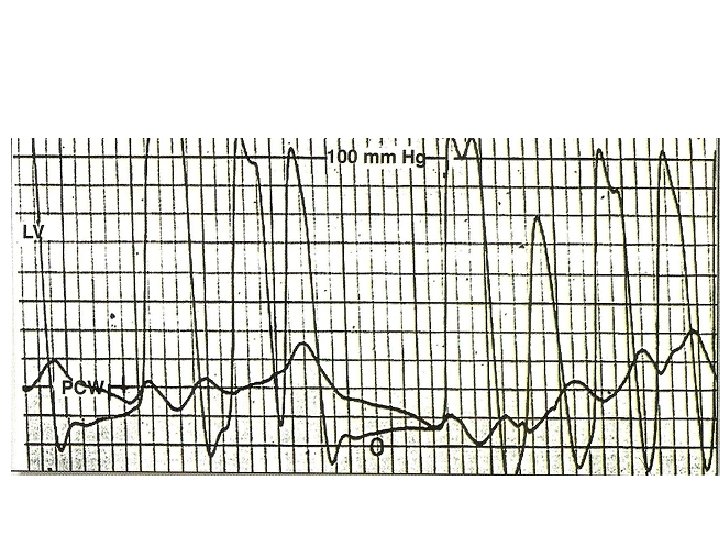
Damped wedge-LV Vs LA-LV • Overestimation of MV gradient can occur if a damped wedge pressure is used • Difficult to obtain proper wedge – Severe PAH • Overestimation of gradient even after a proper wedge – Prosthetic MV – Elderly with severe mitral annular calcification
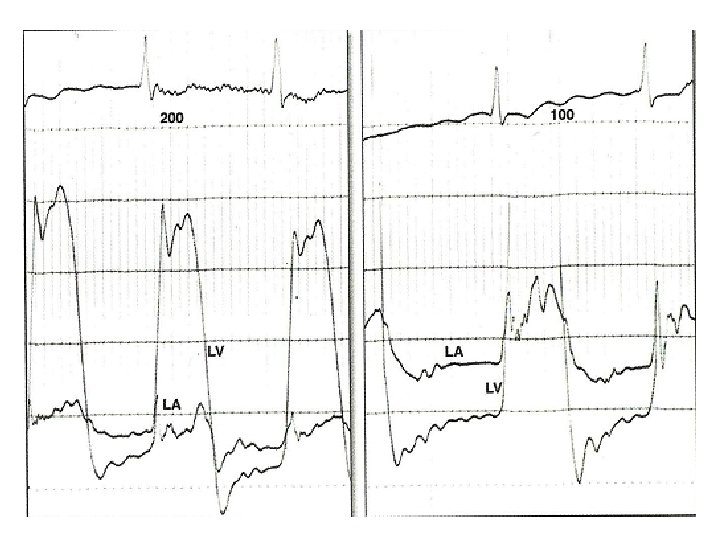
LA –LV gradient in AF • With long diastolic filling period , progressive decrease in LA pressure • Increase with short diastole • Measure gradient in 3 to 4 diastolic complexes with nearly equal cycle length & take mean
Pitfalls • PCWP overestimates LA pressure by 2 -3 mm. Hg • If a/w MR, true mitral valve flow is underestimated-calculated MVA underestimated • Calculation of COP, HR, DFP, mean gradient must be simultaneous • If PCWP used , wedge position must be confirmed by – withdrawing blood sample&measure saturation – Bright red blood on aspiration – Contrast injection to visualise fern pattern
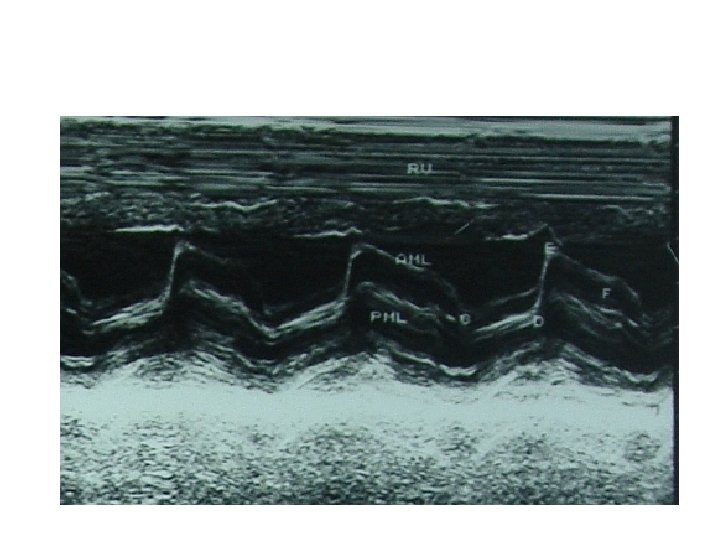
M-mode echo • Reduced mitral E-F slope – Slope <15 mm/s-MVA<1. 3 CM 2 – Slope>35 mm/s-MVA >1. 8 CM 2 – low sensitivity &specificity • anterior motion of posterior mitral leaflet • Absence of A wave in mitral valve M-mode
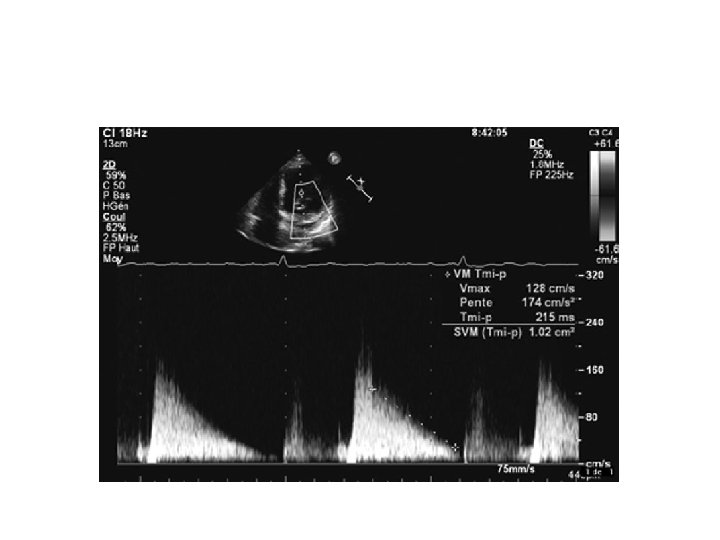
Doppler echo • • Increase early diastolic peak velocity Slower than normal rate of fall in velocity Period of diastasis in mid diastole eliminated LA –LV pressures do not equalise until onset of ventricular systole
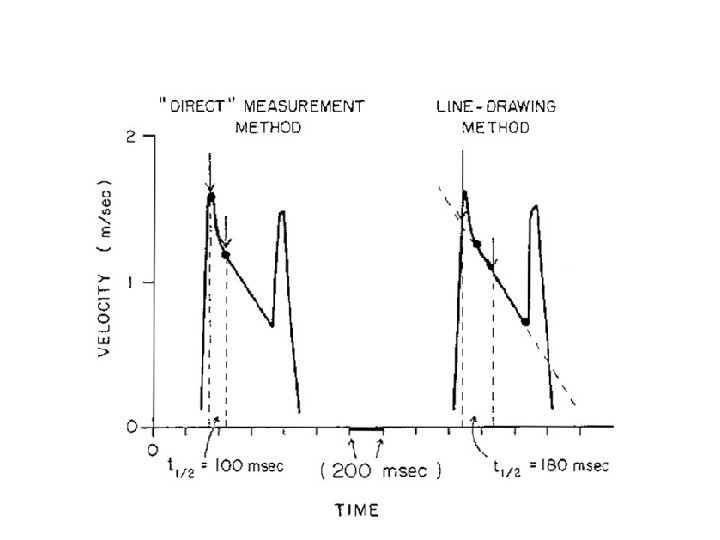
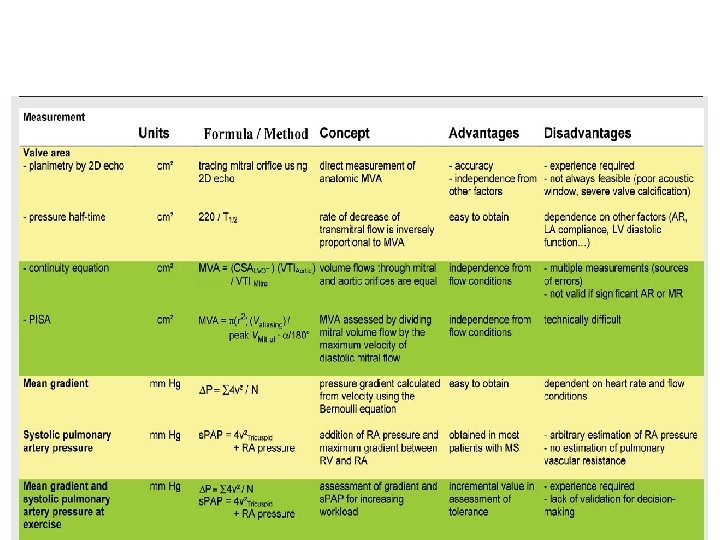
PHT • Hatle &Agelson-PHT of 220 ms corresponded to MVA 1 CM 2 • MVA=220/PHT • Should be measured from slope with longer duration
Advantages of PHT • Easy to obtain • Not affected by COP, MR
Pitfalls • Affected by gradient b/w LA and LV • Rate of rise of ventricular diastolic pressure will increase in a poorly compliant LV • Shorten the PHT-overestimate of MVA • Elevation of LVEDP due to significant AR or diastolic dysfunction alter PHT • Post BMV
MVA by PISA • MVA=6. 28*r 2* Valiasing*/Vpeak*ἁ/180 R-radius of convergence hemisphere V aliasing –aliasing velocity in cm/s V peak-peak CW velocity of mitral inflow ά-opening angle of mitral leaflets
• Advantages – Independent from flow conditions • Disadvantage – Technically difficult
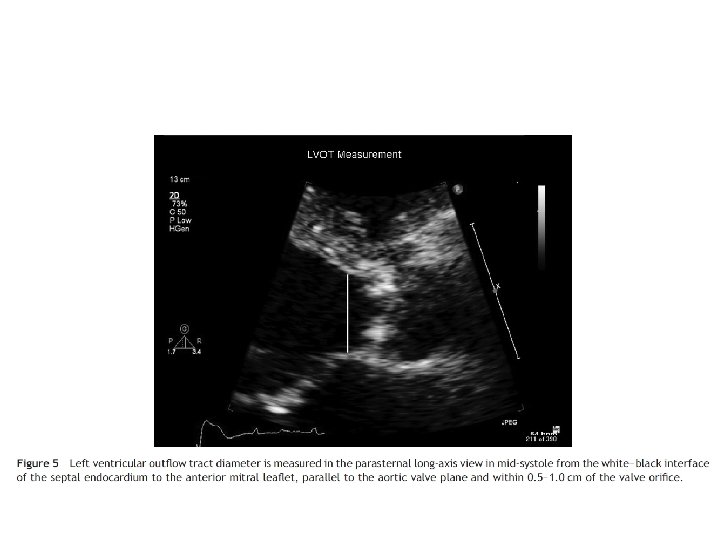
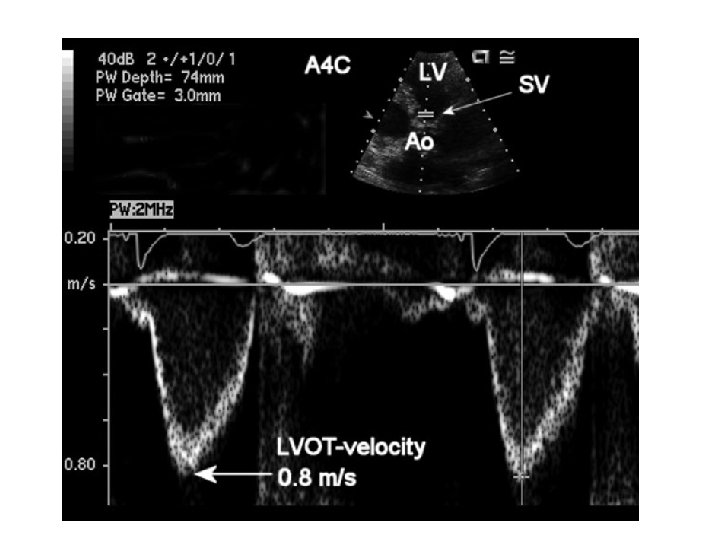
MVA by continuity equation • In the absence of valvular regurgitation or an intracardiac shunt, amount of blood flow across MV equals amt of blood flow across aortic valve • CSA(LVOT)*VTI (LVOT)=MVA*VTI(MV)
• Advantage – Not affected by transmitral gradient – More accurate than PHT • Disadvantage – Not accurate in presence of AR or MR
• Thank you
LV dysfunction in MS • Rheumatic myocardial factor(Dubiel JP , 1975) • Restriction of posterobasal myocardium by the scarred mitral apparatus • Abnormal interventricular motion due to RV overload • AF • CAD, coronary embolisation