Clinical Documentation Excellence ICD 10 conversion H Louis


- Slides: 13
Clinical Documentation Excellence ICD 10 conversion H. Louis Harkey, M. D. Department of Neurosurgery MSHIMS Annual Conference June 22, 2016
Program Fundamentals Data-Driven No Data Actionable Knowledge Engagement None Engaged
Key Components Engage physicians in initiatives to improve pay-for-performance and revenue cycle metrics Create solutions that support physicians in real-time within existing work flows Improve inpatient and outpatient documentation accuracy, completeness, and timeliness Drive improvement in quality outcomes measures and cash collections
Documentation Maturity Model Components Stage 1 Stage 2 Stage 3 Stage 4 Data-Driven No data sharing Historical data Descriptive analytics Predictive analytics Complete Limited queries Queries in all settings Education and queries Multi-faceted communicati ons Accurate No education or templates Some structured templates Templates and work flows Optimized work flows Timely Poor delinquency rate 30 -50% Delinquency Rate 10 -30% Delinquency Rate < 10% Delinquency Rate Epic Go live CDE
Neurosurgical CDE Program • Team included: • • department chairman / residency program director CDI specialist pro fee coder project manager • Initiated November 2013 • Met monthly • Actively supported rounding with physicians and educational sessions
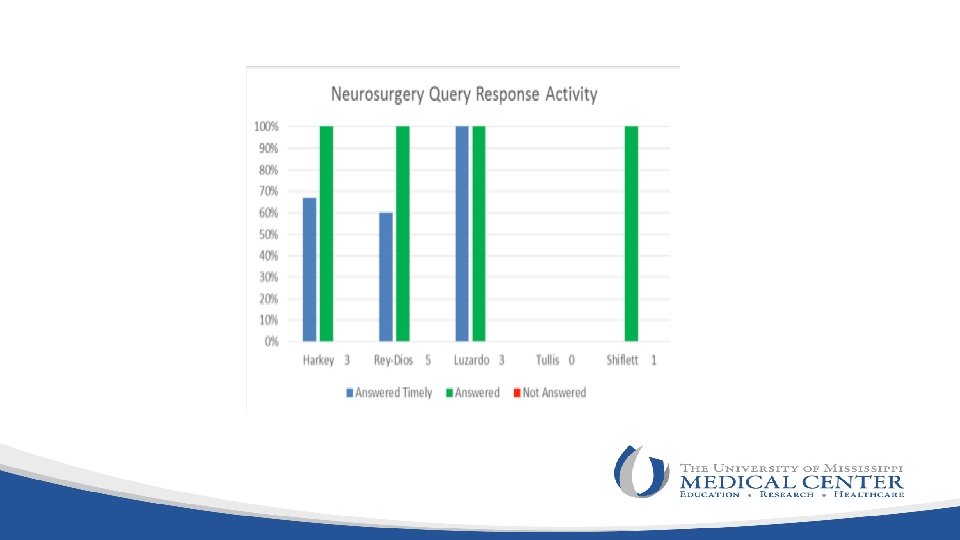
Neurosurgery Plan • Focus on inpatient documentation – Complete list of diagnoses that drive patient complexity • • Deficiencies and delinquency rate Timely query responses Case Mix Index, MC & MCC capture rates Unspecified diagnoses
4000 Total Delinquent Deficiencies and Delinquency Rate 3500 3396 3265 3223 3000 2500 2035 2000 1961 1824 1807 1624 1619 1621 8 9 10 1746 1750 11 12 1846 1500 1000 500 0 1 2 3 4 5 6 7 13
5 15 14 -1 ев ф в- ян 14 к- де но я- 4 14 т1 ок 14 14 гн- се ав л- 14 $1, 325/case ию $21, 690 н- $20, 365 4 Difference ию 2014 3. 16 й 1 14 2013 2. 97 ма 14 р- ап 4 14 13 -1 р- ма ев ф в- ян 13 к- де но я- 3 13 т1 ок 13 г- н- се ав 13 13 л- ию н- ию 13 13 CMI At base rate й- ма р- ап 3 13 р- ма 13 4 -1 ев ф в- ян Neurosurgery CMI January 2013 - February 2015 4, 5 3 2, 5 Initiated CDE 2
Neurosurgery Unspecified Code Usage 16, 00% 15, 52% 15, 27% 15, 00% 14, 55% 14, 00% 13, 82% 14, 33% 14, 38% 14, 26% 14, 08% 13, 70% 13, 00% 12, 97% 12, 52% 12, 00% 11, 00% 10, 00% 14 р- ап 4 -1 й ма 14 нию 14 лию ав 14 г- 4 се 1 н- % Unspecified 4 1 ток 14 я- но 4 -1 к де 15 вян 5 -1 в фе
UHC Neurosurgery Data FY 14 FY 15 CMI 3. 5441 3. 7492 Expected Mortality LOS Mortality Index 8. 02 7. 32% 0. 83 8. 5 8. 09% 0. 89 Rank FY 14 FY 15 62/122 11/123 10/122 10/123 10/122 8/123 36/122 52/123
Documentation Maturity Model Components Stage 1 Stage 2 Stage 3 Stage 4 Data-Driven No data sharing Historical data Descriptive analytics Predictive analytics Complete Limited queries Queries in all settings Education and queries Multi-faceted communicati ons Accurate No education or templates Some structured templates Templates and work flows Optimized work flows Timely Poor delinquency rate 30 -50% Delinquency Rate 10 -30% Delinquency Rate < 10% Delinquency Rate Epic Go live CDE
Neurosurgery Accuracy Neurosurgery Case Mix Index 4, 00 3, 50 3, 00 2, 50 2, 00 1, 50 1, 00 0, 50 Yearly Average 2014 2015 2013 2014 2015 2. 97 3. 16 3. 30 m ce De ve m be be r r r be No to r be m pt e Se 2013 Oc st gu Au ly Ju ne Ju ay M ri l Ap ch M ar y ar ru Fe b Ja nu ar y 0, 00 NEUROSURGERY CASE MIX INDEX Month 2013 2014 2015 January 2. 94 3. 37 3. 62 February 3. 25 3. 19 3. 91 March 3. 22 3. 11 3. 13 April 2. 53 3. 71 2. 85 May 3. 36 3. 04 3. 37 June 2. 82 3. 25 2. 93 July 3. 03 3. 04 3. 06 August 2. 87 2. 74 2. 81 September 2. 57 3. 12 3. 28 October 2. 96 3. 09 3. 30 November 2. 78 2. 98 3. 34 December 3. 27 3. 28 3. 75 Yearly Average 2. 97 3. 16 3. 30