
Climate Crisis Is it real How bad might
Climate Crisis — Is it real? How bad might it be? William P. Hall President Kororoit Institute Proponents and Supporters Assoc. , Inc. http: //kororoit. org william-hall@bigpond. com http: //www. orgs-evolution-knowledge. net Macedon Ranges AGM, Woodend, 23 Aug 2017 Access my research papers from Google Citations
WE LIVE ON A FINITE PLANET WHAT WE DO TO IT HAS CONSEQUENCES 2
Scope l Global climate is a complex chaotically dynamic system – – – l Observations and models suggest we face the risk of a climate crisis – – – 3 l Driven by the potential differences between input (high energy solar radiation) and output (heat radiation to space) Many non-linearities due to positive and negative feedbacks between different variables lead to mathematical chaos Chaos means minute differences in initial conditions can rapidly lead to radically different outcomes Models are useful indicators of possible outcomes Impossible to predict future climate parameters with any certainty – feedback can rapidly accelerate changes Many iterations may give some idea of probable outcomes Observations: concentrations of greenhouse gases rising to historic extremes Increasing global temperatures with polar extremes Ongoing processes likely to contribute major sources of positive feedbacks No proof but risk analysis suggests the crisis is existential
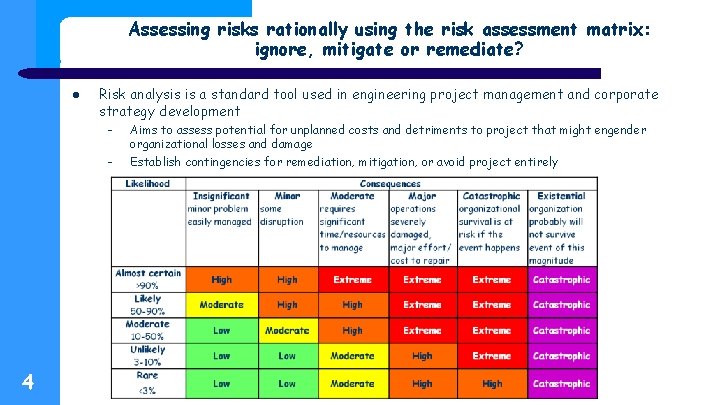
Assessing risks rationally using the risk assessment matrix: ignore, mitigate or remediate? l Risk analysis is a standard tool used in engineering project management and corporate strategy development – – 4 Aims to assess potential for unplanned costs and detriments to project that might engender organizational losses and damage Establish contingencies for remediation, mitigation, or avoid project entirely
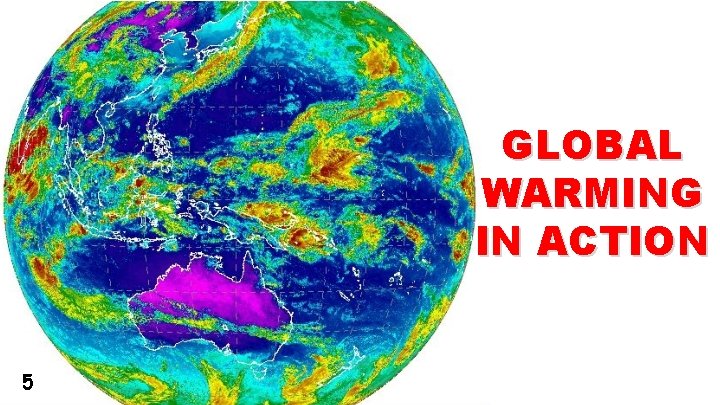
GLOBAL WARMING IN ACTION 5
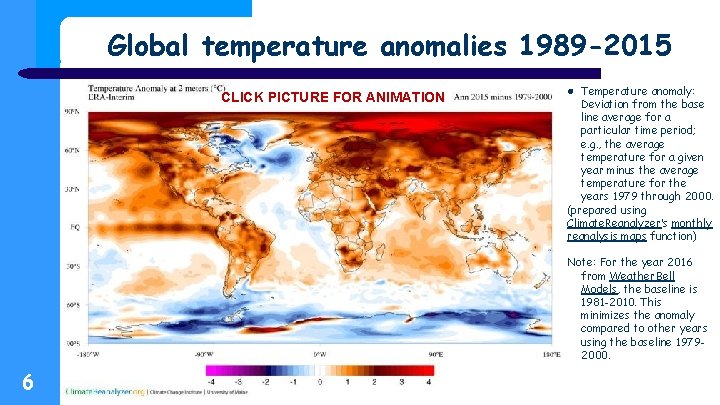
Global temperature anomalies 1989 -2015 CLICK PICTURE FOR ANIMATION l Temperature anomaly: Deviation from the base line average for a particular time period; e. g. , the average temperature for a given year minus the average temperature for the years 1979 through 2000. (prepared using Climate. Reanalyzer’s monthly reanalysis maps function) Note: For the year 2016 from Weather. Bell Models, the baseline is 1981 -2010. This minimizes the anomaly compared to other years using the baseline 19792000. 6
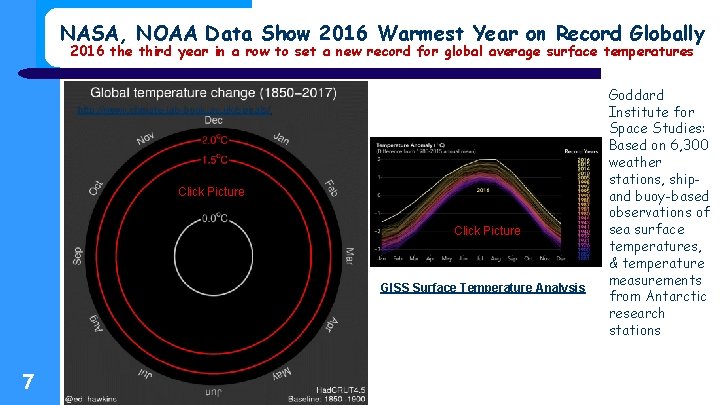
NASA, NOAA Data Show 2016 Warmest Year on Record Globally 2016 the third year in a row to set a new record for global average surface temperatures http: //www. climate-lab-book. ac. uk/spirals/ Click Picture GISS Surface Temperature Analysis 7 Goddard Institute for Space Studies: Based on 6, 300 weather stations, shipand buoy-based observations of sea surface temperatures, & temperature measurements from Antarctic research stations
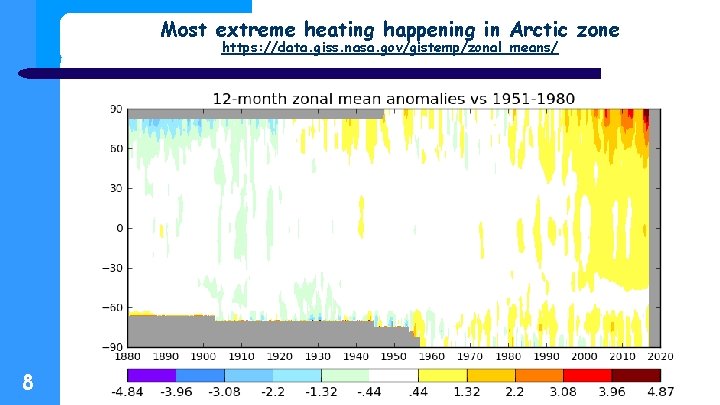
Most extreme heating happening in Arctic zone https: //data. giss. nasa. gov/gistemp/zonal_means/ 8
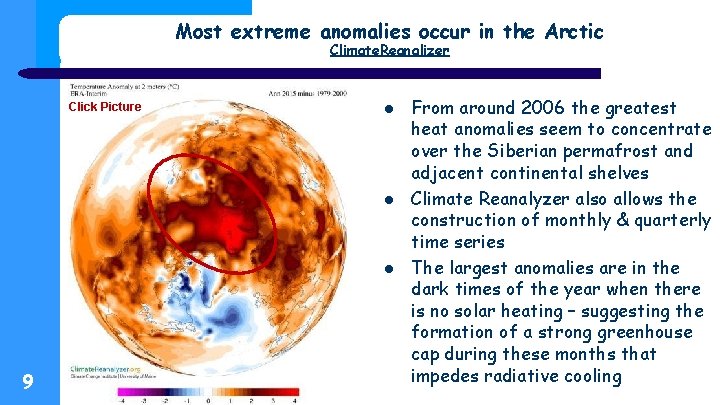
Most extreme anomalies occur in the Arctic Climate. Reanalizer Click Picture l l l 9 From around 2006 the greatest heat anomalies seem to concentrate over the Siberian permafrost and adjacent continental shelves Climate Reanalyzer also allows the construction of monthly & quarterly time series The largest anomalies are in the dark times of the year when there is no solar heating – suggesting the formation of a strong greenhouse cap during these months that impedes radiative cooling
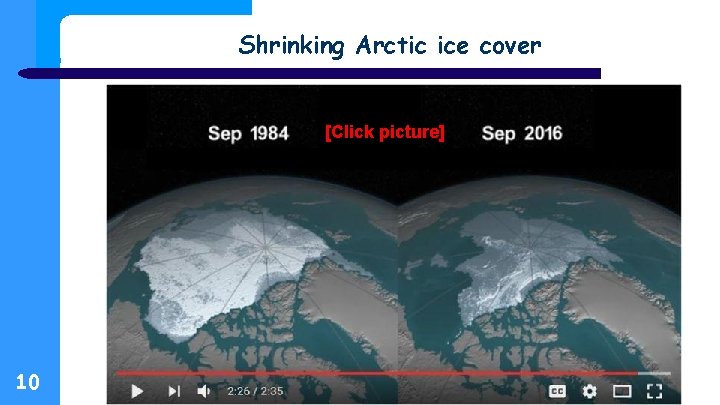
Shrinking Arctic ice cover [Click picture] 10
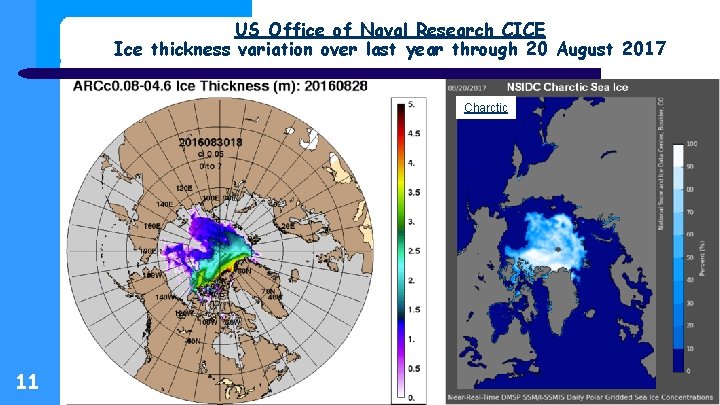
US Office of Naval Research CICE Ice thickness variation over last year through 20 August 2017 Charctic 11
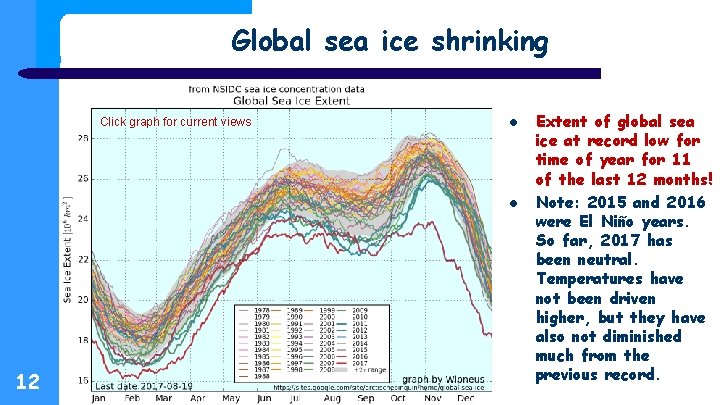
Global sea ice shrinking Click graph for current views l l 12 Extent of global sea ice at record low for time of year for 11 of the last 12 months! Note: 2015 and 2016 were El Niño years. So far, 2017 has been neutral. Temperatures have not been driven higher, but they have also not diminished much from the previous record.
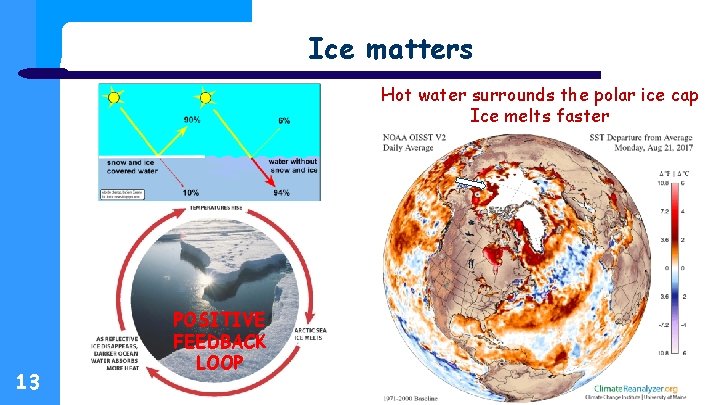
Ice matters Hot water surrounds the polar ice cap Ice melts faster 13 POSITIVE FEEDBACK LOOP
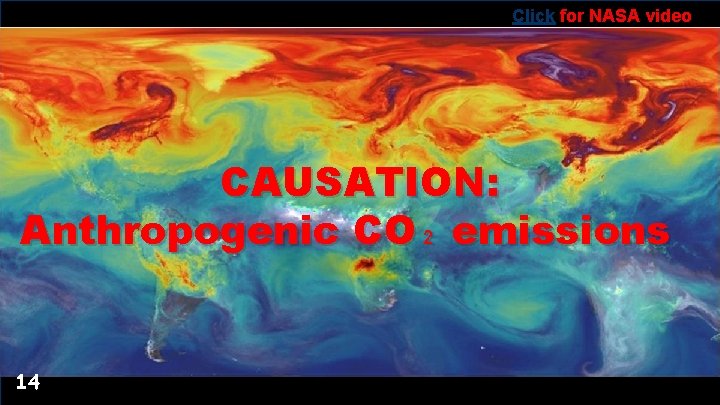
Click for NASA video CAUSATION: Anthropogenic CO₂ emissions 14
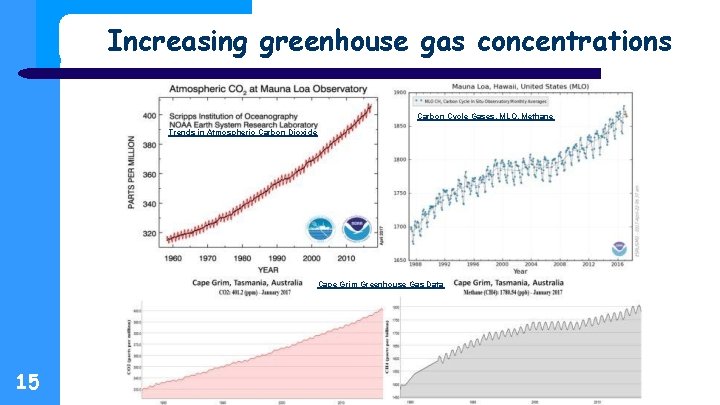
Increasing greenhouse gas concentrations Carbon Cycle Gases, MLO, Methane Trends in Atmospheric Carbon Dioxide Cape Grim Greenhouse Gas Data 15
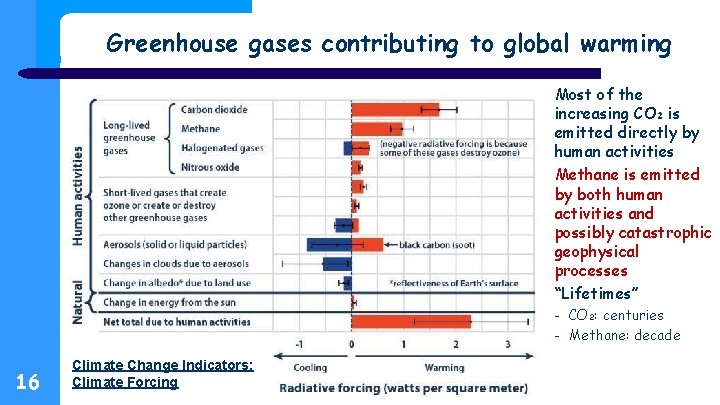
Greenhouse gases contributing to global warming Most of the increasing CO₂ is emitted directly by human activities Methane is emitted by both human activities and possibly catastrophic geophysical processes “Lifetimes” – – 16 Climate Change Indicators: Climate Forcing CO₂: centuries Methane: decade
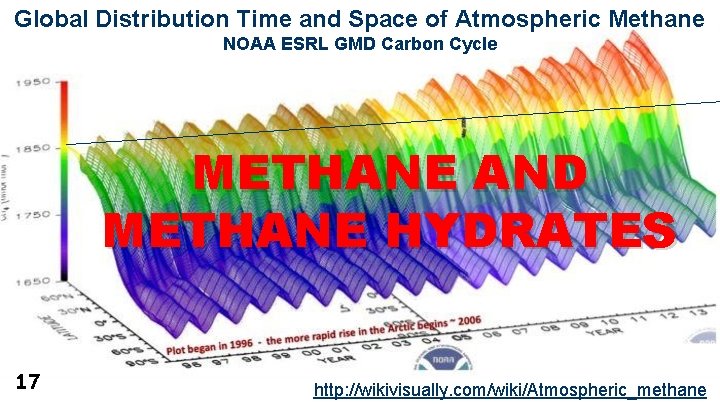
Global Distribution Time and Space of Atmospheric Methane NOAA ESRL GMD Carbon Cycle METHANE AND METHANE HYDRATES 17 http: //wikivisually. com/wiki/Atmospheric_methane
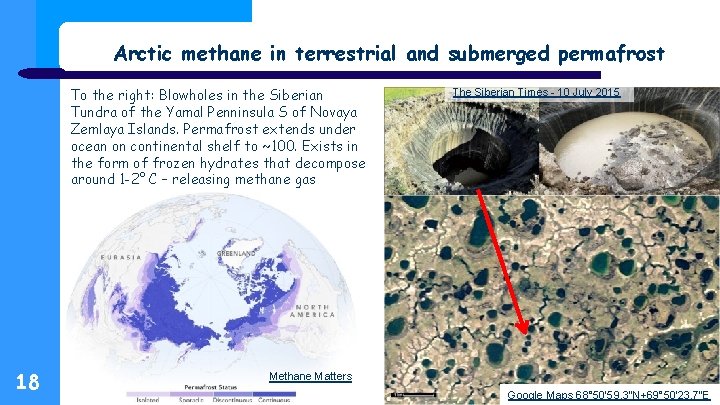
Arctic methane in terrestrial and submerged permafrost To the right: Blowholes in the Siberian Tundra of the Yamal Penninsula S of Novaya Zemlaya Islands. Permafrost extends under ocean on continental shelf to ~100. Exists in the form of frozen hydrates that decompose around 1 -2° C – releasing methane gas 18 The Siberian Times - 10 July 2015 Methane Matters Google Maps 68° 50'59. 3"N+69° 50'23. 7"E
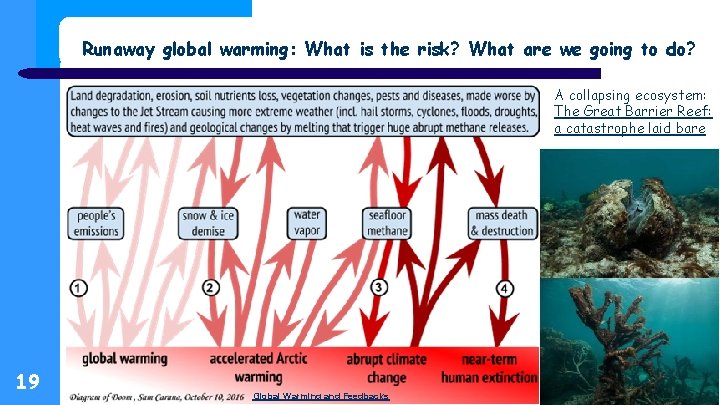
Runaway global warming: What is the risk? What are we going to do? A collapsing ecosystem: The Great Barrier Reef: a catastrophe laid bare 19 Global Warming and Feedbacks
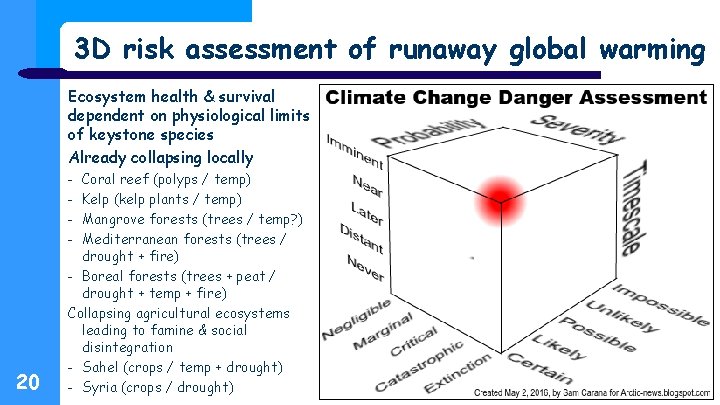
3 D risk assessment of runaway global warming Ecosystem health & survival dependent on physiological limits of keystone species Already collapsing locally - 20 Coral reef (polyps / temp) Kelp (kelp plants / temp) Mangrove forests (trees / temp? ) Mediterranean forests (trees / drought + fire) - Boreal forests (trees + peat / drought + temp + fire) Collapsing agricultural ecosystems leading to famine & social disintegration - Sahel (crops / temp + drought) - Syria (crops / drought)
- Slides: 20