Climate Change The Move to Action AOSS 480
 Richard B. Rood")

 • Climate Monitoring at National Climatic Data Center. –")


")

")
")


. • Climate change will")


 • Increase scale of weather-related ecological and human disruptions: “sustained natural")
 • Threat Multiplier – Esp. Middle East, Africa, Asia – Food")
 • To Developed World – Increased pressure from immigration – Increase")

 • Climate change needs to be integrated into defense strategy •")
 • U. S. Department of Defense should aggressively pursue energy efficiency")


")

 Describe what is in the picture. What")


 Primary increase comes from burning fossil fuels")

 OCEAN LAND")

")
 2001 Hansen et al: (1998) & (2001)")
- Slides: 67
Climate Change: The Move to Action (AOSS 480 // NRE 480) Richard B. Rood Cell: 301 -526 -8572 2525 Space Research Building (North Campus) rbrood@umich. edu http: //aoss. engin. umich. edu/people/rbrood Winter 2014 April 8, 2014
Class News • Ctools site: AOSS_SNRE_480_001_W 14 • Something I am playing with – http: //openclimate. tumblr. com/ • Assignment – Emailed – Posted Politics of Dismissal Entry Model Uncertainty Description
The Current Climate (Released Monthly) • Climate Monitoring at National Climatic Data Center. – http: //www. ncdc. noaa. gov/oa/ncdc. html • State of the Climate: Global • Interesting new document? – OECD Environmental Outlook to 2050: The Consequences of Inaction
Today • Framework for thinking about impacts and response via planning – Public health – example – Ecosystems – Water – Agriculture – Etc. • National security
Climate Change and Public Health • Public Health, esp. heatwaves, will be used as an example to show the elements of a real problem and its relation to climate change. • How does it relate to mitigation, adaptation? – policy – law – etc.
Climate Change and Public Health • Acknowledgement and thanks to – Marie S. O’Neill (Michigan) and a team in School of Public Health
Pathways by Which Climate Change Affects Health WHO: Climate Change and Public Health
Health Impacts of Climate Change • Increased heat waves and shifts in urban air quality • Vector born diseases • Range and seasonality of infectious diseases • Rising sea levels and extreme weather events = dislocation, environmental refugees = global security issue • Threatened food supply, release of toxins into environment • Decrease in water quality
Vector Born Disease • Dengue, malaria, west nile virus, others • Differential exposure on a global level • Some unexpected by products - spraying may cause chronic disease, drug resistance
Extreme Weather Events • • Injuries and death Long term psychological problems Increased infectious disease Contaminated water supplies
Quantifying and forecasting climate change public health impacts • Colder climates, e. g. , Netherlands, may benefit • Hotter climates may have more effects with projected rise of 1. 4 -5. 8 o C • Overall expected impact: increased weather-related deaths
Co-evolution
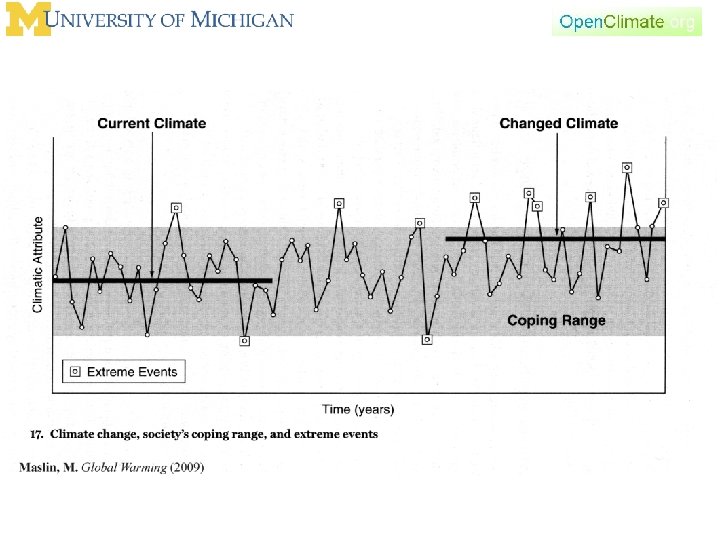
Useful way to think about impact and adaptation BAD GOOD Temperature (other environmental parameter)
For many things: living things and ecosystems • There is an optimal range of an environmental parameter, e. g. temperature or moisture. – Above or below this range risk increases • The function looks like a parabola – May be skewed
Skewed towards hot being dangerous BAD GOOD Temperature (other environmental parameter)
Skewed towards cold being dangerous BAD GOOD Temperature (other environmental parameter)
Heatwaves • Public health experts count heatwaves as the most consequential environmental health risk. – examples are Chicago Heat Wave 1995, European Heat Wave 2003, Russian Heat Wave 2010
What is a heatwave? • Not so easy to define, because we have now brought in the human dimension. – Not the same in Houston and Chicago • Extreme high heat? • Persistent high heat?
Humans and heat • Environmental heat exposure • Exercise induced heat • Ability to cool
An observation • Extreme heat and exercise – greater than 105 is bad! • Persistent heat combined with environmental heat exposure and ability to cool – strongly dependent on acclimation – persistent night time minimum temperatures are high – this has been the most deadly
Heat Waves in Future Observed Modeled Predicted change in the future Meehl and Tebaldi, Science, 2004
Heatwaves in future • More frequent • More intense • Greater duration
The heatwave problem • This problem already exists (short term). • Climate change will amplify it. • Mitigation of greenhouse gases will have only indirect effect (long term) • What are the most effective responses?
Insights from sociology/geography • 1995 Chicago heat wave: neighborhood influences at small scale • Population stability, social structure more predictive than race Eric Klinenberg (2002) Heat wave: A social autopsy of disaster • St. Louis: spatial features (heat island, concentrated poverty) determined risk Smoyer-Tomic, K, Social Science & Medicine, 1998
There are Adaptation Measures • Federal versus city-level • Existing: – Heat warning systems – Emergency management – Air conditioning
Adaptation Measures Health outcome Legislative Technical Educational Cultural and Behavioural Thermal Building guidelines Housing, public buildings, urban planning to reduce heat island effects, air conditioning Early warning systems Clothing, siesta Vectorborne diseases Vector control, Vaccination, impregnated bednets. Sustainable surveillance, prevention and control programs Health education Water Storage practices Water borne Watershed diseases protection laws Water quality regulation Genetic/molecular screening of pathogens. Improved water treatment (e. g. , filters). Improved sanitation (e. g. , latrines) Boil water alerts Washing hands and other hygiene behavior. Use of pit latrines
Complexity WEALTH LOCAL TEMPORAL NEAR-TERM LONG-TERM GLOBAL SPATIAL Small scales inform large scales. Large scales inform small scales.
Lessons from heat waves • Existing problem with existing system to address the problem – Some good, some bad • Strongly dependent on extreme events, not the average – Hence want to know how extreme events will change • Not clearly and distinctly addressed by efforts to mitigate greenhouse gas emissions – Motivator for “Kyoto like” policy?
Lessons from heat waves • Strongest levers for addressing the problem are – Societal capability (social integration, structure, communications) – Environmental warnings and alerts – Education (first responders, general public, . . ) – Engineering (air conditioners, green spaces, . . . )
Repeatedly see this pattern • Existing problem with existing system to address the problem • Strongly dependent on extreme events, not the average • Strongest levers for addressing the problem are – – Societal capability Environmental warnings and alerts Education Engineering
Heat Wave System: Basic elements and values HUMAN HEALTH AND PHYSIOLOGICAL INFORMATION HEAT-RELATED ENVIRONMENTAL PRODUCTS (e. g heat index) COMMUNICATION of PRODUCTS ACTIONS BASED ON PRODUCTS and COMMUNICATION Policy Research and Validation ENVIRONMENTAL OBSERVATIONS and FORECASTS
Three basic types of information E 3 E 2 G 3 E 4 E 1 G 2 En P 3 G 4 G 1 P 2 Gn Environmental Information Geographical Information EW CS P 4 P 1 Pn Population Information VP 1 VP 2
Today • Framework for thinking about impacts and response via planning – Public health – example – Ecosystems – Water – Agriculture – Etc. • National security
Reference Material • 2007: National Security and Climate Change, Retired Generals and Admirals • 2009: National Security Energy and Climate, Retired Generals and Admirals • 2010: Quadrennial Defense Review • 2012: Security and Water Resources • 2014: Quadrennial Defense Review
Thread through recent defense security positions • Defense-related Think Tank: Center for Data Analysis • Quadrennial Defense Review • Strong link of energy to Department of Defense activities • Intelligence Reviews
Approach • What are the security risks? • Which affect American interests? • What actions should America take? • Ultimately focus on integrated impacts
Basic Findings (1) • Increase scale of weather-related ecological and human disruptions: “sustained natural and human disasters on a scale far beyond what we see today. ” • Disruption: remember we are in balance, disruption and uncertainty are major players in defense and markets
Basic Findings (2) • Threat Multiplier – Esp. Middle East, Africa, Asia – Food production, public health, clean water – Large migrations – Failed states
Basic Findings (3) • To Developed World – Increased pressure from immigration – Increase use of resources to respond to humanitarian disasters • Interplay between National Security, Energy Dependence – Increase vulnerability to single natural events and terrorism
Mini-summary National Security “The impacts of climate change may increase the frequency, scale, and complexity of future missions, including defense support to civil authorities, while at the same time undermining the capacity of our domestic installations to support training activities. Our actions to increase energy and water security, including investments in energy efficiency, new technologies, and renewable energy sources, will increase the resiliency of our installations and help mitigate these effects. ” 2014: Quadrennial Defense Review
Basic Recommendations (1) • Climate change needs to be integrated into defense strategy • U. S. should work more strongly to mitigate the impacts of climate change • U. S. should help build adaptive capacity and resilience in the developing world
Basic Recommendations (2) • U. S. Department of Defense should aggressively pursue energy efficiency and alternative energy • U. S. should assess impact of climate change on assets – Sea level rise – Extreme events – Assets in low lying islands
Quadrennial Defense Review • Change of operating environment – Geopolitical impacts: Instability of fragile nations – Humanitarian efforts – Environmental security • Impact on assets – National Intelligence Survey in 2008: 30 installations already face sea level threats • Strategic Environmental Research and Development Program • Energy efficiency and alternative energy
Admiral Titley: Task Force Climate Change Task Force Energy • Challenges – When, is important. (2020, 2030, … ) – Changing geography – Arctic Maritime (clear for 4 weeks @ 2035, 3 months @ 2050 ) • Commerce in shipping – Water and resource scarcity – Sea level rise impact on installations
Admiral Titley: Task Force Climate Change Task Force Energy • Opportunities – Cooperative partnerships – Energy security – Infrastructure recapitalization
Admiral Titley: Task Force Climate Change Task Force Energy • Wild cards – Abrupt climate change (Fast changes, jumps from one to another. ) – Geoengineering – Ocean Acidification
Climate Change Case Studies? • • • Pakistan floods 2010 and 2011 Russian heat wave and drought 2010 Texas drought and heat 2011 The 2011 Japanese earthquake The Arab Spring – Markets – Relation to energy
Problem Solving Figures
We arrive at levels of granularity WEALTH Need to introduce spatial scales as well Sandvik: Wealth and Climate Change LOCAL TEMPORAL NEAR-TERM LONG-TERM GLOBAL SPATIAL Small scales inform large scales. Large scales inform small scales.
What is short-term and long-term? Pose that time scales for addressing climate change as a society are best defined by human dimensions. Length of infrastructure investment, accumulation of wealth over a lifetime, . . . LONG SHORT Election time scales ENERGY SECURITY CLIMATE CHANGE ECONOMY 0 years 25 years There are short-term issues important to climate change. 50 years 75 years 100 years
What is short-term and long-term? Pose that time scales for addressing climate change as a society are best defined by human dimensions. Length of infrastructure investment, accumulation of wealth over a lifetime, . . . LONG SHORT Election time scales ENERGY SECURITY CLIMATE CHANGE ECONOMY 0 years 25 years There are short-term issues important to climate change. 50 years 75 years 100 years
Structure of Problem Solving (http: //glisaclimate. org/home )
Skill Set • Analysis – Distinguish between facts and inferences • Evaluation / Judgment – What is the quality of the knowledge? • Synthesis – How do pieces fit together?
Deconstructing how to think about projects. 1) Describe what is in the picture. What are the facts? Make an inventory of what is known. Make an inventory of what is not known. 2) Analysis: How credible is the information? What is the integrity of the reporting? How complete is the picture? Is there derived knowledge? … 4) What to do? Consequences? Options? 3) Does it matter? Impact. Consequences. Relations Why?
Complexity challenges disciplinary intuition • The details of the problem often de-correlate pieces of the problem. – What do I mean? Think about heat waves? • This challenges the intuition of disciplined-based experts, and the ability to generalize. – For example --- Detroit is like Chicago. • The consideration of the system as a whole causes tensions – trade offs - optimization Knowledge Generation Reduction Disciplinary Problem Solving Unification Integration
Development of International Approach to Climate Change 1988 1992 1995 1997 2001 2009 2007 IPCC established Framework Convention (UNFCCC) Kyoto Protocol Copenhagen Accord Scientific assessment Non-binding aim Binding emissions target Keep warming less than 2 C
Iconic and Fundamental Figures
Scientific investigation of Earth’s climate SUN: ENERGY, HEAT EARTH: ABSORBS ENERGY EARTH: EMITS ENERGY TO SPACE BALANCE
Sun-Earth System in Balance SUN EARTH PLACE AN INSULATING BLANKET AROUND EARTH The addition to the blanket is CO 2 FOCUS ON WHAT IS HAPPENING AT THE SURFACE EARTH: EMITS ENERGY TO SPACE BALANCE
Increase of Atmospheric Carbon Dioxide (CO 2) Primary increase comes from burning fossil fuels – coal, oil, natural gas Data and more information
Temperature and CO 2: The last 1000 years Surface temperature and CO 2 data from the past 1000 years. Temperature is a northern hemisphere average. Temperature from several types of measurements are consistent in temporal behavior. q Medieval warm period q “Little ice age” q Temperature starts to follow CO 2 as CO 2 increases beyond approximately 300 ppm, the value seen in the previous graph as the upper range of variability in the past 350, 000 years.
The Earth System SUN CLOUD-WORLD ATMOSPHERE ICE (cryosphere) OCEAN LAND
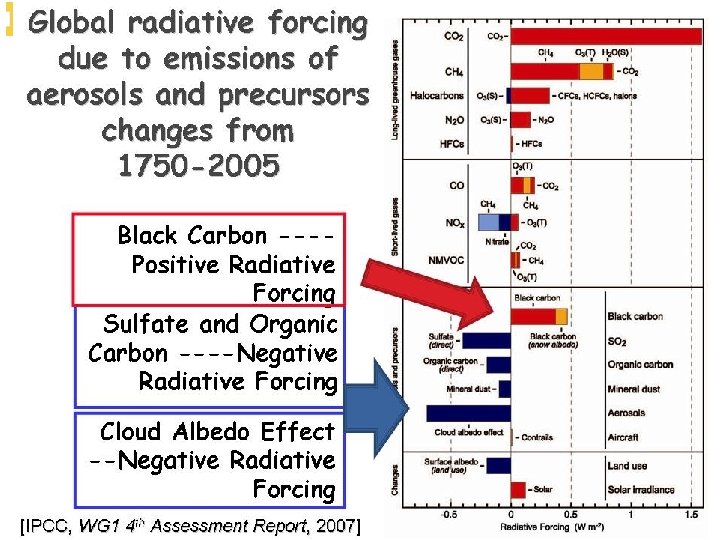
Radiation Balance Figure
Radiative Balance (Trenberth et al. 2009)
1998 Climate Forcing (-2. 7, -0. 6) 2001 Hansen et al: (1998) & (2001) (-3. 7, 0. 0)