
Climate Change Impacts on the Water Cycle Emmanouil
- Slides: 14
Climate Change Impacts on the Water Cycle Emmanouil Anagnostou Department of Civil & Environmental Engineering Program UCONN manos@engr. uconn. edu 2014 NECPUC Annual Symposium, Stowe, Vermont
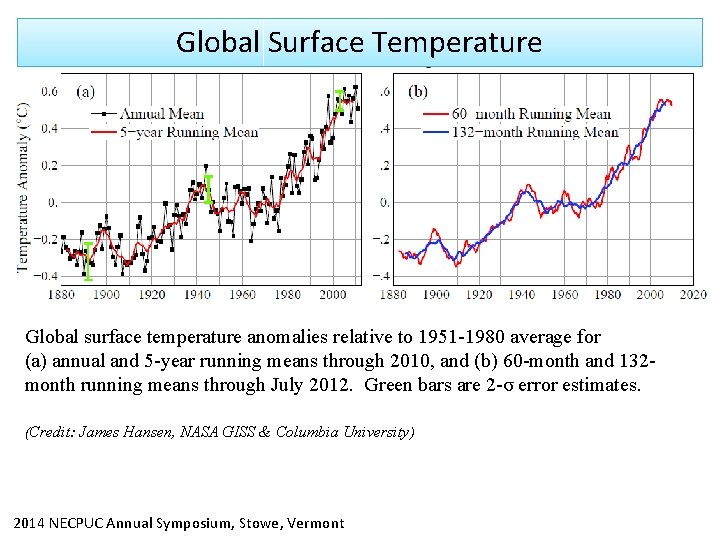
Global Surface Temperature Global surface temperature anomalies relative to 1951 -1980 average for (a) annual and 5 -year running means through 2010, and (b) 60 -month and 132 month running means through July 2012. Green bars are 2 -σ error estimates. (Credit: James Hansen, NASA GISS & Columbia University) 2014 NECPUC Annual Symposium, Stowe, Vermont
Impacts on Evaporation and Transpiration (ET) ET increases globally by approximately 2 -4%/˚C, as a result of – Increased availability of net radiative energy at the surface – Increased atmospheric demand for evaporation, due to the increased capacity of the atmosphere to hold moisture (by ~7%/˚C per the Clausius-Clapeyron relationship) 2014 NECPUC Annual Symposium, Stowe, Vermont
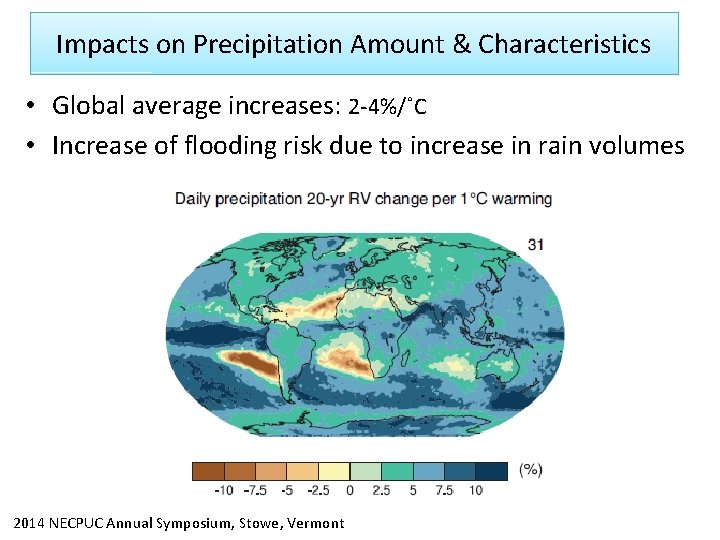
Impacts on Precipitation Amount & Characteristics • Global average increases: 2 -4%/˚C • Increase of flooding risk due to increase in rain volumes 2014 NECPUC Annual Symposium, Stowe, Vermont
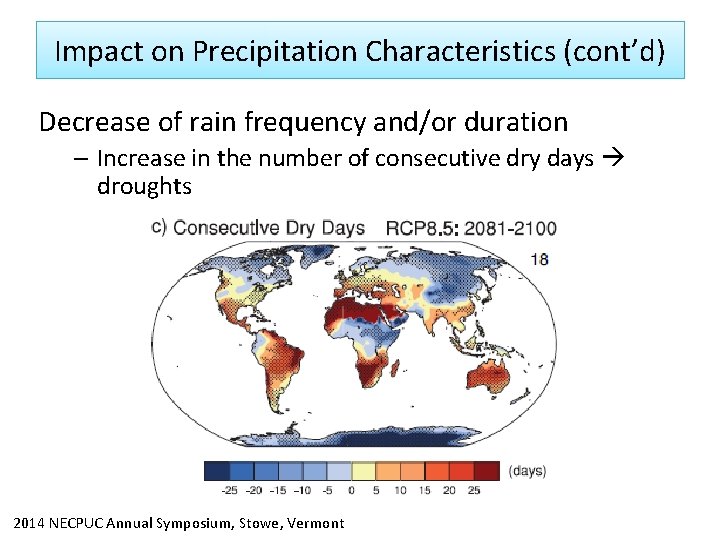
Impact on Precipitation Characteristics (cont’d) Decrease of rain frequency and/or duration – Increase in the number of consecutive dry days droughts 2014 NECPUC Annual Symposium, Stowe, Vermont
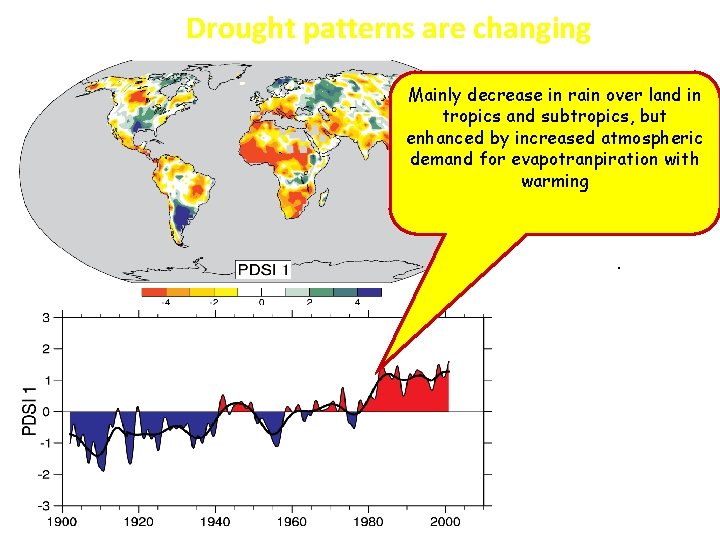
Drought patterns are changing Thein most Mainly decrease rainimportant over land in spatial pattern (top) tropics and subtropics, but of the monthly Palmer enhanced by increased atmospheric Drought Severity Index demand for evapotranpiration with (PDSI) for 1900 to 2002. warming The time series (below) accounts for most of the trend in PDSI.
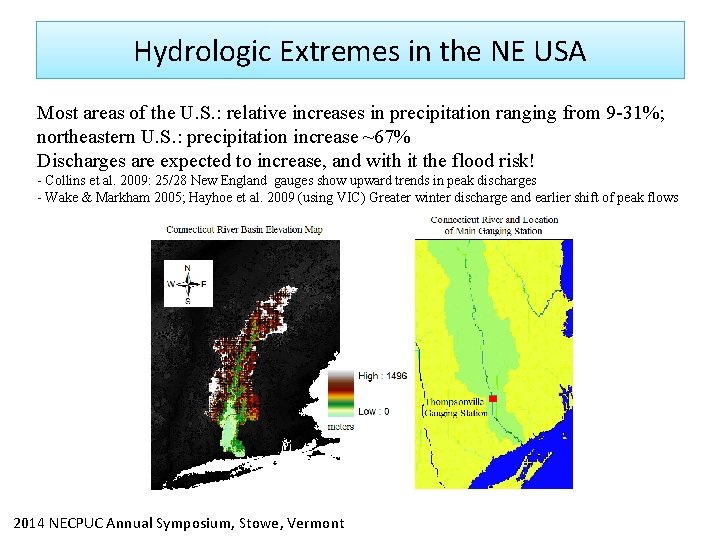
Hydrologic Extremes in the NE USA Most areas of the U. S. : relative increases in precipitation ranging from 9 -31%; northeastern U. S. : precipitation increase ~67% Discharges are expected to increase, and with it the flood risk! - Collins et al. 2009: 25/28 New England gauges show upward trends in peak discharges - Wake & Markham 2005; Hayhoe et al. 2009 (using VIC) Greater winter discharge and earlier shift of peak flows 2014 NECPUC Annual Symposium, Stowe, Vermont
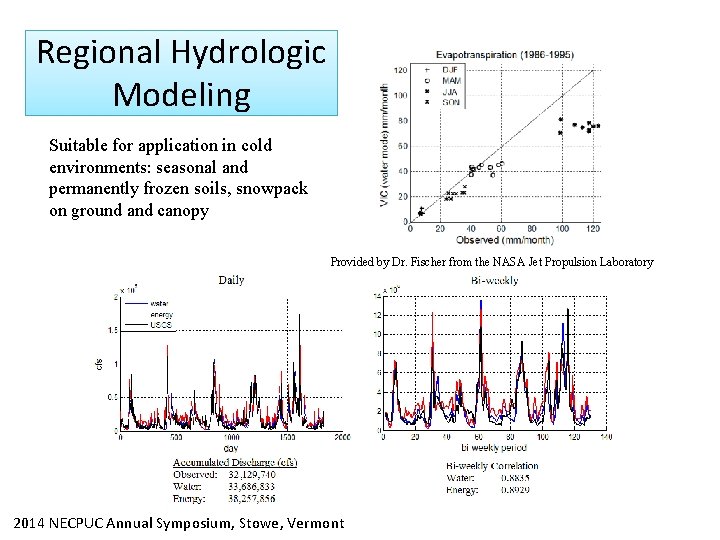
Regional Hydrologic Modeling Suitable for application in cold environments: seasonal and permanently frozen soils, snowpack on ground and canopy Provided by Dr. Fischer from the NASA Jet Propulsion Laboratory 2014 NECPUC Annual Symposium, Stowe, Vermont
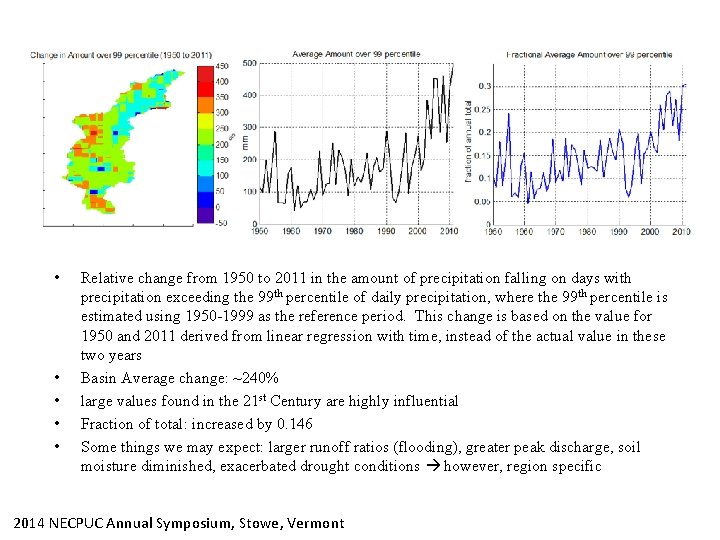
• • • Relative change from 1950 to 2011 in the amount of precipitation falling on days with precipitation exceeding the 99 th percentile of daily precipitation, where the 99 th percentile is estimated using 1950 -1999 as the reference period. This change is based on the value for 1950 and 2011 derived from linear regression with time, instead of the actual value in these two years Basin Average change: ~240% large values found in the 21 st Century are highly influential Fraction of total: increased by 0. 146 Some things we may expect: larger runoff ratios (flooding), greater peak discharge, soil moisture diminished, exacerbated drought conditions however, region specific 2014 NECPUC Annual Symposium, Stowe, Vermont
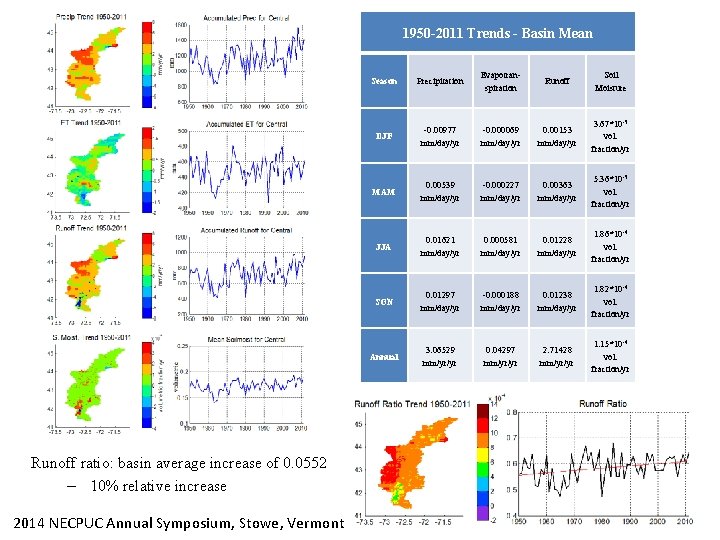
1950 -2011 Trends - Basin Mean Runoff ratio: basin average increase of 0. 0552 – 10% relative increase 2014 NECPUC Annual Symposium, Stowe, Vermont Season Precipitation Evapotranspiration Runoff Soil Moisture DJF -0. 00977 mm/day/yr -0. 000069 mm/day/yr 0. 00153 mm/day/yr 3. 67*10 -5 vol. fraction/yr MAM 0. 00539 mm/day/yr -0. 000227 mm/day/yr 0. 00363 mm/day/yr 5. 36*10 -5 vol. fraction/yr JJA 0. 01621 mm/day/yr 0. 000581 mm/day/yr 0. 01228 mm/day/yr 1. 86*10 -4 vol. fraction/yr SON 0. 01297 mm/day/yr -0. 000188 mm/day/yr 0. 01238 mm/day/yr 1. 82*10 -4 vol. fraction/yr Annual 3. 06529 mm/yr/yr 0. 04297 mm/yr/yr 2. 71428 mm/yr/yr 1. 15*10 -4 vol. fraction/yr
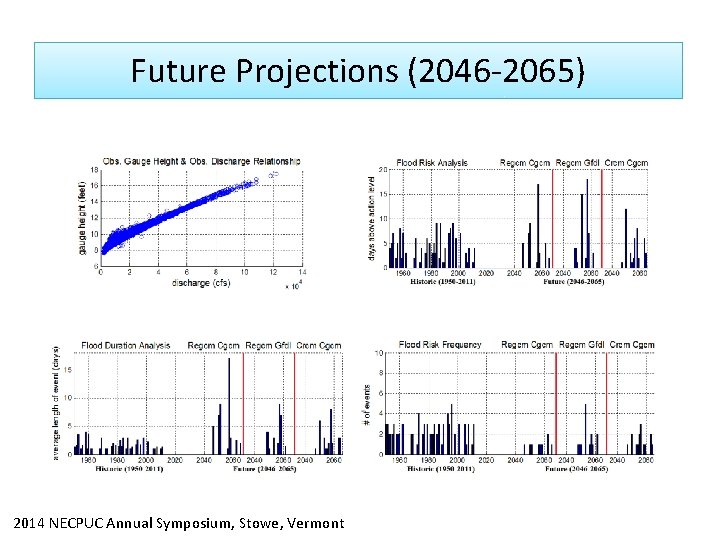
Future Projections (2046 -2065) 2014 NECPUC Annual Symposium, Stowe, Vermont
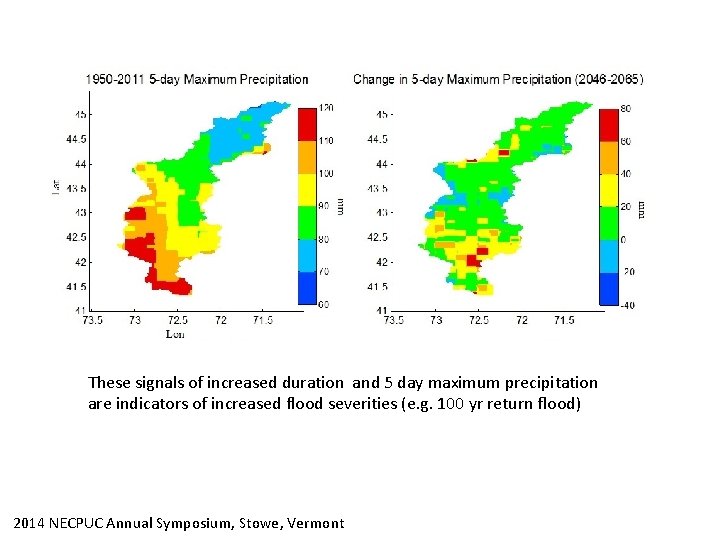
These signals of increased duration and 5 day maximum precipitation are indicators of increased flood severities (e. g. 100 yr return flood) 2014 NECPUC Annual Symposium, Stowe, Vermont
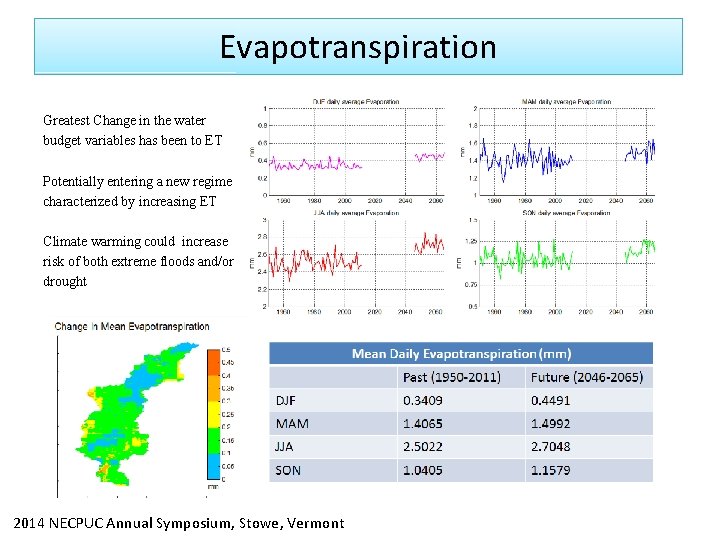
Evapotranspiration Greatest Change in the water budget variables has been to ET Potentially entering a new regime characterized by increasing ET Climate warming could increase risk of both extreme floods and/or drought 2014 NECPUC Annual Symposium, Stowe, Vermont
Conclusions • • Globally we expect both drought and flood risk changes due to changes in the precipitation patterns. The NE USA has been experiencing an increasingly wet regime during the latter part of the 20 th century through early 21 st century – indications of change towards more extreme precipitation, increasing discharge, increasing runoff ratio and negligible trend in ET • Significant increases in precipitation extremes have been almost entirely accounted for by increases to runoff Flood Risk How do these trends continue or change in the mid 21 th Century? • Precipitation extreme indicators remain statistically similar to early 21 th century • Flood Frequency has decreased, but the largest storms produce floods that persist for longer durations major events (100 yr return floods) present a greater risk • NE has gone from a slightly increasing ET trend to a large increase (~8% in the summer) possible acceleration of the hydrologic cycle • It is possible the NE US will enter a new climate regime characterized by greater drought and flood risks 2014 NECPUC Annual Symposium, Stowe, Vermont