Climate Change Bangalore Science Politics and Action Sharachchandra

Climate Change & Bangalore: Science, Politics and Action Sharachchandra Lele Env & Dev group Ashoka Trust for Research in Ecology and the Environment

Outline 1: Science • how climate works and role of GHGs • historical temperatures and evidences of change • Projections • Likely impacts

Earth’s Energy Balance Model 1: /4 = T 4. = 1368 W/m 2 T= 279 K Model 2: (1 -a) /4 = T 4. a = 0. 31 T= 254 K. (Adding an albedo is better science but gives a worse result. ) Actual Te = 288 K. Missing: An atmosphere with a greenhouse effect (responsible for 34 K of warming).
 • Carbon Dioxide & Water Vapour • Methane, ozone, nitrous oxide,")
Greenhouse Gases (GHG) • Carbon Dioxide & Water Vapour • Methane, ozone, nitrous oxide, chlorofluourocarbons (CFC)
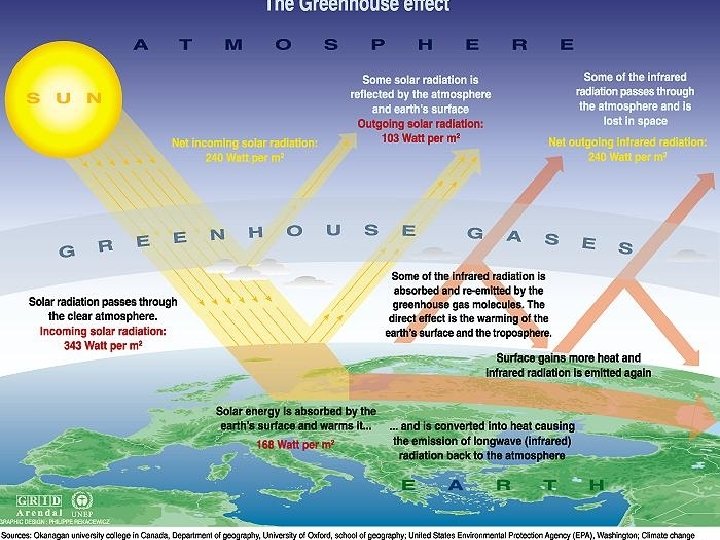

Note • Greenhouse gases make life on Earth possible, but too much is bad

Differences in GHGs • Different effectiveness of warming – Depends on lifetime in atmosphere – Efficiency of molecule • Described by global warming potential (GWP) • Different contributions • CO 2 around 60%~80% of historical warming

Evidence of CC

Mauna Loa CO 2 data, 1958 -2004 Source: Oak Ridge National Laboratory, Carbon Dioxide Information Analysis Center http: //cdiac. ornl. gov/trends/co 2/graphics/mlo 145 e_thrudc 04. pdf

Temperature Rise


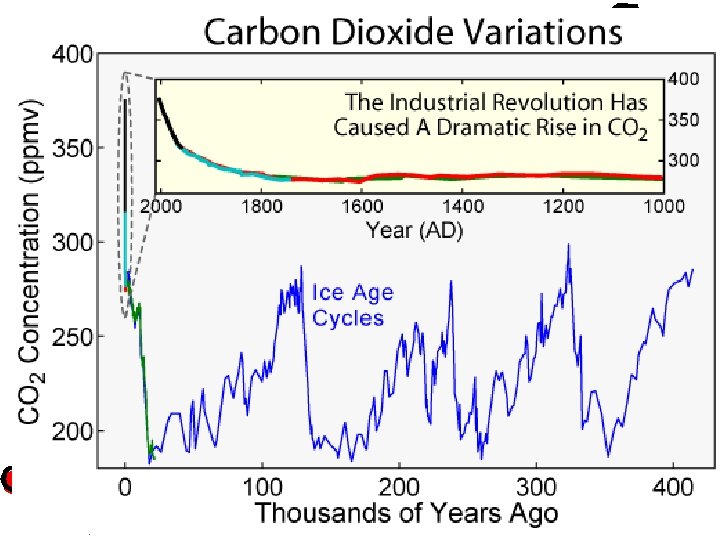
Temperature, CO 2, and methane track each other CO 2, CH 4 and estimated global temperature (Antarctic ΔT/2 in ice core era) 0 = 1880 -1899 mean. Source: Hansen, Clim. Change, 68, 269, 2005.

Projections

IEA Projection for World Primary Energy Demand 18 000 16 000 14 000 Oil Mtoe 12 000 10 000 8 000 Gas 6 000 Coal 4 000 2 000 0 1971 Other renewables 1980 1990 2000 2010 2020 Nuclear Hydro 2030 Oil and gas together account for more than 60% of the growth in energy demand between now and 2030 in the Reference Scenario

World Energy-Related CO 2 Emissions Global emissions grow 50% between now and 2030, and developing countries’ emissions will overtake OECD’s in the 2020 s

Energy-Related CO 2 Emissions 2003 2030 24 Gt 37 Gt Global emissions grow by just over half between 2003 & 2030, with the bulk of the increase coming from developing countries

Predictions Multi-model averages and assessed ranges for surface warming Continued emissions will lead to further warming of 1. 8ºC to 4ºC over the 21 st century, depending on different scenarios IPCC
 • Average temperature rise (old focus) • Increased frequency of extreme evenets")
Impacts (Global) • Average temperature rise (old focus) • Increased frequency of extreme evenets (more cyclones, more droughts) • Melting of polar ice • Stopping of gulf stream (ice age in Europe) • Sea level rise, coastal inundation
 • NOTE: we know very little of the details • Melting of")
Impacts (India) • NOTE: we know very little of the details • Melting of Himalayan ice stocks, and permafrost in Tibet>>changes in river flows • More monsoon failures, or extreme events in an already monsoonal climate • Collapse of monsoon system? • Increased ET >>crop stress • Sea level rise and resulting inundation • Complex effects: e. g. , disease vectors

What is required to avert ‘catastrophic CC’? • Catastrophic CC tentatively defined as >2 deg C rise • 50%-85% reduction in global emissions of GHGs required by 2050 • Many are now saying even this will not be sufficient

Politics of climate change • Who is to blame and how much? • Who should respond and how?

Who has contributed? • Historically, LDCs have contributed only 20% or less • In recent year: India ~1, 750 million t. CO 2 e in 2005 = 5% of the global GHG emission rate • In per capita terms, India = 1. 3 t. CO 2 e in 1994, rising to 1. 9 t. CO 2 e in 2004 (still using 1994 population), • So India is ranked 146 th amongst all countries. • In contrast, per capita emissions of the USA were around 23 t. CO 2 e in 2004. • European countries are lower than USA but still much higher than LDCs

Where do we need to go? • In per capita terms, to avert catastrophic CC requires limiting GHG emissions to ~3 t. CO 2 e/yr

Core problems 1. 2. 3. 4. Non-acceptance of CC as a probem (USA position till recently!) Refusal to think in per capita terms or some such equitable responsibility framework Equity has many dimensions 1. 2. 3. 4. 5. Historical contributions or present emissions only? Per capita using which population? Capacity to respond (affluence) or simply equal Extent of impact (e. g. , coastal) or simply equal Etc etc BUT, whatever the model, North has to cut back drastically and help the South also

Core problems 2 • If commitments are to be made, North insists on trading

Indian position so far • We did not create the problem • We are not currently contributing much (‘ 6 th largest emitter language makes little sense’) • Even if we introduce dramatic changes, our contribution to the desired reductions will be small • We cannot afford to cut back • We have a right to pollute in order to develop • We are anyway doing a lot • We need a lot of financial and tech transfer • Best way to adapt is to develop • We will not make binding commitments but we are willing to make some money out of trading (? !)

Limitations of this position 1 • Science: – if the goal is 3 t. CO 2 e/cap, we will have to move away from business-as-usual anyway • TERI 2008: ~5 t. CO 2/capita in 2031 under business-as-usual – Current policies will put in place huge infrastructure that will be difficult to change – North does not have the technology to help us anyway

Limitations 2 • Ethical: – There is no undifferentiated “we”: Indian elite is emitting at high level – We cannot use Northern inaction to sidetrack us from environment-worthy actions today – LARGER PICTURE: current developmental model needs to be questioned anyway! – CC overlaps with other problems

Limitations 3 • Strategic: – We will feel the burden of impact heavily, so some compromise that leads to a climate treaty will be ok – At least invest in adaptation – We are early in the curve: develop technologies that we can actually market to the North

Bangalore level issues • Focus on Mitigation or adaptation? • Dilemmas of unilateral mitigation efforts (national or local) – How does it help if no one else is doing it – Will we get co-opted, or undermine our equity position? • Can we find win-win with other local issues?

Possible overlaps • Air pollution and CO 2 emissions • Traffic and CO 2 emissions • Electricity scarcity, building energy, & CO 2 emissions • Water scarcity and CC adaptation
- Slides: 32