Climate Change and Projection for Asia Data and


 Center")


- Slides: 18
Climate Change and Projection for Asia Data and Uncertainty
Modeling the climate processes AND Model Outputs for Climate Change Analysis Climate model is reduced complexity numerical system, which simulates one possible time evolution in which the major features have a response to primary forcing similar to the real world.
SNU RCM Downscaled Climate Change for East Asia Region
SNU RCM Downscaled Climate Change for East Asia Region
Dispersion and Inconsistency in downscaling Seasonal Cycles by RMIP models
Dispersion and Inconsistency in climate projections
Dispersion and Inconsistency in climate projection RMIP downscaled Precipitation changes South China ΔP(mm/day) Center China
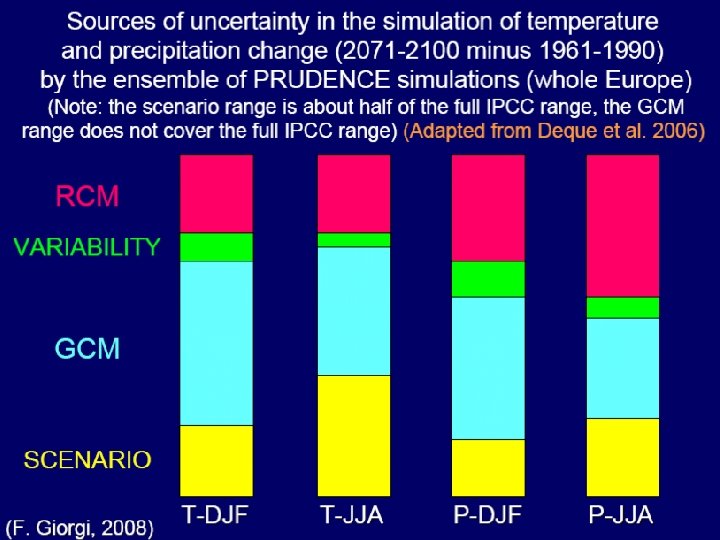
Sources of Uncertainty
Interannual variability for future climate by multi-RCMs Asia Ocean Land Annual T Trends for 2040 -2070 (c/10 yr)
Ensembles in RMIP
Ensembles in RMIP
Ensembles in RMIP
Ensembles in RMIP
Ensembles in RMIP • Ensemble averages work well for mean climate; • Explorer the best methods for evaluating changes and extremes; • Use ensemble spread to inform uncertainty;
Model outputs and Observation • For surface climate: – Daily average MSLP, maximal/minimal temperature, surface wind speed (optional) – 3 -hourly: 2 m temperature, RH, convective precipitation, large scale precipitation, evaporation, 10 m wind (U, V) (optional, depending on individual model) • For upper level atmosphere – Daily average: U, V, T, H at 200, 500, 850 h. Pa • Observation – CRU surface temperature, OISST – APHRODITE and GPCP Precipitation
RMIP data • http: //rmip. nju. edu. cn, available soon, • Contact wsy@nju. edu. cn
Thank you!