Climate Change and Climate Projection IPCC Report Climate


 global average surface temperature, (b) global average sea level from")


 is denoted by the")
 • Changes in ENSO interannual variability differ from")
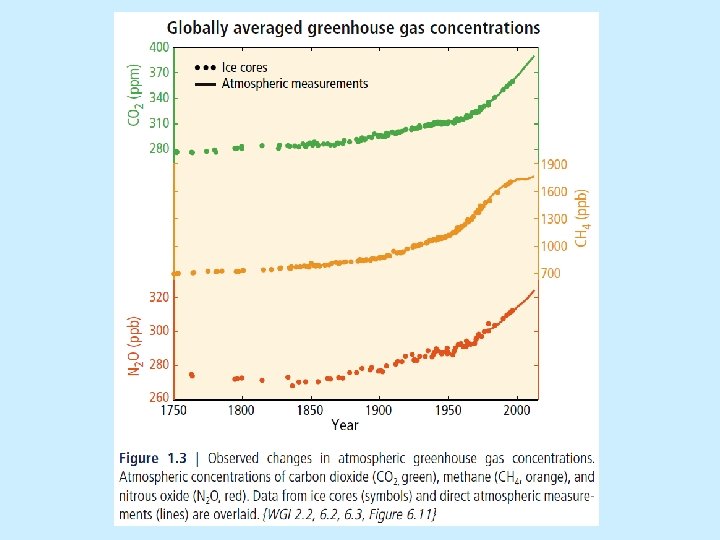
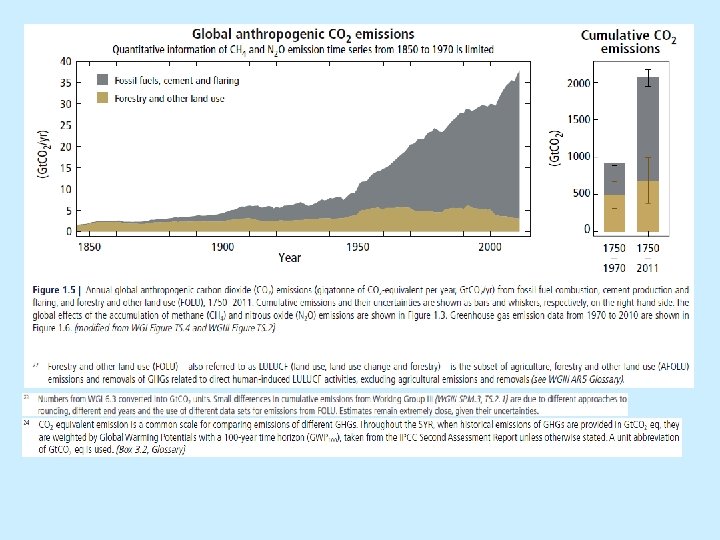
. ) • The increase in greenhouse gases in")


- Slides: 44
Climate Change and Climate Projection ---- IPCC Report • Climate change in recent decades • Emission scenarios of greenhouse gases • Projections of climate change 1
Topic 1: Observed Changes and their Causes
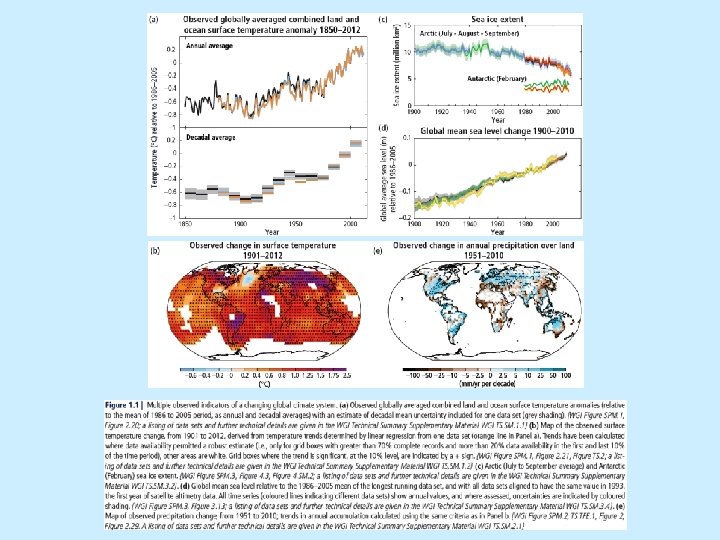
Observed changes in (a) global average surface temperature, (b) global average sea level from tide gauge (blue) and satellite (red) data and (c) Northern Hemisphere snow cover for March-April. All changes are relative to corresponding averages for the period 1961– 1990. Smoothed curves represent decadal average values while circles show yearly values. The shaded areas are the uncertainty intervals estimated from a comprehensive analysis of known uncertainties (a and b) and from the time series (c). {FAQ 3. 1, Figure 4. 2, Figure 5. 13} ENSC 425/625 UNBC 4
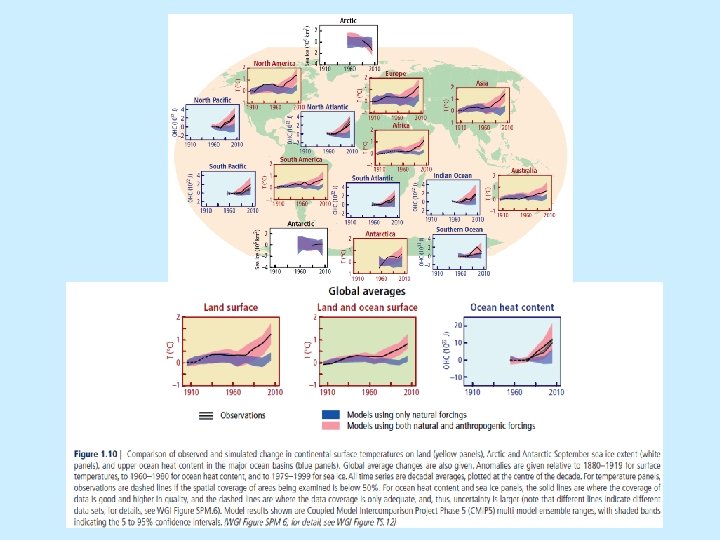
Comparison of observed continental- and global-scale changes in surface temperature with results simulated by climate models using natural and anthropogenic forcings. Decadal averages of observations are shown for the period 1906 to 2005 (black line) plotted against the centre of the decade and relative to the corresponding average for 1901– 1950. Lines are dashed where spatial coverage is less than 50%. Blue shaded bands show the 5– 95% range for 19 simulations from five climate models using only the natural forcings due to solar activity and volcanoes. Red shaded bands show the 5– 95% range for 58 simulations from 14 climate models using both natural and anthropogenic forcings. {FAQ 9. 2, Figure 1} ENSC 425/625 UNBC 5
• AR 4 • AR 5 7
• AR 4 • AR 5 8
ENSC 425/625 UNBC 10
ENSC 425/625 UNBC 11
Ocean Acidification • Anthropogenic ocean acidification refers to the component of p. H reduction that is caused by human activity. • CO 2 increases to 392 ppm in 2012 from 280 ppm at the beginning of the industrial era. The oceans have absorbed approximately 155 Pg. C (petagram of carbon = 10^12 kg carbon) from the atmosphere over the last two and a half centuries. • The ocean’s uptake of CO 2 has a significant impact on the chemistry of seawater. The average p. H of ocean surface waters has already fallen by about 0. 1 units, from about 8. 2 to 8. 1 (total scale), since the beginning of the industrial revolution. By the end of this century, the average surface ocean p. H could be lower than it has been for more than 50 million years. • When CO 2 reacts with seawater it forms carbonic acid (H 2 CO 3), which is highly reactive and reduces the concentration of carbonate ion and can affect shell formation for marine animals such as corals, plankton, and shellfish. This process could affect fundamental biological and chemical processes of the sea. ENSC 425/625 UNBC 12
ENSC 425/625 UNBC 13
ENSC 425/625 UNBC 14
global ocean inventory of anthropogenic carbon dioxide ENSC 425/625 UNBC 15
• AR 4 • AR 5 16
Extreme events Changes in many extreme weather and climate events have been observed since about 1950. Some of these changes have been linked to human influences, including a decrease in cold temperature extremes, an increase in warm temperature extremes, an increase in extreme high sea levels and an increase in the number of heavy precipitation events in a number of regions. • It is very likely that the number of cold days and nights has decreased and the number of warm days and nights has increased on the global scale. • There is medium confidence that the observed warming has increased heat-related human mortality and decreased cold related human mortality in some regions. • There are likely more land regions where the number of heavy precipitation events has increased than where it has decreased. • There is low confidence that anthropogenic climate change has affected the frequency and magnitude of fluvial floods on a global scale. • There is low confidence in observed global-scale trends in droughts, due to lack of direct observations, dependencies of inferred trends on the choice of the definition for drought, and due to geographical inconsistencies in drought trends. • There is low confidence that long-term changes in tropical cyclone activity are robust, and there is low confidence in the attribution of global changes to any particular cause. • It is likely that extreme sea levels (for example, as experienced in storm surges) have increased since 1970, being mainly the result of mean sea level rise. • Impacts from recent climate-related extremes, such as heat waves, droughts, floods, cyclones and wildfires, reveal significant vulnerability and exposure of some ecosystems and many human systems to current climate variability (very high confidence). • Direct and insured losses from weather-related disasters have increased substantially in recent decades, both globally and regionally.
Human responses to climate change: adaptation and mitigation Adaptation and mitigation experience is accumulating across regions and scales, even while global anthropogenic greenhouse gas emissions have continued to increase. • Adaptation is becoming embedded in some planning processes, with more limited implementation of responses (high confidence). • Governments at various levels have begun to develop adaptation plans and policies and integrate climate change considerations into broader development plans. • Global increases in anthropogenic emissions and climate impacts have occurred, even while mitigation activities have taken place in many parts of the world.
Topic 2: Future Climate Changes, Risk and Impacts
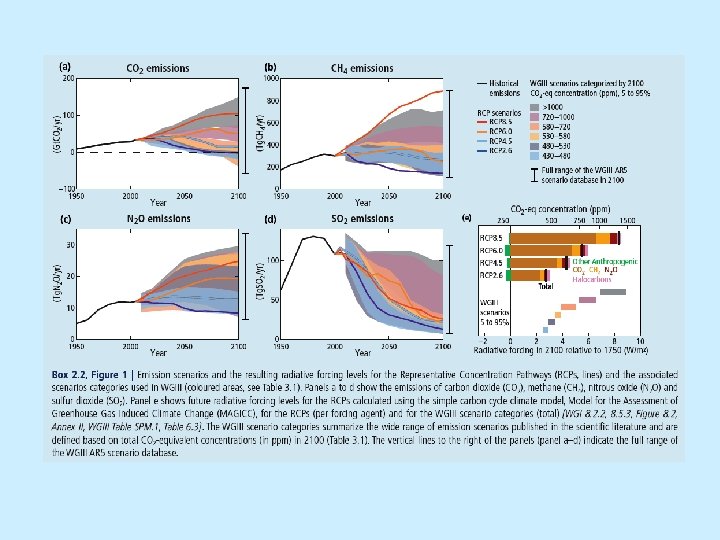
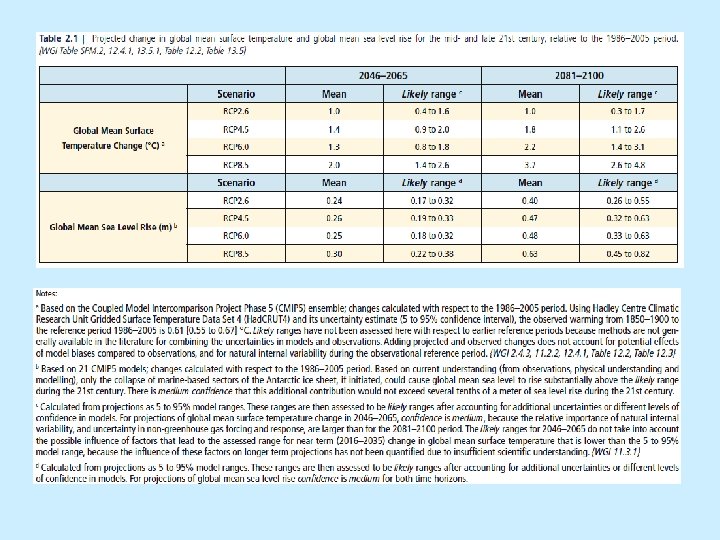
• AR 5: Scenarios RCP 2. 6 W m-2 RCP 4. 5 W m-2 RCP 6. 0 W m-2 RCP 8. 5 W m-2 26
• AR 5 28
• AR 4 • AR 5 29
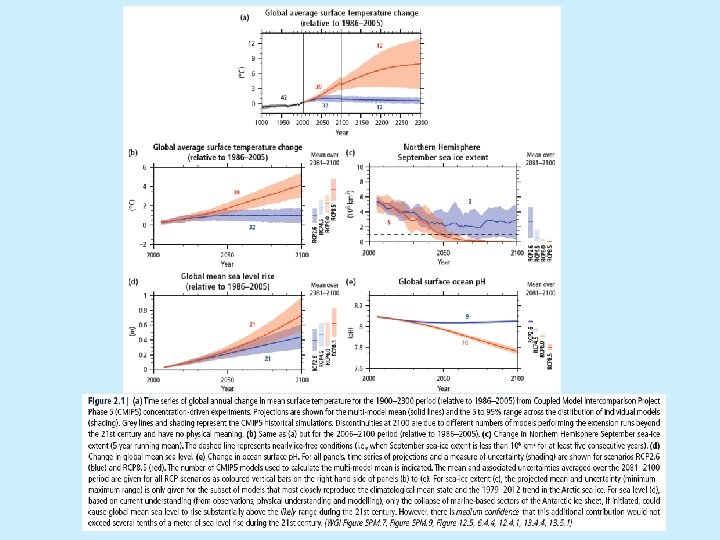
AR 5 All changes are relative to corresponding averages for the period 1961– 1990. The shaded areas are the uncertainty intervals estimated from a comprehensive analysis of known uncertainties (a and b) and from the time series (c). 30
• All of North America is very likely to warm during this century, and the annual mean warming is likely to exceed the global mean warming in most areas. In northern regions, warming is likely to be largest in winter, and in the southwest USA largest in summer. The lowest winter temperatures are likely to increase more than the average winter temperature in northern North America, and the highest summer temperatures are likely to increase more than the average summer temperature in the southwest USA. • Annual mean precipitation is very likely to increase in Canada and the northeast USA, and likely to decrease in the southwest USA. In southern Canada, precipitation is likely to increase in winter and spring, but decrease in summer. • Snow season length and snow depth are very likely to decrease in most of North America, except in the northernmost part of Canada where maximum snow depth is likely to increase. ENSC 425/625 UNBC 35
El Nino The change in El Niño variability (vertical axis) is denoted by the ratio of the standard deviation of the first EOF of sea level pressure (SLP) between the current climate and in the future, ENSC 425/625 UNBC 36
El Nino (Ch. 10 – IPCC) • Changes in ENSO interannual variability differ from model to model. There is no statistically significant changes in the amplitude or frequency of ENSO variability in the future. ENSC 425/625 UNBC 37
Thermohaline Circulation (Meridional Overturning circulation (MOC). ) • The increase in greenhouse gases in the atmosphere leads to decrease of the density of the surface waters in the North Atlantic due to warming or a reduction in salinity, the strength of the MOC is decreased. • There is still a large spread among the models simulated reduction in the MOC, ranging from no response to a reduction of over 50% by the end of the 21 st century. ENSC 425/625 UNBC 38
• All of North America is very likely to warm during this century, and the annual mean warming is likely to exceed the global mean warming in most areas. In northern regions, warming is likely to be largest in winter, and in the southwest USA largest in summer. The lowest winter temperatures are likely to increase more than the average winter temperature in northern North America, and the highest summer temperatures are likely to increase more than the average summer temperature in the southwest USA. • Annual mean precipitation is very likely to increase in Canada and the northeast USA, and likely to decrease in the southwest USA. In southern Canada, precipitation is likely to increase in winter and spring, but decrease in summer. • Snow season length and snow depth are very likely to decrease in most of North America, except in the northernmost part of Canada where maximum snow depth is likely to increase. ENSC 425/625 UNBC 39
ENSC 425/625 UNBC 40
Observations of Changes in Climate: Atmosphere and Surface • • • Robust Findings: Global mean surface temperatures continue to rise. Eleven of the last 12 years rank among the 12 warmest years on record since 1850. Rates of surface warming increased in the mid-1970 s and the global land surface has been warming at about double the rate of ocean surface warming since then. Changes in surface temperature extremes are consistent with warming of the climate. • Estimates of mid- and lower-tropospheric temperature trends have substantially improved. Lower-tropospheric temperatures have slightly greater warming rates than the surface from 1958 to 2005. • Long-term trends from 1900 to 2005 have been observed in precipitation amount in many large regions. • Increases have occurred in the number of heavy precipitation events. • Droughts have become more common, especially in the tropics and subtropics, since the 1970 s. • Tropospheric water vapour has increased, at least since the 1980 s. 41
Snow, Ice and Frozen Ground Robust Findings: • The amount of ice on the Earth is decreasing. There has been widespread retreat of mountain glaciers since the end of the 19 th century. The rate of mass loss from glaciers and the Greenland Ice Sheet is increasing. {4. 5, 4. 6} • The extent of NH snow cover has declined. Seasonal river and lake ice duration has decreased over the past 150 years. • Since 1978, annual mean arctic sea ice extent has been declining and summer minimum arctic ice extent has decreased. • Ice thinning occurred in the Antarctic Peninsula and Amundsen shelf ice during the 1990 s. Tributary glaciers have accelerated and complete breakup of the Larsen B • Ice Shelf occurred in 2002. • Temperature at the top of the permafrost layer has increased by up to 3°C since the 1980 s in the Arctic. The maximum extent of seasonally frozen ground has decreased by about 7% in the NH since 1900, and its maximum depth has decreased by about 0. 3 m in Eurasia since the mid-20 th century. 42
Key Uncertainties: • There is no global compilation of in situ snow data prior to 1960. Well- calibrated snow water equivalent data are not available for the satellite era. • There are insufficient data to draw any conclusions about trends in the thickness of antarctic sea ice. • Uncertainties in estimates of glacier mass loss arise from limited global inventory data, incomplete area-volume relationships and imbalance in geographic coverage. • Mass balance estimates for ice shelves and ice sheets, especially for Antarctica, are limited by calibration and validation of changes detected by satellite altimetry and gravity measurements. • Limited knowledge of basal processes and of ice shelf dynamics leads to large uncertainties in the understanding of ice fl ow processes and ice sheet stability. 43
Key Uncertainties: • The full range of processes leading to modification of cloud properties by aerosols is not well understood and the magnitudes of associated indirect radiative effects are poorly determined. • The causes of, and radiative forcing due to stratospheric water vapour changes are not well quantified. • The geographical distribution and time evolution of the radiative forcing due to changes in aerosols during the 20 th century are not well characterised. • The causes of recent changes in the growth rate of atmospheric CH 4 are not well understood. • The roles of different factors increasing tropospheric ozone concentrations since pre-industrial times are not well characterised. • Land surface properties and land-atmosphere interactions that lead to radiative forcing are not well quantified. • Knowledge of the contribution of past solar changes to radiative forcing on the time scale of centuries is not based upon direct measurements and is hence strongly dependent upon physical understanding. ENSC 425/625 UNBC 44