Climate Change and Arizona A brief overview Mike

Climate Change and Arizona: A brief overview Mike Crimmins Assoc. Professor/Extension Specialist Dept. of Soil, Water, & Environmental Science & Arizona Cooperative Extension The University of Arizona

Presentation Overview • Climatic Context • Greenhouse Effect and Climate Change • Scenarios and Projections • Potential Implications for Arizona

Climate change and my garden…why should I care? • Water • Choosing what and when to plant each season • Long-term commitments to trees and shrubs • Pests and crud

Climatic Context

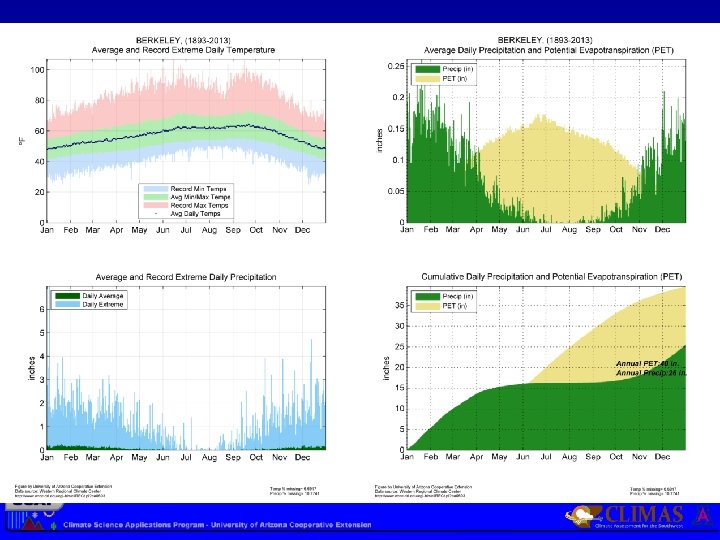
100 F 32 F Climate of Tucson

Hydrologic Cycle and Aridity

Climate of Tucson

Example Water Balance: Walnut Gulch, Arizona http: //www. tucson. ars. ag. gov/dap/field_sites. htm

Observed changes

Precipitation: 1000 -1988 1980’s pluvial 2002 drought http: //www. climas. arizona. edu/tools/paleoclimate

Climate Data Time Series Western Regional Climate Center http: //www. wrcc. dri. edu/wwdt/

1900 -2013 http: //www. wrcc. dri. edu/wwdt/time/

1900 -2013 10 of 14 years since 2000 below average precip Wet Dry SPI Drought Index: Annual Precipitation http: //www. wrcc. dri. edu/wwdt/time/

1900 -2013 9 of 14 years since 2000 above average temps Warm Cool http: //www. wrcc. dri. edu/wwdt/time/

1900 -2013 Wet 14 of 14 years since 2000 Warm/drier than average Dry SPI Drought Index: Annual Precipitation and Annual Avg. Temps. http: //www. wrcc. dri. edu/wwdt/time/

DRY Average Long-term Drought Short-term Drought http: //cals. arizona. edu/climate/misc/spi_contour. html WET

Climate Change Science

Carbon Dioxide, Methane, and Nitrous Oxide are major GHGs From http: //www. climatechange. gc. ca

Changes in greenhouse gases over the past 10, 000 years IPCC 2007

Global Temperature and Carbon Dioxide USGCRP 2009

Climate Change Modeling and Projections “…all models are wrong, but some are useful. ” --G. E. Box
")
Natural vs. Anthropogenic Forcings Observed Natural Only Stott et al. (2000)

http: //www. swcarr. arizona. edu/

Climate Projections Slide courtesy of G. Garfin http: //www. swcarr. arizona. edu
")
Temperature and Precipitation Projections for SW US A 2 Emissions Scenario (NCA-SW 2013)
")
Heat Waves • More frequent • Longer • More intense (NCA-SW 2013)
")
Cold Spells • Less frequent • Just as cold (NCA-SW 2013)

Frost-free Season Freeze Days High emission s A 2 Draft 2013 National Climate Assessment – Chapter 6: Agriculture Dry Days (NCA-SW 2013) Hot Nights
 for high emission scenario A 2 High Emissions Scenario")
Statistically downscaled precipitation changes (%) for high emission scenario A 2 High Emissions Scenario NCA-SW 2013)
")
Less Snow Less Runoff Less Soil Moisture A 2 High Emissions Scenario (NCA-SW 2013)

Implications for Arizona • Higher temperatures – Higher evaporation and transpiration rates (increased water loss in reservoirs, faster drying of soils following precip events, more stress on vegetation) – Less snow/more rain in winter; less snowpack for spring runoff, earlier pulse of precip/less water available in summer – Longer growing seasons; more extreme heat events, but freezes will still be possible • Precipitation – Projections are lower confidence – Higher temperatures on same precipitation variability: more intense drought periods – Increasing variability more flooding with intervening drought periods

Thanks! crimmins@u. arizona. edu http: //cals. arizona. edu/climate
- Slides: 33