Climate Change An Interdisciplinary Approach to Problem Solving
 Richard")
Climate Change: An Inter-disciplinary Approach to Problem Solving (AOSS 480 // NRE 480) Richard B. Rood Cell: 301 -526 -8572 2525 Space Research Building (North Campus) rbrood@umich. edu http: //aoss. engin. umich. edu/people/rbrood Winter 2017 April 6, 2017

Class Information and News • Canvas site: CLIMATE_480_001_W 17 – Record of course • Rood’s Class Media. Wiki Site – http: //climateknowledge. org/classes/index. php/Climate_Change: _The_Move_to_Action • Rood’s Class Tumblr Site: http: //openclimate. tumblr. com

Events and News • Elizabeth Kolbert, April 11, 2017, Ross – https: //erb. umich. edu/2017/01/24/elizabeth-kolbert-purpose-to-impact-speaker/ • Climate Blue – Applications for COP 23: Bonn – There is a deadline ~ April 19.

Homework Questions?
 http: //www. iea. org/ works")
Resources and Recommended Reading • International Energy Agency (IEA) http: //www. iea. org/ works to ensure reliable, affordable and clean energy for its 28 member countries and beyond. • Energy Information Administration (EIA) http: //www. eia. doe. gov/ keeps track of (inter)national energy use and future trends. – Frequently Asked Questions • The ‘wedge’ paper: “A plan to keep carbon in check” by Socolow and Pacala, Scientific American, 2006. (link) – This is an influential policy-oriented paper on how to reform energy sector while still achieving economic growth • Throughout the presentation

Resources and Recommended Reading • Rood Blogs – We Like to Burn Things – All the Oil We Want – No Energy Policy and Even Less Climate Policy – Earthquakes and Climate Change

Outline: Class 16, Winter 2017 • • Analysis: Kaya Identity Energy Supply International Policy: Paris Energy Consumption – Economic sectors – Agriculture – End use • Logic of Obama’s Plan • Wedges: It is possible

Energy by Source
 US OIL NATURAL")
Historical and Projected World Energy Use by Fuel daily consumption (2010) US OIL NATURAL GAS COAL 20 million barrels 60 billion cubic feet 3 million tons China 8 million barrels 4 billion cubic feet 10 million tons (US + China = 37% of World consumption in 2010) One cubic mile of oil per year Source: Exxon Mobil Energy Outlook, 2013 Thanks to Mark Barteau

International Policy: Paris • Placed a short and sweet slide deck by Avik Basu on Canvas Site as resource

A trillion tons of carbon • We get to emit a trillion tons of carbon to avoid “dangerous” climate change • Are we already experiencing “dangerous” climate change? • If we actually did this would it limit warming to ~ 2 degrees C? • Have we already committed to irreversible changes in ice and permafrost?

2015: Paris Agreement • Link to Paris Agreement • White House Fact Sheet on Paris Agreement • Intended Nationally Determined Contributions (INDC)

Set of References • Credibility of Paris Agreement • Outcomes of Paris (C 2 ES) • Emissions and Paris Goals – Emissions and Goals: Grantham (London School) – IEA: Emissions for COP 21 – UNEP: Emissions Gap

A global perspective on energy and climate To achieve stabilization at a 2°C warming, we would need to install ~900 ± 500 MW [mega-watts] of carbon emissions-free power generating capacity each day over the next 50 years. This is roughly the equivalent of a large carbon emissions-free power plant becoming functional somewhere in the world every day. In many scenarios, this pace accelerates after mid-century. . . even stabilization at a 4°C warming would require installation of 410 MW of carbon emissions-free energy capacity each day. Caldeira et al. 2003

Emissions Trajectories https: //www. climateinteractive. org/tools/scoreboard-science-and-data/

Mainstream approach – targets and timetables Paris From R. Pielke Jr. The Climate Fix

Outline: Class 16, Winter 2017 • • Analysis: Kaya Identity Energy Supply International Policy: Paris Energy Consumption – Economic sectors – Agriculture – End use • Logic of Obama’s Plan • Wedges: It is possible

Analysis: Kaya Identity

Kaya Identity • Climate, Energy, Population, Economy • Roger Pielke, Junior – The Climate Fix Book – The Climate Fix Lecture Slides – Fallacy of Magical Solutions

What tools do we have to reduce emissions? Factor Lever Approach to Policy P Population Less people Population management GDP/P GDP person Smaller economy Limit generation of wealth TE/GDP Energy intensity Increase efficiency Do same or more with less energy Carbon intensity Switch energy sources Generate energy with less emissions C/TE Carbon emissions = C = P * GDP -----P * TE ---GDP * C ---TE GDP Technology From R. Pielke Jr. The Climate Fix

Pielke Jr. argues • The need for technology to make solutions possible. • Inequity of wealth, access to basic resources, desire for economic growth makes energy use an imperative • Must go – From, we use too much energy, fossil fuels are cheap – To, we need more energy, fossil fuels are expensive

Managing Climate Complexity WEALTH LOCAL TEMPORAL NEAR-TERM LONG-TERM GLOBAL SPATIAL Being Global, Long Term, Wealth connected, degree of difficulty is high

Managing Energy Complexity COST MOBILITY FEW Stationary many # of Sources Cost of Fuel Cost of Waste Social Cost of Carbon Standing Infrastructure New Infrastructure R&D, Job Training, Education Moves Around
 Changes • Hydrogen Fuel Cells • Renewables and Renewable Portfolios –")
Energy Landscape (seemingly) Changes • Hydrogen Fuel Cells • Renewables and Renewable Portfolios – U. S. Trade and Solar Panels – Wind Tax Credit – Biofuels • Ethanol, Switch grass, Sugar, Algae • Fracking • Natural Gas Displacing Coal • Methane Leakage from Fracking

Emissions from economic sectors • Some of these numbers are out of date, but balance and message is consistent over time • Details at end of presentation
")
Emissions from economic sectors • Industrial: creating products from raw materials (mining, cement, agriculture) US energy use by sector • Commercial: stores, municipalities, etc. • Transportation: cars, planes, ships EIA Annual Energy Review, 2006
 Electricity Generation (39% of total) 42% Coal, 22% Natural Gas,")
US Energy Consumption (2014) Electricity Generation (39% of total) 42% Coal, 22% Natural Gas, 22% Nuclear, 8% Hydroelectric, 5% Other Renewables, <1% Petroleum Transportation Fuels (27 % of total) 92% Petroleum, 3% Natural Gas, 5% Renewables Very little overlap between energy sources for these two dominant sectors! Thanks to Mark Barteau

Agriculture: A different slice • This is a very complex way to look at the problem • (Some) Details at end of presentation

Agriculture: A different slice • UN Food and Agriculture Organization – Livestock’s Long Shadow • Agriculture’s Role in Greenhouse Gas Emissions • Livestock and Climate Change • Rood Blogs – Greenhouse Emissions of Agriculture – We Are What We Eat – How Much Does It Cost?

Agriculture • Use of direct fossil fuel energy relatively low: ~3– 4. 5 % in industrialized countries. – Half of used energy and direct CO 2 emissions are from fertilizer production (Haber-Bosch process) • BUT… big contributor to deforestation and land use change. • Livestock rearing is most significant contributor

Agriculture: Livestock • Responsible for ~18 % of CO 2 equivalent GHG emissions (so including N 2 O and CH 4) Same share as entire US! – 9 % of world CO 2 emissions • Fossil fuels burned to produce fertilizer • Deforestation and land use changes for feed production and grazing (bulk!) – 37 % of world CH 4 emissions • Fermentation in cattle stomachs (biggest anthropogenic source) • Animal manure – 65 % of N 2 O • Mostly from animal manure deposited on soils, with subsequent N 2 O emission

Energy consumption by end use • The three main end uses of fossil fuel are: – Electric power plants (~40 % of CO 2 emissions) – Transportation (~23 % of CO 2 emissions) – Direct use of fuel (industrial processes and heating for buildings) (~37 % of CO 2 emissions) • So ~40 % CO 2 emissions from electricity, 60 % from fuels World CO 2 emissions by fuel and end use Socolow and Pacala , 2006
 • CAFE Standards")
Obama Climate Action Plan • Clean Power Plan (Coal Power Plants) • CAFE Standards (Cars) • Energy Efficiency – Energy Star – Building Renovation

Mitigation Wedges • “Practical” or “Possible” Response Space

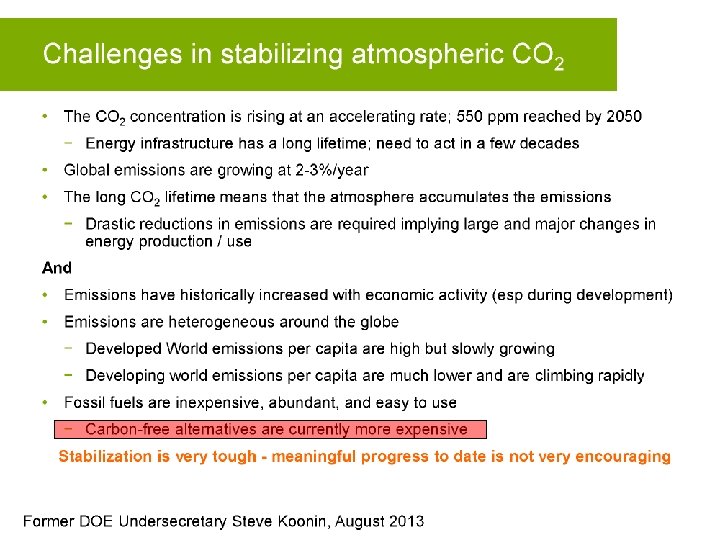
From Lecture on International Policy • “Avoid dangerous climate change” – Avoid 2°C (1. 5°C) global average warming – Keep carbon dioxide ( + other greenhouse gases) to less than 450 ppm equivalent – Or equivalent of One Trillion Tons of Carbon
 Data and more information")
Increase of Atmospheric Carbon Dioxide (CO 2) Data and more information

Past Emissions Princeton Carbon Mitigation Initiative

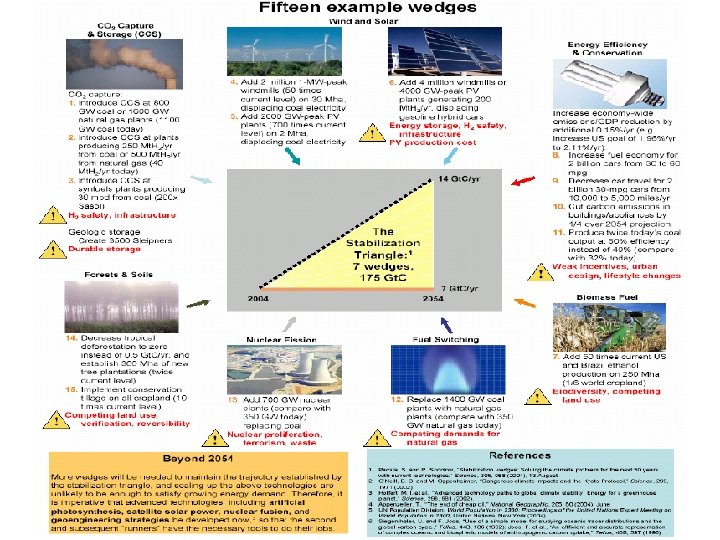
The Stabilization Triangle Princeton Carbon Mitigation Initiative

The Wedge Concept Princeton Carbon Mitigation Initiative
 Princeton Carbon Mitigation Initiative")
Stabilization (2006) Princeton Carbon Mitigation Initiative
 • Stabilize at < 550 ppm. Pre -industrial: 275")
CO 2 stabilization trajectory (2006) • Stabilize at < 550 ppm. Pre -industrial: 275 ppm, current: ~400 ppm. • Need 7 ‘wedges’ of prevented CO 2 emissions.
 Princeton Carbon Mitigation Initiative")
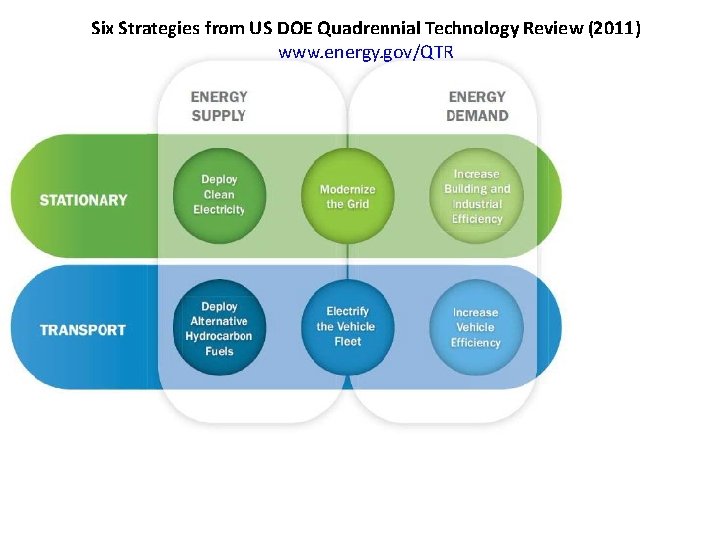
(2011) Princeton Carbon Mitigation Initiative

Where Do We Sit? • Concept that we can take these actions to limit emissions. • Growing population. • Economic and development imperatives. • Need for more energy. • Technological development. • Societal inertia.

Energy Futures

Energy Decarbonization Tools: 1. Efficiency Gains • The low-hanging fruit • Essentially three kinds: – End-use electricity efficiency (fluorescent bulbs instead of incandescent bulbs, buildings / insulation) – Energy generation efficiency (coal plant operating at 60 % efficiency instead of current 40 %) – Transportation efficiency (60 mpg instead of 30 mpg) • Efficiency gains are generally cheap mitigation options • But will only get so far before cutting into primary energy used for economic activity

Mc. Kinsey 2007: Large

Material for Next Lecture

IEA Plots of Energy Balance and Use • • IEA Statistics IEA Energy Balances IEA Graphics: Sankey Diagram IEA Glossary: for Balances

Trend of fossil fuel use IEA on Renewables • In ‘businessas-usual’ fossil fuels will continue to dominate world energy • Currently rapid increase of coal use, globally. International Energy Outlook, EIA, 2007
 Changes • Hydrogen Fuel Cells • Renewables and Renewable Portfolios –")
Energy Landscape (seemingly) Changes • Hydrogen Fuel Cells • Renewables and Renewable Portfolios – U. S. Trade and Solar Panels – Wind Tax Credit – Biofuels • Ethanol, Switch grass, Sugar, Algae • Fracking • Natural Gas Displacing Coal • Methane Leakage from Fracking

Emissions from economic sectors • Some of these numbers are out of date, but balance and message is consistent over time • Details at end of presentation
")
Emissions from economic sectors • Industrial: creating products from raw materials (mining, cement, agriculture) US energy use by sector • Commercial: stores, municipalities, etc. • Transportation: cars, planes, ships EIA Annual Energy Review, 2006
 Electricity Generation (39% of total) 42% Coal, 22% Natural Gas,")
US Energy Consumption (2014) Electricity Generation (39% of total) 42% Coal, 22% Natural Gas, 22% Nuclear, 8% Hydroelectric, 5% Other Renewables, <1% Petroleum Transportation Fuels (27 % of total) 92% Petroleum, 3% Natural Gas, 5% Renewables Very little overlap between energy sources for these two dominant sectors! Thanks to Mark Barteau

Agriculture: A different slice • This is a very complex way to look at the problem • (Some) Details at end of presentation

Agriculture: A different slice • UN Food and Agriculture Organization – Livestock’s Long Shadow • Agriculture’s Role in Greenhouse Gas Emissions • Livestock and Climate Change • Rood Blogs – Greenhouse Emissions of Agriculture – We Are What We Eat – How Much Does It Cost?

Agriculture • Use of direct fossil fuel energy relatively low: ~3– 4. 5 % in industrialized countries. – Half of used energy and direct CO 2 emissions are from fertilizer production (Haber-Bosch process) • BUT… big contributor to deforestation and land use change. • Livestock rearing is most significant contributor

Agriculture: Livestock • Responsible for ~18 % of CO 2 equivalent GHG emissions (so including N 2 O and CH 4) Same share as entire US! – 9 % of world CO 2 emissions • Fossil fuels burned to produce fertilizer • Deforestation and land use changes for feed production and grazing (bulk!) – 37 % of world CH 4 emissions • Fermentation in cattle stomachs (biggest anthropogenic source) • Animal manure – 65 % of N 2 O • Mostly from animal manure deposited on soils, with subsequent N 2 O emission

End use • Details at end of presentation

Energy consumption by end use • The three main end uses of fossil fuel are: – Electric power plants (~40 % of CO 2 emissions) – Transportation (~23 % of CO 2 emissions) – Direct use of fuel (industrial processes and heating for buildings) (~37 % of CO 2 emissions) • So ~40 % CO 2 emissions from electricity, 60 % from fuels World CO 2 emissions by fuel and end use Socolow and Pacala , 2006

Analysis: Kaya Identity

Kaya Identity • Climate, Energy, Population, Economy • Roger Pielke, Junior – The Climate Fix Book – The Climate Fix Lecture Slides – Fallacy of Magical Solutions

What tools do we have to reduce emissions? Factor Lever Approach to Policy P Population Less people Population management GDP/P GDP person Smaller economy Limit generation of wealth TE/GDP Energy intensity Increase efficiency Do same or more with less energy Carbon intensity Switch energy sources Generate energy with less emissions C/TE Carbon emissions = C = P * GDP -----P * TE ---GDP * C ---TE GDP Technology From R. Pielke Jr. The Climate Fix
*(GDP/person) *(energy/unit GDP)")
So why has energy consumption increased so much? Energy use = (population)*(GDP/person) *(energy/unit GDP) • GDP/person is considered the “societal success” • Energy use increases have been driven by growth in population and GDP/person.

Pielke Jr. argues • The need for technology to make solutions possible. • Inequity of wealth, access to basic resources, desire for economic growth makes energy use an imperative • Must go – From, we use too much energy, fossil fuels are cheap – To, we need more energy, fossil fuels are expensive

Mainstream approach – targets and timetables Paris From R. Pielke Jr. The Climate Fix

Emissions Trajectories https: //www. climateinteractive. org/tools/scoreboard-science-and-data/

Summary: Class 16, Winter 2017 • Analysis: Kaya Identity • Energy Supply • Energy Consumption – Economic sectors – Agriculture – End use

Summary: Class 16, Winter 2017 • Energy Supply • Energy Consumption – Economic sectors – Agriculture – End use • Analysis: Kaya Identity

Outline: Class 16, Winter 2017 • Energy Supply • Energy Consumption – Economic sectors – Agriculture – End use • Analysis: Kaya Identity

Appendix: Supplementary Slides • • • Details on coal, oil and natural gas Details on sectors Details on agriculture Details on end use Interesting and complex summary graphic from Department of Energy • Air quality and aerosols • Responses to manage emissions

CO 2 source: Deforestation Fossil fuels Deforestation Total 320 200 Gt. C 520 Compare with 590 Gt. C in the preindustrial atmosphere • Deforestation is thus an important part of climate change: – It accounts for ~20 % of current CO 2 emissions – It accounted for ~35 % of total CO 2 emissions since preindustrial times.

In what forms do we consume energy? • Fossil fuels: – Coal – Oil – Natural gas • Other: – Nuclear – Hydro – Renewables (mostly biomass) – ‘Hydrogen’ Pacala and Socolow, Science, 2004

Energy sources: Coal • Emits most CO 2 per unit energy of all fossil fuels • Accounts for ~45% of world CO 2 emissions (2013, IEA) • Used mostly for electricity and for home heating (especially in developing nations) • Coal burning emits significant amounts of sulfur, nitrogen and particulate matter • Proven reserves are very high

Energy sources: Oil • Emits ~75 % of coal CO 2 emissions per unit energy. • Accounts for ~35 % of world CO 2 emissions (2013, IEA) • Dominates transportation (cars), but also used for home/building heating • Proven reserves of conventional oil are small number of decades • After that, unconventional oil (fracking, tar sands etc. ) many decades • U. S. dependency on imported oil has been a major national security concern Fracking has changed the whole notion of supply and “peak oil”

Energy sources: Natural gas • Least polluting of the fossil fuels: emits ‘only’ ~60 % of coal CO 2 per unit energy • Accounted for ~20% of world CO 2 emissions (2013, IEA) • Used for electricity generation and home heating (same as coal) • Proven reserves with fracking are large Methane Leakage and Fracking

Details on Sectors

Transportation sector • Sector with fastest growing CO 2 emissions in US U. S. energy consumption by sector • Dominated by oil and road transport • Accounts for ~23 % of worldwide and ~32 % of US CO 2 emissions EIA Annual Energy Review, 2006
 U.")
Residential and Commercial: Buildings • Both residential and commercial (stores, municipalities, etc. ) U. S. energy consumption by sector • Mostly electricity, except for fuel use for space heating • Accounts for ~39 % of US energy use. EIA Annual Energy Review, 2006

Industrial sector • Includes mining, refining, factories, etc. • The fraction of energy used by this sector generally decreases as countries become more developed. • Also includes agriculture… U. S. energy consumption by sector U. S. industrial energy consumption by fuel EIA Annual Energy Review, 2006

Details on agriculture
 of the UN:")
Agriculture: Livestock • 2006 report of Food and Agriculture Organization (FAO) of the UN: – “The livestock sector emerges as one of the top two or three most significant contributors to the most serious environmental problems, at every scale from local to global. ” • Important economic sector: – Employs > billion people (mostly poor) – Occupies 30 % of Earth’s land surface through grazing (26 %) and feed production • 33 % of arable land for feed production
 is one of main")
Agriculture: Livestock • Increasing demand for livestock products (meat, dairy) is one of main drivers of deforestation – 70 % of deforested land in Amazon is occupied by pastures. – Feedcrops cover most of remaining 30 %. – Livestock-induced deforestation emits ~0. 65 Gt. C per year (compared to ~7 Gt. C from total fossil fuel use and ~2 Gt. C total deforestation) • Livestock demand increasing rapidly with increasing world wealth (India, China). Should more than double by 2050.

Details of End Use

Energy consumption by end use: Electricity • Two thirds of world electricity production comes from fossil fuels • One third from hydro and nuclear power

Cost of Electricity Cost of electricity in US in 2002 Electricity generation by source, U. S. , 2006 Source: Nathan Lewis, 2009 • Coal is cheapest and most used source of electricity in US! • Solar Photovoltaic (PV) rather expensive What is changing in this balance ?

Energy consumption by end use: Direct fuel use • ‘Direct fuel use’: – Transportation (oil) – Heating in buildings – Industrial processes • Dominated by oil • No real alternatives for transportation fuels – Biofuels do not mitigate CO 2 emission – Future switch to renewable-powered hydrogen and/or electric cars? Direct Fuel Use Pacala and Socolow, 2006

Summary graphic from Department of Energy

Summary Points: U. S. Energy

Air quality and aerosols

Aerosols, Fossil Fuels and Radiative Balance • Burning of fossil fuels is important source of particulate matter (aerosols), which helps cool climate by: – Scattering radiation – Seeding clouds • Cleaning up ‘dirty coal’ might thus not be good for climate…

Responses to manage emissions • What are the responses that make sense? – – Regulation Life time responsibility for product – the coke can Improve use of current resources – efficiency Integrate development and climate change - adaptation • What might motivate those responses? – – Potential costs Make the cost right … do not deny “use” Cost of inefficiency Social justice issues • What might hinder those responses? – – Cost – benefit Lack of flexibility Social justice issues Economy versus environment

Paris Agreement

Summary of Paris Agreement • From E 3 G – “E 3 G are the independent experts on climate diplomacy and energy policy. Our senior leadership has a combined 75 years experience advising Government, business and NGOs and a wealth of insight into what climate change means for societies. – E 3 G works to accelerate the transition to a low carbon economy. We build the broad based coalitions necessary to deliver a safe climate, we bring independence to an extremely polarised discussion, and we hold policy makers to account on their promises. – E 3 G works closely with like-minded partners in government, politics, civil society, science, the media, public interest foundations and elsewhere.

E 3 G: Table 1

E 3 G: Table 2

E 3 G: Table 3

E 3 G: Table 4
- Slides: 100