CLIM 101 Weather Climate and Global Society What

CLIM 101: Weather, Climate and Global Society What is the nature of El Niño and how is it predicted? Emilia Jin Lecture 11: Sep 30, 2008

Contents q What is El Niño and La Niña? q Basics of El Niño q Impact of El Niño § § § ENSO (El Niño and Southern Oscillation) Teleconnection Global and regional consequences q Prediction of El Niño § § Benefits of El Niño Predicting Defining Monitoring Predicting
![What is El Niño? (a) 1998 JFM SST [o. C] (b) JFM SST Climatology](http://slidetodoc.com/presentation_image_h2/d984514720ff493df8e8241ef8bb5217/image-3.jpg "What is El Niño? (a) 1998 JFM SST [o. C] (b) JFM SST Climatology")
What is El Niño? (a) 1998 JFM SST [o. C] (b) JFM SST Climatology [o. C] (a) Minus (b): 1998 JFM SST Anomaly [o. C]

What is El Niño/La Niña? In late 1800 s, Fishermen coin the name El Niño to refer to the periodic warm waters that appear off the coasts of Peru and Ecuador around Christmas. El Niño was originally recognized by fisherman off the coast of South America as the appearance of unusually warm water in the Pacific ocean, occurring near the beginning of the year. El Niño means The Little Boy or Christ child in Spanish. This name was used for the tendency of the phenomenon to arrive around Christmas. La Niña means The Little Girl. La Niña is sometimes called El Viejo, anti-El Niño, or simply "a cold event" or "a cold episode". El Niño is often called "a warm event". Normal El Niño Marine ecosystem along the Ecuador and Peru coasts
 Normal (‘ 90. 12)")
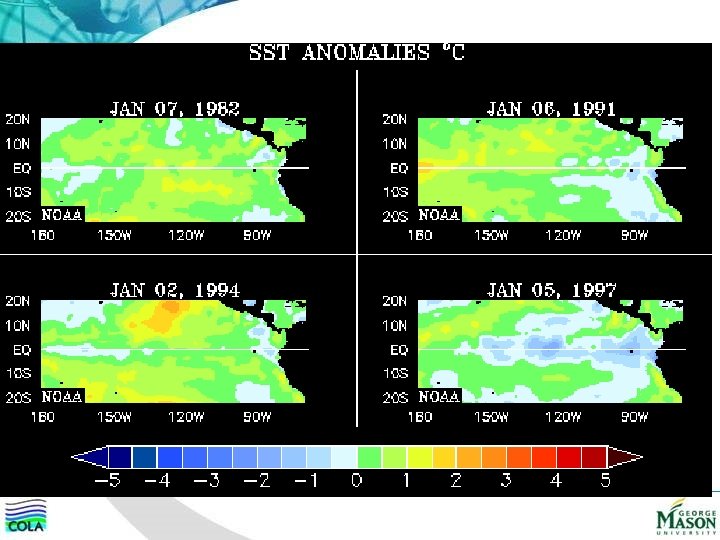
What is El Niño/La Niña? La Nina (‘ 88. 12) Normal (‘ 90. 12) El Nino (‘ 97. 12)
")
Evolution of El Niño (1997 -98 case)
")
Evolution of La Niña (1998 -99 case)

Contents q What is El Niño and La Niña? q Basics of El Niño q Impact of El Niño § § § ENSO (El Niño and Southern Oscillation) Teleconnection Global and regional consequences q Prediction of El Niño § § Benefits of El Niño Predicting Defining Monitoring Predicting
 Wind effect 1: Net transport of trade")
Mean Tropical Pacific Ocean-Atmosphere Climatology (Normal Condition) Wind effect 1: Net transport of trade winds in Pacific is nearly always from east to west. Hadely cell: The Intertropical Convergence Zone (ITCZ) is where the trade winds from the Northern and Southern Hemispheres converge into a narrow belt close to the equator, a result of the general Hadley circulation which dominates the tropics and subtropics. Walker cell: Westward at the surface and eastward in the upper troposphere They cause a general westward motion of surface waters and warmest waters pile up at the western Pacific.
")
Mean Tropical Pacific Ocean-Atmosphere Climatology (Normal Condition)
 Wind effect 2: Ekman Effect: Ekman upwelling")
Mean Tropical Pacific Ocean-Atmosphere Climatology (Normal Condition) Wind effect 2: Ekman Effect: Ekman upwelling due to wind divergence in the eastern tropical Pacific.
")
Mean Tropical Pacific Ocean-Atmosphere Climatology (Normal Condition)
 Upwelling (Coastal Zone Color Scanner)")
Mean Tropical Pacific Ocean-Atmosphere Climatology (Normal Condition) Upwelling (Coastal Zone Color Scanner)
 • The sea surface is about 1/2")
Mean Tropical Pacific Ocean-Atmosphere Climatology (Normal Condition) • The sea surface is about 1/2 meter higher at Indonesia than at Ecuador. • The sea surface temperature is about 8 degrees C higher in the west, with cool temperatures off South America, due to an upwelling of cold water from deeper levels. • This cold water is nutrient-rich, supporting high levels of primary productivity, diverse marine ecosystems, and major fisheries. Rainfall is found in rising air over the warmest water, and the east Pacific is relatively dry.
 How the ocean affects the winds?")
Mean Tropical Pacific Ocean-Atmosphere Climatology (Normal Condition) How the ocean affects the winds?

El Niño and La Niña • Strengthening and weakening of the Hadley and Walker circulations play a crucial role in reinforcing El Niño/La Niña perturbations to the mean tropical Pacific ocean-atmosphere climatology • La Niña Stronger than average trade winds tend to push the warm surface layer of the ocean (upper few 100 meters) towards the western end, creating a thick warm layer. It has higher than average precipitation in Australia, India & Indonesia. • El Niño: Weaker trades relax pressure on surface ocean layer & it starts to move back across Pacific from west to east, raising SST in the eastern tropical water, including Peru, with the zone of heavy rains shifting out over the central Pacific islands.

Developing El Niño Images & text from NASA Goddard Space Flight Center

El Niño and La Niña Normal conditions : The warmest water is found in the western Pacific, as is the greatest rainfall. Winds near the ocean surface travel from east to west across the Pacific (these winds are called easterlies ). El Niño conditions: The easterlies weaken, warmer than average sea surface temperatures cover the central and eastern tropical Pacific, and the region of heaviest rainfall moves eastward as well. La Niña conditions: Could be thought of as an enhancement of normal conditions. During these events, the easterlies strengthen, colder than average ocean water extends westward to the central Pacific, and the warmer than average sea-surface temperatures in the western Pacific are accompanied by heavier than usual rainfall. It oscillates with a periodicity of 2 -7 years

El Niño and La Niña in the tropics La Niña El Niño

Contents q What is El Niño and La Niña? q Basics of El Niño q Impact of El Niño § § § ENSO (El Niño and Southern Oscillation) Teleconnection Global and regional consequences q Prediction of El Niño § § Benefits of El Niño Predicting Defining Monitoring Predicting

Southern Oscillation During an El Niño, sea level pressure tends to be lower in the eastern Pacific and higher in the western Pacific while the opposite tends to occur during a La Niña. This see-saw in atmospheric pressure between the eastern and western tropical Pacific is called the Southern Oscillation, often abbreviated as simply the SO (Sir Gilbert Walter, 1928).
")
El Nino/Southern Oscillation 3 month moving average NINO 3 Index = SSTA (5°N-5°S, 150°W-90°) SO Index =Standardized TAHITI SLPA - Standardized DARWIN SLPA NINO 3 Index SO Index The El Niño-Southern Oscillation, or ENSO for short. Often the term ENSO Warm Phase is used to describe El Niño and ENSO Cold Phase to describe La Niña. Center of Ocean-Land. Atmosphere studies

Global Impact • Dense tropical rainclouds distort the air flow aloft (5 -10 miles above sea level) but on a horizontal scale of thousands of miles. • The waves in the air flow, in turn, determine the positions of the monsoons, and the storm tracks and belts of strong winds aloft (commonly referred to as jet streams) which separate warm and cold regions at the Earth's surface.
 1997/8 DJF (b) DJF Rainfall Climatology (a) Minus (b): 1997/8 DJF")
Rainfall Anomaly (a) 1997/8 DJF (b) DJF Rainfall Climatology (a) Minus (b): 1997/8 DJF Rainfall Anomaly

Global Impact Teleconnections: physical relationships that result from the dynamics of atmospheric and oceanic waves.
")
Global Impact Northward Propagating Rossby-Wave Train Tropical Convection (Trenberth, et al. 1998)
 Pattern 97 -98 El Nino")
Global Impact PNA (Pacific/North America) Pattern 97 -98 El Nino

Global Impact Jet Strem

Global Consequences of El Niño This schematic shows areas that have a consistent change in precipitation pattern linked to the first year of an El Niño event. The months in which the effect is seen are grouped by their first initials (e. g. , OND is "October-November-December").

Global Consequences of El Niño

Global Consequences of El Niño/La Niña

Global Consequences of El Niño/La Niña Impacts of 1982/83 El Nino episode • One of the two largest amplitude El Nino of this century. • Most recent (1997 -98) El Niño was comparably large as well. • Droughts in Australia, India, Southern Africa. • Floods in Peru, Ecuador, USA Gulf of Mexico states, & Colorado River basin. • Collapse of coastal fishery in Peru (largest average annual catch of marine fish in world).

Global Consequences of El Niño/La Niña Impacts of 1982/83 El Nino episode The widespread impact of the 1982 -83 El Niño is evident in this portrayal of extreme temperature events from 1982 to 1984. Months are grouped by their first initials (for instance, JJA is "June-July-August"). SST denotes sea-surface temperature.

Global Consequences of El Niño/La Niña Damage caused by 1982/83 El Nino episode

Global Consequences of El Niño/La Niña Impacts of 1997/98 El Nino episode

Global Consequences of El Niño/La Niña Impacts of 1997/98 El Nino episode China: drought USA: Flood Africa: drought Peru: Flood
 • Hurricanes: Below normal number of tropical")
Regional Consequences of El Niño (United States) • Hurricanes: Below normal number of tropical storms/hurricanes in the Atlantic, although this does not imply any limits on the strength or location of any given tropical system. • Monsoons: A drier-than-normal North American Monsoon, especially for Mexico, Arizona and New Mexico. • Drought: A drier-than-normal fall and winter in the U. S. Pacific Northwest. • Wintertime Storms: A wetter-than-normal winter in the Gulf Coast states from Louisiana to Florida, and in central and southern California if El Niño is strong (Gulf states cooler and wetter. California can be wetter or drier). • Warmer Temperatures: A warmer than normal late fall and winter in the northern Great Plains and upper Midwest (Warmer winters across the northern US ) • Pacific salmon and other fisheries disrupted
 • In the El Niño winter, most")
Regional Consequences of El Niño (United States) • In the El Niño winter, most El Niño winters are mild over western Canada and parts of the northern United States, and wet over the southern United States from Texas to Florida. • El Niño affects temperate climates in other seasons as well. • But even during wintertime, El Niño is only one of a number of factors that influence temperate climates. El Niño years, therefore, are not always marked by "typical" El Niño conditions the way they are in parts of the tropics.

Contents q What is El Niño and La Niña? q Basics of El Niño q Impact of El Niño § § § ENSO (El Niño and Southern Oscillation) Teleconnection Global and regional consequences q Prediction of El Niño § § Benefits of El Niño Predicting Defining Monitoring Predicting

Benefits of El Niño Prediction Subtle changes in the interplay of wind and water in the tropical Pacific can affect local ecosystems and human lives in far flung regions of the globe. The Influence of ENSO on Climate Once developed, El Niño and La Niña events typically persist for about a year and so the shifted rainfall patterns associated with them typically persist for several seasons as well. This can have a significant impact on people living in areas of the tropical Pacific since the usual precipitation patterns can be greatly disrupted by either excessively wet or dry conditions. Even before we know when or how a particular El Niño or La Niña is going to evolve, we can say something about the regional and global effects it is likely to have due to teleconnections. Various flavors of ENSO on Climate In several parts of the tropics, and some areas outside of the tropics, these seasonal shifts are fairly consistent from one El Niño and La Niña event to the next. It is important to remember, however, that no two El Niño or La Niña events are identical and that the seasonal shifts in temperature and precipitation patterns associated with them can vary from one event to the next. Thus, when an El Niño or La Niña develops, it does not guarantee that regions which are typically affected by them will be affected, only that there is enhanced probability that this will be the case.

ENSO, Climate, and Society Simple Picture The More Realistic Picture

Benefits of El Niño Prediction Seasonal climate forecasts made possible The persistence of tropical sea surface temperature (and rainfall) patterns (such as those associated El Niño and La Niña) plays a fundamental role in making seasonal (3 -month) climate forecasts possible. In the absence of El Niño and La Niña, seasonal climate forecasts are still possible because unusually warm or cold sea surface temperatures in other parts of the tropics can still occur. Other influences on seasonal climate While ENSO is the largest known source of year-to-year climate variability, there are other known causes of seasonal climate variability that have nothing to do with ENSO: Tropical Oceans (Atlantic Ocean, Indian Ocean), snow cover and soil wetness, etc.

Effects of SST Anomaly
")
Global Impact Northward Propagating Rossby-Wave Train Tropical Convection (Trenberth, et al. 1998)

The “Charney” Diagram Observations Theory Modeling

El Niño prediction depends on observed data and numerical models. Reliable data on existing conditions and realistic numerical models that project this picture forward in time are at the crux of researchers continuing efforts, not only to understand El Nino, but also to predict when future events will arise and what their impacts will be.
, Bjerknes (1969), Wyrtki (1975), Rasmussen")
ENSO Predictability and Prediction • ENSO phenomena: Walker (1924), Bjerknes (1969), Wyrtki (1975), Rasmussen and Wallace (1983) • ENSO theory: Philander, Yamagata and Pacanowski (1984); Schopf & Suarez (1988), Battisti & Hirst (1989) • ENSO simulation: Mac. Creary (1976), Busalacchi and O’Brien (1981), Philander and Seigel (1985) • ENSO prediction: Cane et al. (1986), Zebiak and Cane (1987)

ENSO Prediction Encouraged by the progress of the past decade, scientists and governments in many countries are working together to design and build a global system for (1) observing the tropical oceans, (2) predicting El Niño and other irregular climate rhythms, (3) making routine climate predictions readily available to those who have need of them for planning purposes, much as weather forecasts are made available to the public today. Scientists are now taking our understanding of El Niños a step further by incorporating the descriptions of these events into numerical prediction models (computer programs designed to represent, in terms of equations, processes that occur in nature). The results thus far, though by no means perfect, give a better indication of the climatic conditions that will prevail during the next one or two seasons than simply assuming that rainfall and temperature will be "normal. "

Operational ENSO Observing System Long term operational support for Pacific Ocean observations that are the foundation of skillful ENSO forecasts.

ENSO Observing Experiment A vast array of ships, aircraft, and buoys collected oceanographic and atmospheric data throughout the western tropical Pacific as part of the Tropical Ocean and Global Atmosphere Program's Coupled Ocean Atmosphere Response Experiment (TOGACOARE) from November 1992 through February 1993. Shown is one of the 70 TAO instrument buoys being deployed as part of TOGA. (NOAA image. )

Defining ENSO The NINO Regions Indices based on sea surface temperature (or, more often, its departure from the long-term average) are those obtained by simply taking the average value over some specified region of the ocean. There are several regions of the tropical Pacific Ocean that have been highlighted as being important for monitoring and identifying El Niño and La Niña. The most common ones are the NINO regions:
. The region that")
Defining ENSO • NINO 1+2 (0 -10 S, 80 -90 W). The region that typically warms first when an El Niño event develops. • NINO 3 (5 S-5 N; 150 W-90 W). The region of the tropical Pacific that has the largest variability in sea-surface temperature on El Niño time scales. • NINO 3. 4 (5 S-5 N; 170 W-120 W). The region that has large variability on El Niño time scales, and that is closer (than NINO 3) to the region where changes in local seasurface temperature are important for shifting the large region of rainfall typically located in the far western Pacific. • NINO 4 (5 S-5 N: 160 E-150 W). The region where changes of sea-surface temperature lead to total values around 27. 5 C, which is thought to be an important threshold in producing rainfall.

Defining ENSO

Defining ENSO For widespread global climate variability, NINO 3. 4 is generally preferred, because the sea surface temperature variability in this region has the strongest effect on shifting rainfall in the western Pacific. And in turn, shifting the location of rainfall from the western to central Pacific modifies greatly where the location of the heating that drives the majority of the global atmospheric circulation. Conventional definition of El Niño : “as a phenomenon in the equatorial Pacific Ocean characterized by a positive sea surface temperature departure form normal in the NINO 3. 4 region greater than or equal in magnitude to 0. 5 C averaged over three consecutive months” (NOAA).

Defining ENSO El Niño Year La Niña Year 1 1951 1 1950 -51 2 1953 2 1954 -56 3 1957 -58 3 1964 -65 4 1963 -64 4 1967 -68 5 1965 -66 5 1970 -72 6 1968 -70 6 1973 -76 7 1972 -73 7 1984 -85 8 1976 -77 8 1988 -89 9 1977 -78 9 1995 -96 10 1982 -83 10 1998 -2000 11 1986 -88 11 2000 -01 12 1990 -92 13 1993 14 1994 -95 15 1997 -98

Predicting ENSO Types of models for predicting ENSO The prediction of ENSO is based on models that predict sea-surface temperatures in the equatorial Pacific Ocean. There are two general types of these models. The first type is called a "dynamical model“(numerical model) which consists of a series of mathematical expressions that represent the physical laws that govern how the ocean and atmosphere behave. To make a forecast, dynamical models are given the current conditions in the ocean and atmosphere and then a computer "does the math" to determine what the future conditions (out to six months or more in advance) will be. The second general type of model is a "statistical model". These models use observations of the past to make predictions of the future. To make a forecast with a statistical model requires a long history of observations by as much as 30 to 50 years. This long record of observations is used to identify key features of the ocean and atmosphere that often occurred prior to subsequent changes in sea surface temperatures in the tropical Pacific.

ENSO Prediction Tropical SST Anomaly Forced Rossby wave Anomalous Tropical Convection Improvement of physical parameterization : PBL, Convection. Extratropical Circulation Subtropical Jet change Advances in the computing power : High resolution Eddy Streamfunction Past Transient activity change Transient vorticity forcing Recent

ENSO Prediction Intermediate Couple Model SST Atmosphere Ocean

ENSO Prediction Intermediate Couple Model

Climate System Modeling Atmospheric General Circulation Model Physical processes Dynamics Basic Equations

Climate System Modeling Atmospheric GCM Parallel programming • Cloud resolving cumulus convection scheme • Extremely high resolution Couple model Integrated Advanced supercomputing Climate and Environment • Advenced Super computer : CRAY X 1, X 1 E Model Oceanic: 18 Tflops : half power of the Earth Environmental simulator GCM • Parallel programming based on MPI Model

ENSO Forecasts for Dynamic Models Jun 2005 – March 2007 Center of Ocean-Land. Atmosphere studies
 minus Cold (89&99) Composite 850 h. Pa band-passed (2 -10 d)")
JFM Warm (83&98) minus Cold (89&99) Composite 850 h. Pa band-passed (2 -10 d) V’T’ SST (shaded) and U 200 (contours) NCEP Reanalysis CGCM Forecast 10 -member Ensembles (1 Dec ICs)

Predicting ENSO Advantages and disadvantages of prediction models • Dynamical models are usually thought to be more scientific, because they explicitly use the physical equations and thereby attempt to accurately capture events in terms of their physical causes and effects. • Dynamical models are able to handle unprecedented climate events, since the basic physics would apply equally well to novel situations as to familiar situations. Statistical models can only see new situations as extrapolations of historically observed ones, and run the risk of missing any new "rules of the game" that may come about only in the new situation. • Dynamical models require much greater computer power than statistical models, because the physical equations are more complex than statistical equations. (We are talking about the difference between a PC and a supercomputer!) • While many oceanographers and atmospheric scientists expect dynamical models to prove superior as computer power increases and more is learned about ENSO physics, this has not yet been clearly demonstrated.

Forecast Skill of NINO 3. 4 Index
 Potential Limit of Predictability of")
Current Limit of Predictability of ENSO (Nino 3. 4) Potential Limit of Predictability of ENSO 20 Years: 1980 -1999 4 Times per Year: Jan. , Apr. , Jul. , Oct. 6 Member Ensembles Kirtman, 2003

Anatomy of ENSO • Irregularity: El Niño and La Niña events tend to alternate about every three to seven years. However, the time from one event to the next can vary from one to ten years. The strength of the events, as judged by the pressure anomaly, varies greatly from case to case. The strongest El Niños in this record occurred in 1982 -83 and 1997 -98 • Nonlinearity: Sometimes El Niño and La Niña events are separated not by their counterparts, but by rather normal conditions. El Niño (or La Niña) years, therefore, are not always marked by "typical" El Niño conditions the way they are in parts of the tropics.

THANK YOU! ANY QUESTIONS?
- Slides: 69