CLIM 101 Weather Climate and Global Society Introduction

CLIM 101: Weather, Climate and Global Society Introduction to Global Warming Jagadish Shukla Lecture 5: Sep 15, 2009 Center of Ocean-Land. Atmosphere studies

Weather Climate Ecosystems Center of Ocean-Land. Atmosphere studies Humans
 Environmental Degradation")
The Global Challenge Global Well-Being (sustainability, security and the future of civilization) Environmental Degradation Inequality and Human Population Extreme Poverty Growth Center of Ocean-Land. Atmosphere studies

World Population from AD 1 to 2002 Planet under Stress World Income from 1500 to 2001 Since 1750, population increased 10 times; Production person also increased 10 times; Therefore, total world economic production increased 100 times. Therefore, the impact of human activity on lifesustaining system on earth increased enormously. World Income per Capita from 1500 to 2001 Source: Data from Maddison (2001), Calculated using data from Maddison (2002) ‘Common Wealth’ by Jeffrey Sachs, 2008 Center of Ocean-Land. Atmosphere studies

Global Poverty From 1820 to 1992 ‘Common Wealth’ by Jeffrey Sachs, 2008 Center of Ocean-Land. Atmosphere studies

Examples of Short-Term Climate Variability Center of Ocean-Land. Atmosphere studies
![El Nino/Southern Oscillation 1998 JFM SST [o. C] JFM SST Climatology [o. C] 1998](http://slidetodoc.com/presentation_image_h2/9fea89dc1cbcc4a7c637a196b5a4b602/image-7.jpg "El Nino/Southern Oscillation 1998 JFM SST [o. C] JFM SST Climatology [o. C] 1998")
El Nino/Southern Oscillation 1998 JFM SST [o. C] JFM SST Climatology [o. C] 1998 JFM SST Anomaly [o. C]

Summer 2003 European Heat Wave: Result of Global Warming? • • Summer 2003 temperatures relative to 2000 -2004 Center of Ocean-Land. Atmosphere studies The immediate cause of the heat-wave was a persistent high pressure center over Northwest Europe. There is currently no evidence that human influence on climate makes such circulation patterns more likely.

LAST CENTURY OR SO … Center of Ocean-Land. Atmosphere studies

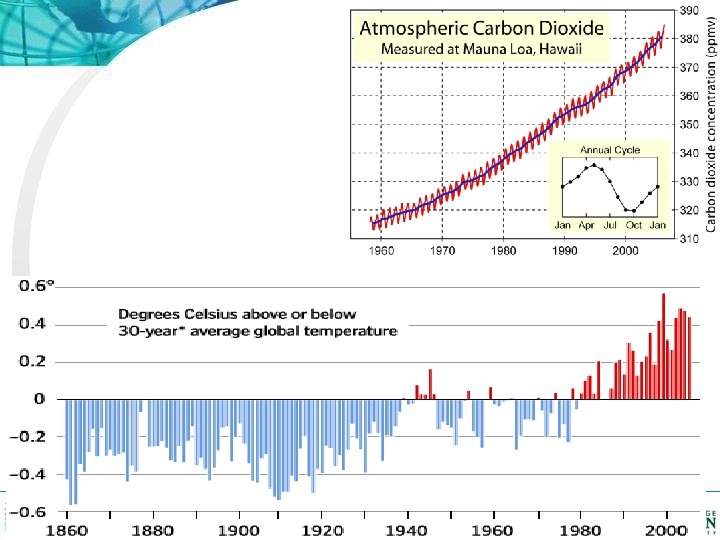
Monthly Mean Carbon Dioxide NOAA CMDL Carbon Cycle Greenhouse Gases Atmospheric carbon dioxide mixing ratios determined from the continuous monitoring programs at the 4 NOAA CMDL baseline observations. Principal investigator: Dr. Pieter Tans. NOAA CMDL Carbon Cycle Greenhouse Gases. Boulder, Colorado. (303) 497 -6678 Center of Ocean-Land. Atmosphere studies

 2000 Year Northern Hemisphere")
LAST TWO MILLENIA OR SO … Temperature Anomaly (o. C) 2000 Year Northern Hemisphere Reconstruction of Surface Air Temperatures Center of Ocean-Land. Atmosphere studies

What’s Happening in the Upper Atmosphere? Center of Ocean-Land. Atmosphere studies

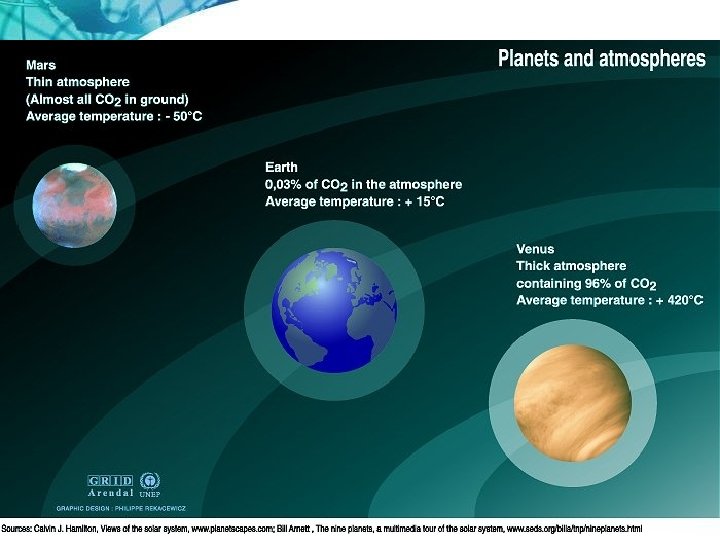
The Climate of a Planet Depends On … 1. Energy from the Sun S (energy from the interior) 2. Planetary Albedo 3. Speed of Planet’s Rotation 4. Mass of the Planet M 5. Radius of the Planet a 6. Atmospheric Composition H 2 O, CO 2, O 3, clouds 7. Ocean-Land, Topography h* Center of Ocean-Land. Atmosphere studies
 Planetary Emission Assume")
Earth’s Energy Balance Solar Radiation S = 1380 Wm-2 (plane, parallel) Planetary Emission Assume radiative equilibrium, so that INCOMING ENERGY = OUTGOING ENERGY Measured albedo ( ) = 0. 31 Measured planetary E = 237 Wm-2 Implied TE = 255 K Measured surface Es = 390 Wm-2 Atmosphere absorbs 153 Wm-2 Measured Ts = 288 K Ts (288 K) > Te (255 K) … Greenhouse Effect (H 2 O, CO 2) Life on planet Earth!
 Global Warming 1. Greenhouse gases (CO 2, CH 4, N 2 O) •")
(Net) Global Warming 1. Greenhouse gases (CO 2, CH 4, N 2 O) • • • CO 2: Carbon Dioxide : Emission from fossil fuel CH 4: Methane : Agriculture N 2 O: Nitrous Oxide 2. Land use change Cooling 1. Aerosols • • Man made/Natural Volcanoes ※Rate of increase of GHG is largest in 10, 000 years Center of Ocean-Land. Atmosphere studies

Solar Irradiance Recent analyses of satellite measurements do not indicate a long-term trend in solar irradiance (the amount of energy received by the sun), Frohlich and Lean (2005) Center of Ocean-Land. Atmosphere studies

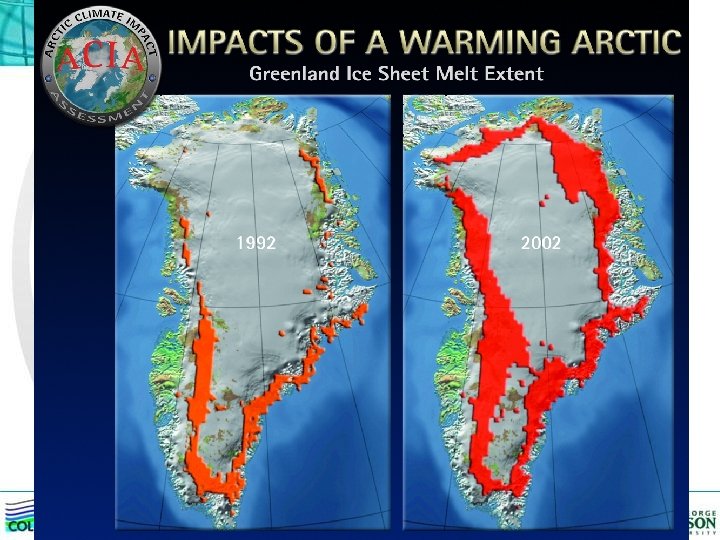
Greenland Ice Mass Greenland Grace monthly mass solutions. For the entire Greenland ice sheet, for April 2002 to April 2006, after scaling the results and removing the mean. The blue error bars include Center of Ocean-Landonly the contributions from uncertainties in the GRACE gravity fields. Velicogna and Wahr Atmosphere studies (2006) Thanks: R. Cicerone
 Pools of carbon are in Gt")
Carbon Cycle Current Global Carbon Cycle (2000 -2005) Pools of carbon are in Gt and annual fluxed in Gt C y -1. Background or preanthropogenic pools and fluxes are in black. The human perturbation to the pools Center of Ocean-Landand fluxed are in red. (updated from Sabine et al. 2004) Atmosphere studies
, IPCC 2007 1990: 6. 4 Gt")
CO 2 emissions (Gigatons of Carbon, Gt C), IPCC 2007 1990: 6. 4 Gt C (=23. 5 Gt CO 2 ), 2000 -2005: 7. 2 Gt C (=26. 4 Gt CO 2) Center of Ocean-Land. Atmosphere studies

Net CO 2 Flux Takahashi et al. 2002 Center of Ocean-Land. Atmosphere studies

Changes in Greenhouse Gases From Ice Age to Modern Data Center of Ocean-Land. Atmosphere studies

Sea Level Rise over the Last Century Climate Change, 1995 Center of Ocean-Land. Atmosphere studies

Greenland Ice Mass Greenland Grace monthly mass solutions. For the entire Greenland ice sheet, for April 2002 to April 2006, after scaling the results and removing the mean. Center of Ocean-Land. The blue error bars include only the contributions from uncertainties in the Atmosphere studies GRACE gravity fields. Velicogna and Wahr (2006) Thanks: R. Cicerone

Annual Anomalies of Global Temperature Figure 3. 2 Relative to the 1961 to 1990 mean Center of Ocean-Land. Atmosphere studies

What’s Happening in the Ocean?
 data Relative")
Anomaly time series Figure 3. 3 The US Historical Climatology Network (USHCN) data Relative to the 1961 to 1990 mean full US Historical Climatology Network (USHCN) data the USHCN data without the 16% of the stations with populations of over 30, 000 within 6 km in the year 2000 Center of Ocean-Land. Atmosphere studies

Center of Ocean-Land. Atmosphere studies FAQ 3. 1, Figure 1
 for 1979 to 2005 Center of Ocean-Land.")
Linear Tropospheric Temperature Trends (°C per decade) for 1979 to 2005 Center of Ocean-Land. Atmosphere studies

Global Mean Sea Level Relative to the 1980 to 1999 mean Center of Ocean-Land. Atmosphere studies
 Figure 4. 2 Center of Ocean-Land. Atmosphere studies")
NH Average Snow-Covered Area (SCA) Figure 4. 2 Center of Ocean-Land. Atmosphere studies

Shrinking Sea Ice Extent in Arctic: Result of Global Warming? • High latitudes more vulnerable • Ice-albedo feedback • Perennial sea ice shrinking 9. 6% per decade since 1979 2005 1979 Annual Minimum Sea Ice Extent (DMSP SSM/I)

Great Natural Disasters 1950 – 2005 Number of events Flood Storm Earthquake/tsunami, volcanic eruption Others (Heat wave, cold wave, forest fire) © 2006 Nat. Cat. SERVICE, Geo Risks Research, Munich Re

U. S. Flow of Raw Materials by weight 1900 -2000 The use of raw materials in the U. S. increased dramatically during the last 100 years Wagner, 2002 Center of Ocean-Land. Atmosphere studies

Center of Ocean-Land. Atmosphere studies

Center of Ocean-Land. Atmosphere studies
 - A measure of")
Probability Shifting Toward Stronger Tropical Cyclones Power Dissipitation Index (PDI) - A measure of the total power dissipated annually by tropical cyclones in the North Atlantic compared to September sea surface temperature. Note that total Atlantic hurricane power dissipation has more than doubled in the past 30 years. See http: //wind. mit. edu/~emanuel/anthro 2. htm for FAQ about hurricanes and global climate change Emanuel, Nature, 2005
 • CO 2 emissions have grown by 80% between 1970 and")
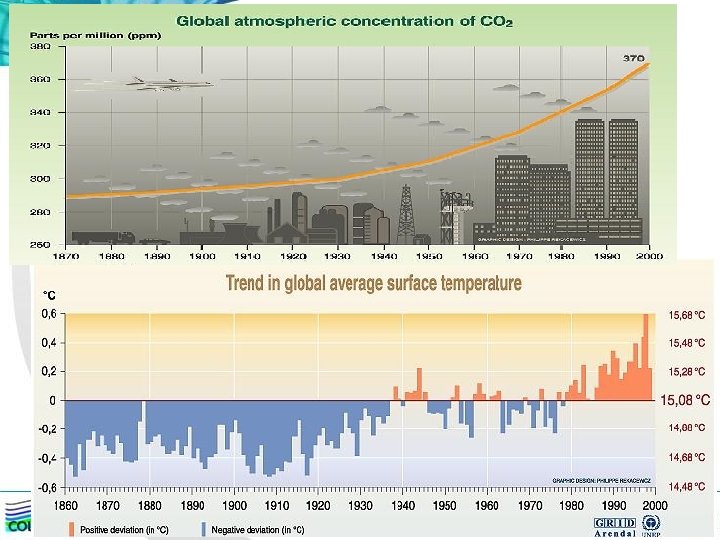
The Knowns (Observed) • CO 2 emissions have grown by 80% between 1970 and 2004. (2005: 379 ppm; All GHG: 455 ppm (CO 2 equivalent); Primary reason: fossil fuel use and land-use change) • Rate of increase of CO 2, CH 4, N 2 O was the largest in 10, 000 years. • Aerosols have partly offset the warming by CO 2. • Global mean surface temp. increase (linear trend) 0. 76 o. C in 100 years (1906 -2005). • Eleven of the past twelve years are the warmest on record. • In the past 500 years, the warmest 50 years were 1951 -2000. Center of Ocean-Land. Atmosphere studies
 • Sea level has risen 1. 8 mm/yr since 1961; 3.")
The Knowns (Observed) • Sea level has risen 1. 8 mm/yr since 1961; 3. 1 mm/yr since 1993. • Arctic sea ice extent reduced by 2. 7% per decade since 1978. (The summer minimum on record; 2007) • Enhanced run-off and earlier spring peak discharge in many glaciers and snow-fed rivers. • Extreme hot nights have increased ; frost days have decreased. • Earlier timing of spring events (blooms) on land. • Poleward and upward shifts in plant and animal ranges. • Changes in algal, plankton, and fish abundances (~Temp. ). • Increase in the acidity of oceans. Center of Ocean-Land. Atmosphere studies

THANK YOU! ANY QUESTIONS? Center of Ocean-Land. Atmosphere studies

CLIM 101: Weather, Climate and Global Society Introduction to Global Warming Jagadish Shukla Lecture 6: Sep 17, 2009 Center of Ocean-Land. Atmosphere studies

 IPCC has been established by WMO and UNEP")
Intergovernmental Panel on Climate Change (IPCC) IPCC has been established by WMO and UNEP to assess scientific, technical and socio- economic information relevant for the understanding of climate change, its potential impacts and options for adaptation and mitigation. Working Group I: The Physical Science Basis Working Group II: Impacts, Adaptation and Vulnerability Working Group III: Mitigation of Climate Change • Largest number of U. S. scientists: nominated by the U. S. Govt. • Highest skepticism : “U. S. Govt. ” Center of Ocean-Land. Atmosphere studies

What is a Climate Model? • Equations of motions and laws of thermodynamics to predict rate of change of: T, P, V, q, etc. (A, O, L, CO 2, etc. ) • 10 Million Equations: 100, 000 Points × 100 Levels × 10 Variables • With Time Steps of: ~ 10 Minutes • Use Supercomputers

• Geographic resolution characteristic of the generations of climate models used in the IPCC Assessment Reports: FAR (IPCC, 1990), SAR (IPCC, 1996), TAR (IPCC, 2001 a), and AR 4 (2007). • The figures above show successive generations of these global models increasingly resolved northern Europe. These illustrations are representative of the most detailed horizontal resolution used for short-term climate simulations. • The century-long simulations cited in IPCC Assessment Reports after the FAR were typically run with the previous generation’s resolution. Vertical resolution in both atmosphere and ocean models is not shown, but it has increased comparably with the horizontal resolution, beginning typically with a singlelayer slab ocean and ten atmospheric layers in the FAR and progressing to about thirty levels in both atmosphere and ocean. Center of Ocean-Land. Atmosphere studies
 GFDL Model Simulations")
Global mean, volume mean ocean temperature Courtesy of Tom Delworth (GFDL) GFDL Model Simulations

1. 0º C Courtesy of UCAR Center of Ocean-Land. Atmosphere studies
")
Mean of 15 Models Surface Air Temperature Difference (Sresa 1 b YR 71 -100) minus (20 c 3 m 1969 -98), Global Average = 2. 61 Center of Ocean-Land. Atmosphere studies

Climate Model Fidelity and Projections of Climate Change J. Shukla, T. Del. Sole, M. Fennessy, J. Kinter and D. Paolino Geophys. Research Letters, 33, doi 10. 1029/2005 GL 025579, 2006 Center of Ocean-Land. Atmosphere studies

Global and Continental Temperature Change Comparison of observed continental- and global-scale changes in surface temperature with results simulated by climate models using natural and anthropogenic forcings. Decadal averages of observations are shown for he period 1906 -2005 (black line) plotted against the centre of the decade and relative to the corresponding average for 1901 -1950. Lines are dashed where spatial coverage is less than 50 %. Blue shaded bands show the 5 -95% range for 19 simulates form. Center 5 climate models using only the natural forcings due to solar activity and volcanoes. of Ocean-Landstudies for 58 simulations from 14 climate models using both natural and Red shaded bands show the Atmosphere 5 -95% range anthropogenic forcings.

AOGCM Projection of Surface Temperatures Center of Ocean-Land. Atmosphere studies

Projection of Precipitation Center of Ocean-Land. Atmosphere studies
 • Limits of deterministic prediction (attribution of an event (Katrina) is")
The Knowns (Models) • Limits of deterministic prediction (attribution of an event (Katrina) is not possible) • No model can explain the past 50 year observed global warming without increase in the green house gases (GHG). • Sun and volcanoes would have produced cooling. • There is no mechanism known to scientists that can explain the global structure of warming in the A, O, L without GHG. • Warming and sea level rise would continue for centuries, even if GHG were stabilized. • Increase in the frequency of heat waves and heavy precipitation. • Entire disappearance of arctic late summer sea ice ( ~ 2100 ). Center of Ocean-Land. Atmosphere studies

THANK YOU! ANY QUESTIONS? Center of Ocean-Land. Atmosphere studies
- Slides: 58