CLIM 101 Global Warming Weather Climate and Society

CLIM 101: Global Warming: Weather, Climate and Society Introduction to Global Warming Jagadish Shukla Lecture 1, 31 Aug 2010

Outline Introduction to Global Warming 1. What is Global Warming? 2. What is Greenhouse Effect? 3. Observed Changes in Climate 4. Observed Changes in Greenhouse Gases (GHG) 5. Hypothesis: Increases in GHG cause Global Warming 6. Testing hypothesis: IPCC 7. Projections of Climate Change 8. Global Carbon Dioxide (CO 2) Emissions 9. Adaptation, Mitigation and Geo-engineering 10. Ethics of Climate Change 11. Sustainable Development 12. The Global Challenge

Global Warming is the increase in the average temperature of the Earth’s near surface air and oceans since the mid-20 th century and its projected continuation. (Wikipedia) Global Temperature Change (o. C) Annual Mean 5 -year Mean 0. 76°C (1. 4°F) since 1900 0. 55°C (1. 0°F) since 1979

Global Mean Temperature

Linear trend of annual mean temperatures Trend 1901 -2005 Trend 1979 -2005
 • If there were no greenhouse")
The Greenhouse Effect (The Cause of Global Warming) • If there were no greenhouse gases the Earth’s temperature would be about 0 F (not 59 F) • Greenhouse effect is real; without it, the Earth would be uninhabitable. • Feedbacks amplify the warming by greenhouse gases.

Center of Ocean-Land. Atmosphere studies

Center of Ocean-Land. Atmosphere studies

MARS Sun Distance = 1. 56 AU F = 592 W/m 2 Albedo = 17% Tsfc = 210 K A Tale of Three Planets EARTH Sun Distance = 1. 00 AU F = 1367 W/m 2 Albedo = 30% Tsfc = 288 K Mars: − 63 o. C Surface Temperature VENUS Sun Distance = 0. 72 AU F = 2639 W/m 2 Albedo = 78% Tsfc = 737 K Earth: 15 o. C (59 o. F) Venus: 464 o. C
 • If there were no greenhouse")
The Greenhouse Effect (The Cause of Global Warming) • If there were no greenhouse gases the Earth’s temperature would be about 0 F (not 59 F) • Greenhouse effect is real; without it, the Earth would be uninhabitable. • Feedbacks amplify the warming by greenhouse gases.

1

Let us look at the Observations.

Global Mean Temperature
")
Sea Level Rise over the Last Century ü thermal expansion ü added freshwater (melting)
")
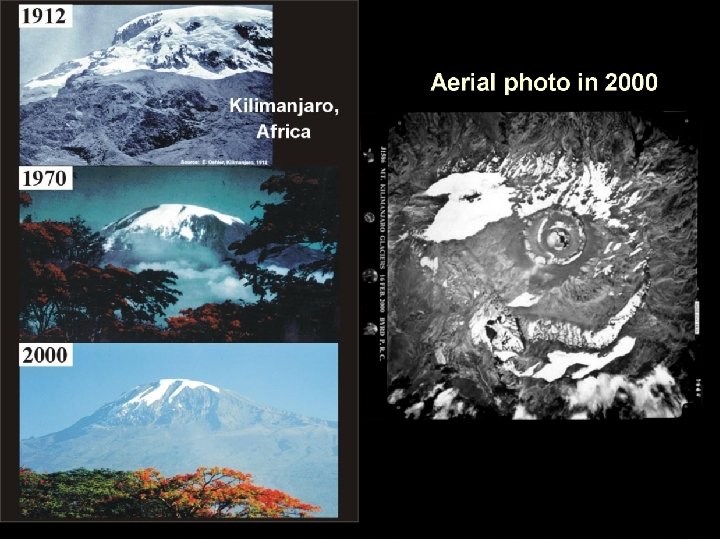
(Himalayas)

Arctic Sea Ice is Disappearing 2007: 38% below average 2008: 34% below average

Arctic Sea Ice is Disappearing

Rising Temperature in Chesapeake Bay

Let us look at the Greenhouse Gases.
 Global Warming 1. Greenhouse gases (CO 2, CH 4, N 2 O) •")
(Net) Global Warming 1. Greenhouse gases (CO 2, CH 4, N 2 O) • • • CO 2: Carbon Dioxide : Emission from fossil fuel CH 4: Methane : Agriculture N 2 O: Nitrous Oxide 2. Land use change Cooling 1. Aerosols • • Man made/Natural Volcanoes ※Rate of increase of GHG is largest in 10, 000 years
 ※Rate of increase of GHG is")
Evidence for Human-induced Changes in GHGs (Overwhelmingly convincing!) ※Rate of increase of GHG is largest in 10, 000 years

Monthly Mean Carbon Dioxide NOAA CMDL Carbon Cycle Greenhouse Gases Atmospheric carbon dioxide mixing ratios determined from the continuous monitoring programs at the 4 NOAA CMDL baseline observations. Principal investigator: Dr. Pieter Tans. NOAA CMDL Carbon Cycle Greenhouse Gases. Boulder, Colorado. (303) 497 -6678

Degrees Celsius above or below 30 -year average global temperature

An Elegant Science Question: Are increases in greenhouse gases responsible for increase in global mean temperature (global warming)? 14. 6 Global Temperature & Carbon Dioxide 1860 -2008 395 14. 4 14. 2 14. 0 13. 8 365 335 305 13. 6 13. 4 275

Hypothesis • Greenhouse gases increase due to human activities. • Global warming is due to increases in greenhouse gases. • Global warming is due to human activities. Alternative Hypothesis • Global warming is due to natural variations of climate. How do you test such hypotheses? Climate Models; IPCC

What is a Climate Model? • Equations of motions and laws of thermodynamics to predict rate of change of: T, P, V, q, etc. (A, O, L, CO 2, etc. ) • 10 Million Equations: 100, 000 Points × 100 Levels × 10 Variables • With Time Steps of: ~ 10 Minutes • Use Supercomputers
 IPCC has been established by WMO and UNEP")
Intergovernmental Panel on Climate Change (IPCC) IPCC has been established by WMO and UNEP to assess scientific, technical and socio- economic information relevant for the understanding of climate change, its potential impacts and options for adaptation and mitigation. Working Group I: The Physical Science Basis Working Group II: Impacts, Adaptation and Vulnerability Working Group III: Mitigation of Climate Change • Largest number of U. S. scientists: nominated by the U. S. Govt. • Highest skepticism : “U. S. Govt. ”

Projection of Global Warming Mean of 15 Models Surface Air Temperature Difference (Sresa 1 b YR 71 -100) minus (20 c 3 m 1969 -98), Global Average = 2. 61

Increase in Surface Temperature Observations Predictions with Anthropogenic/Natural forcings Predictions with Natrual forcings 1. 0º C IPCC 2007

Observed & Projected Global Mean Warming

Global Mean Sea Level Relative to the 1980 to 1999 mean

Impacts

WANTED: New Home for My Country Mohamed Nasheed President of the Maldives

Increases in very high temperatures will have wide-ranging effects. Number of Days Over 100ºF Higher Emissions Scenario, 20802099 Recent Past, 1961 -1979 Lower Emissions Scenario, 20802099

Global Warming in Virginia Annual 3 o. Celcius warmer Between 0% to 10% more precipitation

Summary of Major Impacts • Heat waves; Droughts; Forest fires • Coastal area’s habitability (sea level) • Health (cholera; malaria; dengue; lyme) • Biodiversity: extinction of species • Agriculture (uneven); Tropics (serious) • Water (drying; snow melt; glacier melt)

STERN REVIEW: The Economics of Climate Change 1. Ignoring climate change will damage economic growth. (The poorest countries and people will suffer earliest and most. ) 2. The damage will be on a scale similar to those associated with the great wars and the economic depression. 3. It will be difficult or impossible to reverse changes. 4. The earlier effective action is taken, the less costly it will be.

STERN REVIEW: Main threat to a sustainable Earth • Damages from business-as-usual scenario would be at least 5% and up to 20% of Global GDP a year • Costs of removing most of the climate risk are around 1% of GDP per year • This is equivalent to paying on average 1% more for what we buy • “We can grow and be green” Sir Nicholas Stern

What We Can Do Let us look at the emissions

Global CO 2 Emissions • In 2005, global emissions were 27 billion tons of CO 2 • Per capita, emission (27/6. 7 billions) = 4 tons/per capita/yr • US emissions = 20 tons/per capita/yr

What is 4 tons of CO 2 per year? • Drive 10, 000 miles per year with a car that gives 30 miles per gallon. • Fly 10, 000 miles per year. • 300 KWH per month of electricity from coal fired plant. • 600 KWH per month of electricity from natural gas fired plant. (my house: 580 KWH in Mar. 2008; 380 KWH in Mar. 2009)

Center of Ocean-Land. Atmosphere studies
 are the biggest polluters")
Ethics of Global Warming • “Polluter must pay” (We (US) are the biggest polluters but we also have the biggest guns. ) • Those who have contributed the least to global warming will suffer the most and the earliest. • Poor countries would like to improve the quality of life of their people (consume more energy). • Sustainable developement in a changing climate is challenged by population growth and exetreme poverty.
 • Immediate action on conservation and energy")
What We Can Do (Individuals; Institutions; Governments) • Immediate action on conservation and energy efficiency • Help elect enlightened leaders and policymakers • Educate the public • Social, economic, scientific, technological research • Create new institutions • International dialogues and negotiations • Tax; Cap and Trade
 to 9 billion people. •")
Challenges and Opportunities • Provide food (and good life) to 9 billion people. • Reduce odds of catastrophic impacts. • No magic bullet (push on all fronts). • Must reduce demand of CO 2 (put a price). • Cost in GDP ‘small’ but how to distribute? • US must lead. • Roles of Govts, Industry, Civil society

Our Common Future

Sustainable Development “The balance of economic growth, social justice, and environmental health that meets the needs of present generation and enables future generations to meet their needs. ” Our Common Future (1987) The Brundtland Report

World Population from AD 1 to 2002 Planet under Stress World Income from 1500 to 2001 Since 1750, population increased 10 times; Production person also increased 10 times; Therefore, total world economic production increased 100 times. Therefore, the impact of human activity on lifesustaining system on earth increased enormously. World Income per Capita from 1500 to 2001 Source: Data from Maddison (2001), Calculated using data from Maddison (2002) ‘Common Wealth’ by Jeffrey Sachs, 2008

Global Poverty From 1820 to 1992 ‘Common Wealth’ by Jeffrey Sachs, 2008
 Environmental Degradation")
The Global Challenge Global Well-Being (sustainability, security and the future of civilization) Environmental Degradation Inequality and Human Population Extreme Poverty Growth

Managing planet Earth…… A new phase in human history An enormous challenge…… Are we up to it? Yes THANK YOU!

THANK YOU! ANY QUESTIONS?
- Slides: 53