Click icon to add picture Utilizing EDA Data


 and the NADO Research Foundation 400 North Capitol")
- Slides: 55
Click icon to add picture Utilizing EDA Data Tools in Your CEDS EDA KNOW YOUR REGION WEBINAR SERIES IN PARTNERSHIP WITH THE NADO RESEARCH FOUNDATION MARCH 14, 2012
Timothy F. Slaper Indiana Business Research Center Kelley School of Business Indiana University
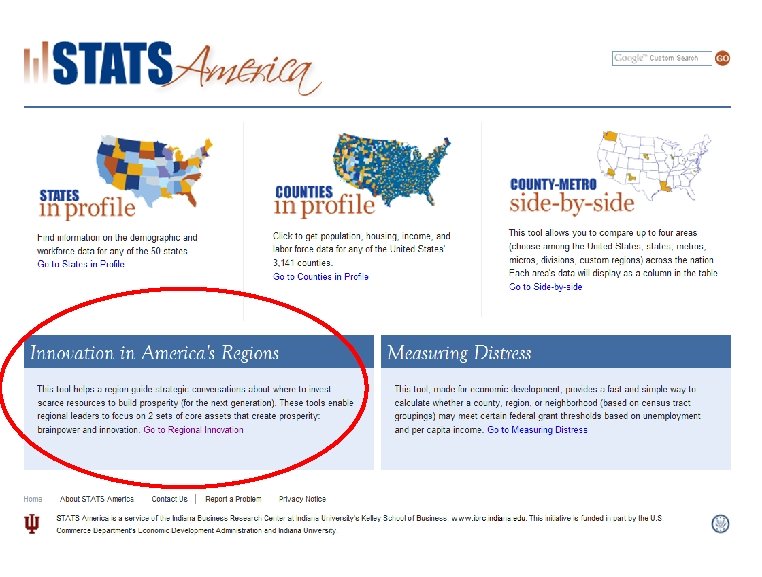
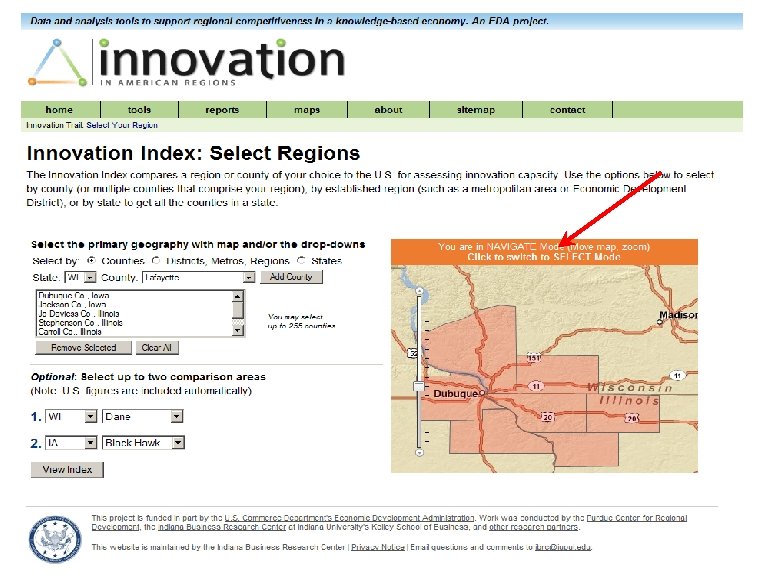
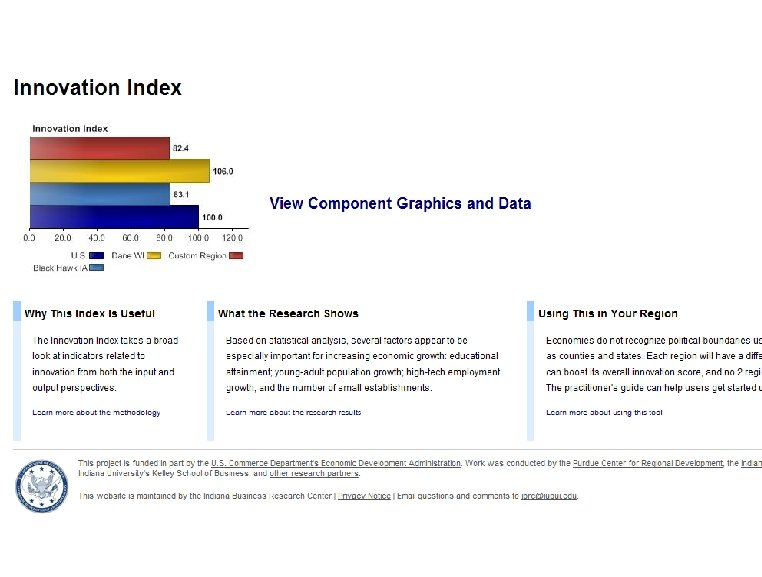
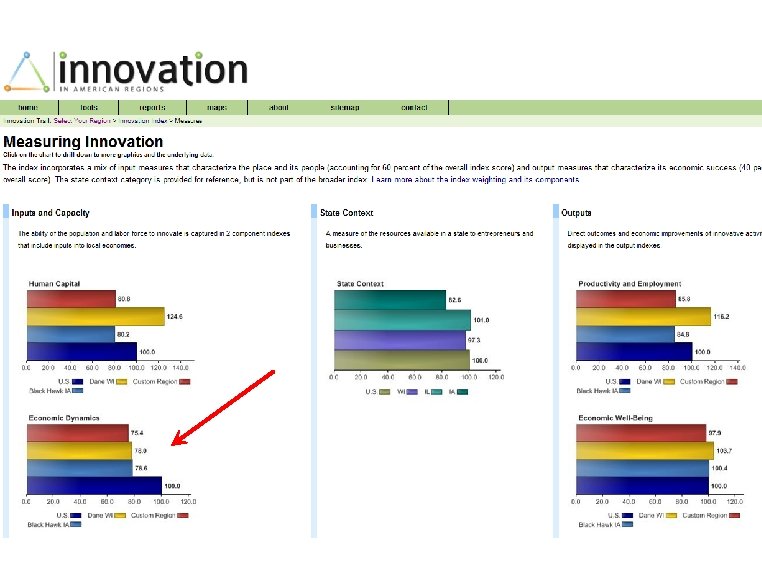
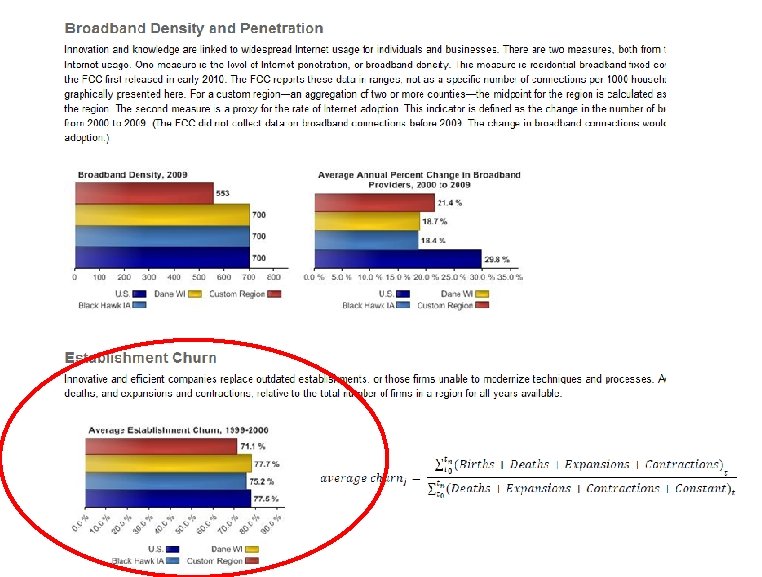
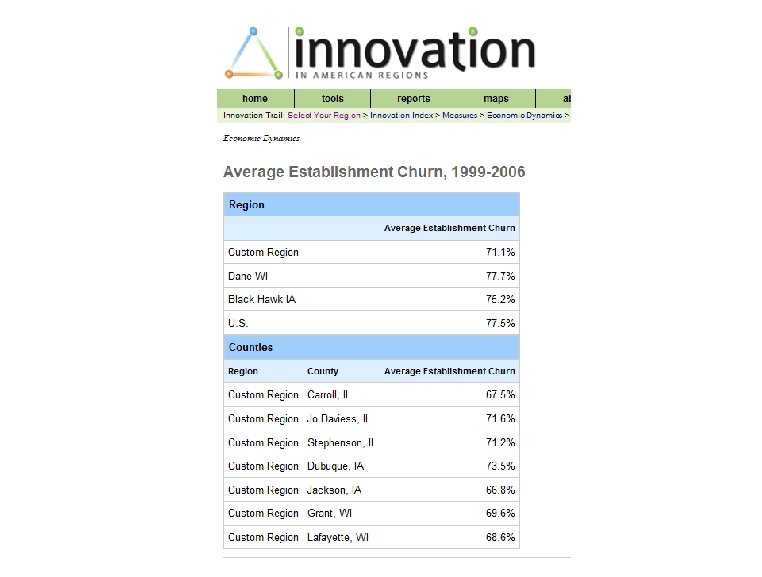
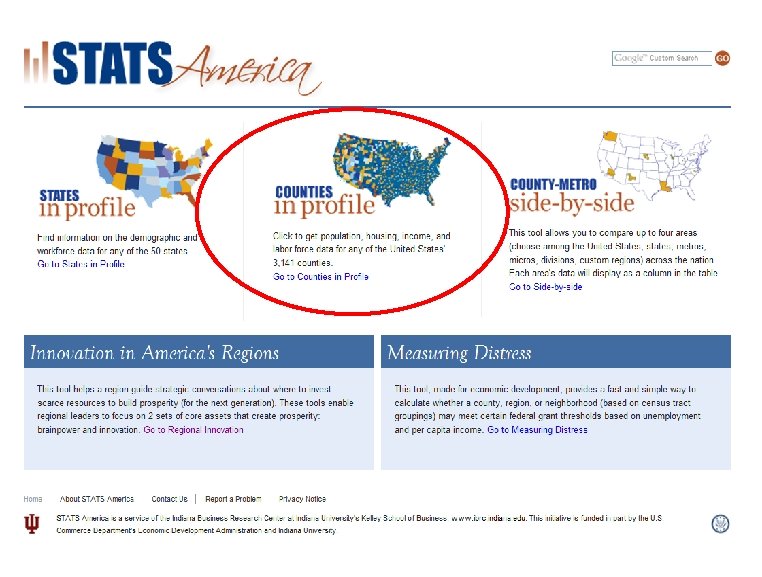
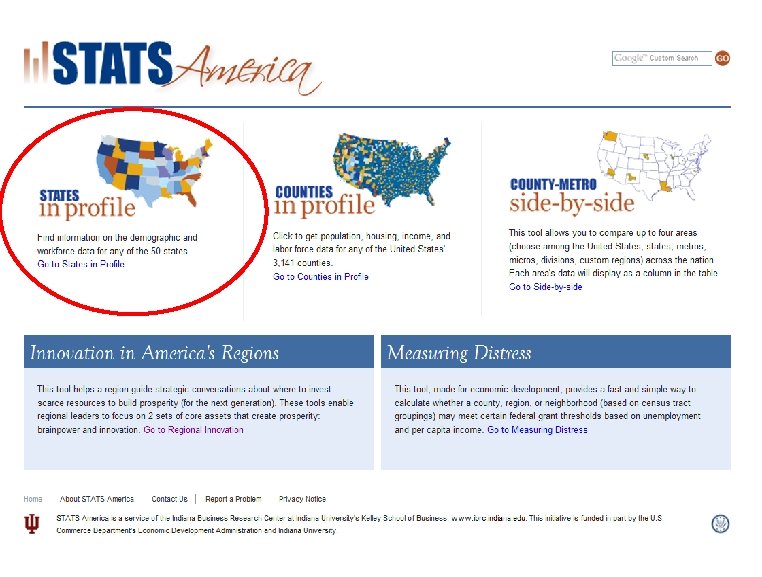
The Regional Data Toolkit • Innovation Tools – Occupation & Industry Clusters – Innovation Index • Measuring Distress • Retrieving Economic and Demographic Data 3
Data tools have much in common • Powered by the IBRC database with 1 billion plus records (and growing) • Easy-to-use • At a price you can afford—free! • Build you own region capability • Graphing and mapping • Nationwide comparisons • Accurate and timely 4
Context • Who needs the data…and for what purpose? • Developing a sound regional development strategy • Identify unique competitive advantage – Based on distinct economic assets • Rural America, for example, often rests on its history of manufacturing and commodity agriculture…no longer viable • How do we foster regional innovation? 5
Regional Conversations • How do we act like a region with a shared future? • Regional roundtables to design a strategy by and for the region—ownership of the vision • Roundtable comprised of public, private and nonprofit leaders – Helpful to have a champion in private industry • May need a change in culture and thinking to achieve the goal—paddling in the same direction • Data-Driven Strategies 6
Steps for Data-Driven Strategies • Identify region • Build governance group • Identify region’s competitive advantage and economic assets • Map region’s assets—both economic and social —and potential futures • Define best strategy (economic direction) and identify the resources needed to seize it See http: //www. statsamerica. org/innovation/guide/practitioners_guide. pdf for more “how to” 7
Identify Region Who plays in our sand box? Is there a logical economic region? What is the commuter shed? The retail shed? Are there significant geographic barriers? Are there historical or cultural factors that affect the geography and people to include? • Is there a common core of businesses that unite the region? • • • 8
Regional Governance • Who are the private sector leaders? • Who are the regional champions? • Which non-profits or foundations can glue together politically disparate pieces? • Which public officials will provide energy? • Are there colleges/universities or other research assets (e. g. , military labs) to provide intellectual heft? 9
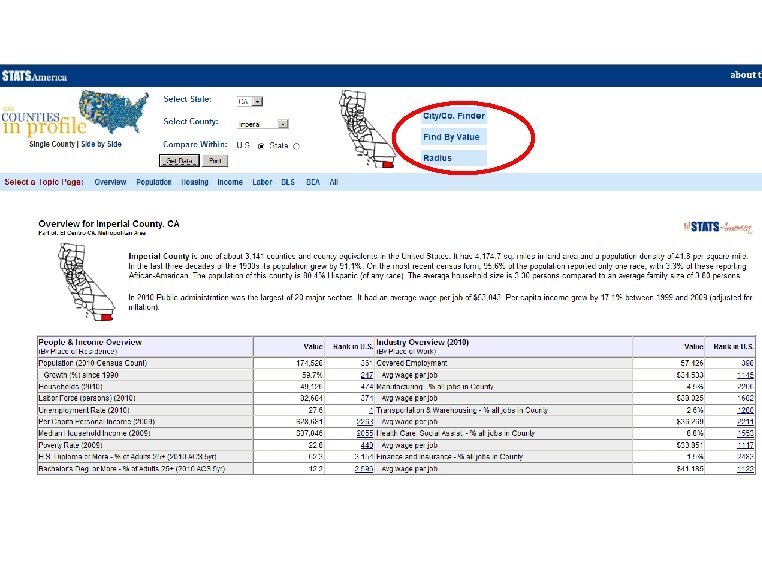
Identify Economic Assets/Advantages • What are the economic trends? – Need data to track industry and employment changes • What does the region specialize in? – Socio-economic benchmarking, location quotients • Define and compare against the region’s peers – Economy, population, resources, transportation linkages, education, natural amenities • What can be learned from peer leaders/laggards? • What are the region’s existing and emerging clusters? 10
Identify Economic Assets/Advantages What are the economic trends? Where will you go for all your What does the region specialize in? data needs? Define and compare against the region’s peers What can be learned from the leaders/laggards? What are the region’s existing and emerging clusters? • What are the options? • • • 11
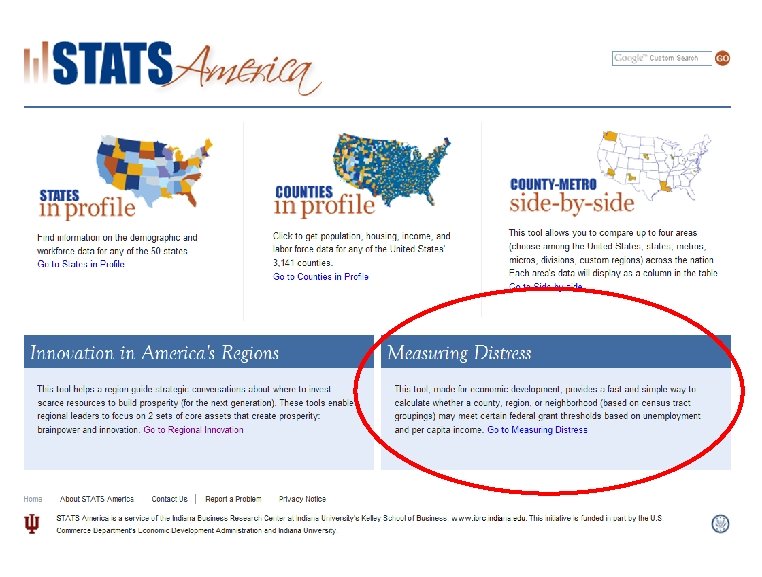
Measuring Distress • Distress indicators for federal grants ― EDA guidelines for distress • Nationwide ― counties, districts, tracts • Region builder • Calculates thresholds automatically • Current, accurate source data 20
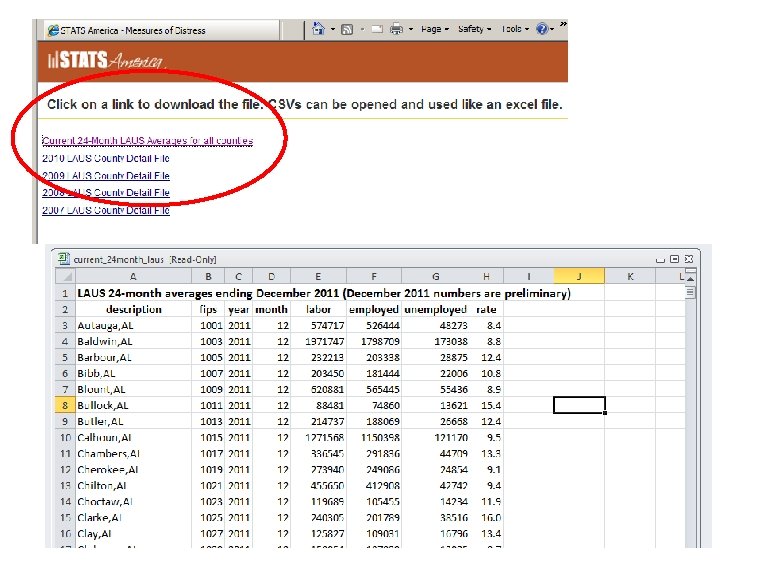
LAUS bulk download files for counties are also available.
LAUS bulk download files for counties are also available.
Click on the rank to get data for all counties
You’ll have to use the “edit-select all” and “copy” commands to move data into a spreadsheet.
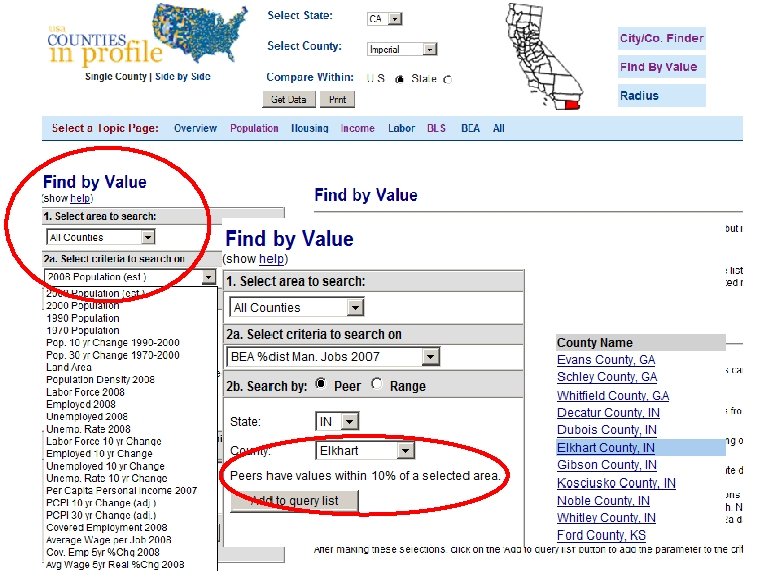
Great tool for finding peers based on socio-economic characteristics
Great tool for finding peers based on socio-economic characteristics You’ll have to use the “edit-select all” and “copy” commands to move data into a spreadsheet.
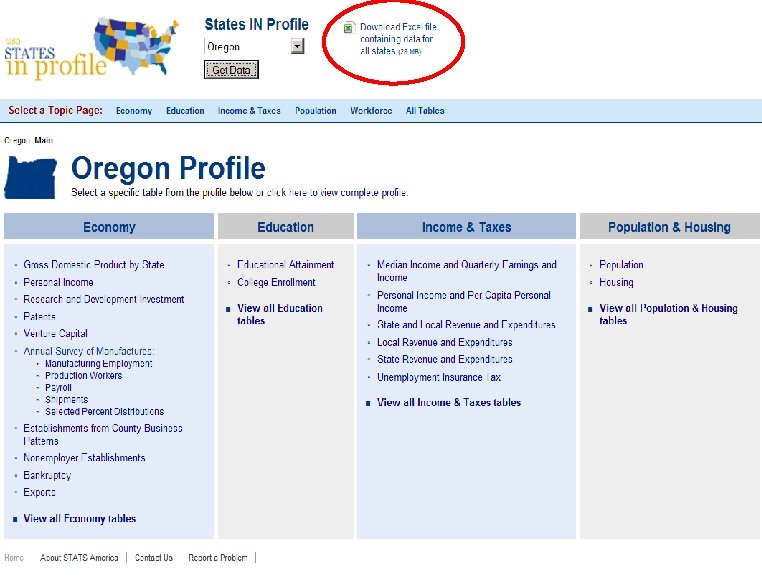
All state data conveniently packaged in one Excel file
Questions? For more information, contact: Timothy Slaper or Carol Rogers Indiana Business Research Center Kelley School of Business Indiana University tslaper@indiana. edu rogersc@iupui. edu
Cluster. Mapping. us EDA Know Your Region webinar March 14, 2012 Rich Bryden Director of Information Products Institute for Strategy and Competitiveness Harvard Business School www. isc. hbs. edu 36 Copyright 2012 © Professor Michael E. Porter
Agenda • Why clusters? • Identifying clusters • Cluster. Mapping. us today • Cluster. Mapping. us through March 2013 37 Copyright 2012 © Professor Michael E. Porter
Strong Clusters Drive Regional Performace • Specialization in strong clusters • Job growth • Breadth of industries within each cluster • Higher wages • Strength in related clusters • Higher patenting rates • Presence of a region‘s clusters in neighboring regions • Greater new business formation, growth and survival Not significant • Positions in “high-tech“ versus other clusters Source: Porter, The Economic Performance of Regions, Regional Studies, 2003; Delgado/Porter/Stern, Clusters and Entrepreneurship, Journal of Economic Geography, 2010; Delgado/Porter/Stern, Clusters, Convergence, and Economic Performance, mimeo. , 2010. 38 Copyright 2012 © Professor Michael E. Porter
Clusters as a Tool For Economic Policy • A forum for collaboration between the private sector, trade associations, government, educational, and research institutions • Brings together firms of all sizes, including SME’s • Creates a mechanism for constructive business-government dialog • A tool to identify problems and action recommendations • A vehicle for investments that strengthen multiple firms/institutions simultaneously • Fosters greater competition rather than distorting the market 20111024 – Ecuador Competitiveness Presentation – FINAL – Prepared by RA Jem Hudson. ppt 39 Copyright © 2011 Professor Michael E. Porter
Agenda • Why clusters? • Identifying clusters • Cluster. Mapping. us today • Cluster. Mapping. us through March 2013 40 Copyright 2012 © Professor Michael E. Porter
Massachusetts Medical Devices Cluster A geographically proximate group of interconnected companies and associated institutions in a particular field, linked by commonalities and complementarities 41 Copyright 2012 © Professor Michael E. Porter
The Composition of Regional Economies United States Natural Resource-Driven Traded Local 27. 4% 0. 3% 71. 7% 1. 5% 0. 9% 0. 5% $57, 706 135. 2% 3. 7% $36, 911 86. 5% 2. 7% $40, 142 94. 1% 2. 4% 144. 1 79. 3 140. 1 Patents per 10, 000 Employees 21. 5 0. 3 1. 6 Number of SIC Industries Number of NAICS Industries 590 677 241 352 48 43 Share of Employment Growth Rate Average Wage Relative Wage Growth Rate Relative Productivity Source: Prof. Michael E. Porter, Cluster Mapping Project, Institute for Strategy and Competitiveness, Harvard Business School; Richard Bryden, Project Director. 20110226 – NGA v 0225 b 42 Copyright 2011 © Professor Michael E. Porter
Composition of the Economy Linkages Across Clusters Fishing & Fishing Products Entertainment Agricultural Products Processed Food Jewelry & Precious Metals Transportation & Logistics Distribution Services Business Services Financial Services Hospitality & Tourism Aerospace Vehicles & Information Defense Tech. Prefabricated Enclosures Building Fixtures, Equipment & Services Lightning & Electrical Analytical Equipment Education & Instruments Power Knowledge Medical Generation Creation Devices Communications Publishing Equipment & Printing Biopharmaceuticals Chemical Products Apparel Tobacco Oil & Gas Plastics Footwear Textiles Leather & Related Products Note: Clusters with overlapping borders or identical shading have at least 20% overlap 43 (by number of industries) in both directions. Motor Driven Products Furniture Construction Materials Heavy Construction Services Forest Products Heavy Machinery Production Technology Mining & Metal Automotive Aerospace Manufacturing Engines Sporting & Recreation Goods Copyright 2012 © Professor Michael E. Porter
Specialization of Regional Economies Leading Clusters by U. S. Economic Area Denver, CO Business Services Medical Devices Entertainment Oil and Gas Products and Services Chicago, IL-IN-WI Metal Manufacturing Lighting and Electrical Equipment Production Technology Plastics Pittsburgh, PA Education and Knowledge Creation Metal Manufacturing Chemical Products Power Generation and Transmission Seattle, WA Aerospace Vehicles and Defense Information Technology Entertainment Fishing and Fishing Products New York, NY-NJ-CT-PA Financial Services Biopharmaceuticals Jewelry and Precious Metals Publishing and Printing San Jose-San Francisco, CA Business Services Information Technology Agricultural Products Communications Equipment Biopharmaceuticals Los Angeles, CA Entertainment Apparel Distribution Services Hospitality and Tourism San Diego, CA Medical Devices Analytical Instruments Hospitality and Tourism Education and Knowledge Creation Boston, MA-NH Analytical Instruments Education and Knowledge Creation Medical Devices Financial Services Raleigh-Durham, NC Education and Knowledge Creation Biopharmaceuticals Communications Equipment Textiles Dallas Aerospace Vehicles and Defense Oil and Gas Products and Services Information Technology Transportation and Logistics Houston, TX Oil and Gas Products and Services Chemical Products Heavy Construction Services Transportation and Logistics Source: Prof. Michael E. Porter, Cluster Mapping Project, Institute for Strategy and Competitiveness, Harvard Business School; 44 Richard Bryden, Project Director. Atlanta, GA Transportation and Logistics Textiles Motor Driven Products Construction Materials Copyright 2012 © Professor Michael E. Porter
Agenda • Why clusters? • Identifying clusters • Cluster. Mapping. us today • Cluster. Mapping. us through March 2013 45 Copyright 2012 © Professor Michael E. Porter
Cluster. Mapping. us Today 46 Copyright 2012 © Professor Michael E. Porter
Cluster. Mapping. us Regions 47 Copyright 2012 © Professor Michael E. Porter
Traded Cluster Composition of the South Carolina Economy Overall change in the South Carolina Share of US Traded Employment: -0. 29% Forest Products (+1. 05%, 3. 81%) South Carolina national employment share, 2009 Power Generation and Textiles Transmission Construction Materials (-5. 19%, 11. 65%) (-0. 65%, 4. 63%) Motor Driven Products (+2. 46%, 6. 12%) Automotive (+1. 37%, 3. 03%) Production Technology Chemical Products (-2. 87%, 2. 41%) Plastics Heavy Construction Services Apparel Hospitality and Tourism Furniture (-1. 77%, 1. 57%) Lighting and Electrical Equipment Biopharmaceuticals South Carolina Overall Share of US Traded Employment: 1. 37% Communications Equipment Business Services Building Fixtures, Equipment and Services Heavy Machinery Metal Leather and Manufacturing Related Products Information Technology Prefabricated Enclosures Aerospace Engines Transportation and Logistics Medical Devices Processed Food Publishing and Printing Fishing and Fishing Products Aerospace Vehicles and Defense Entertainment Education and Knowledge Creation Financial Services Distribution Services Agricultural Products Analytical Instruments Jewelry and Precious Metals Sporting, Recreational and Oil and Gas Children’s Goods Products and Services Change in South Carolina share of National Employment, 1998 to 2009 Source: Prof. Michael E. Porter, Cluster Mapping Project, Institute for Strategy and Competitiveness, Harvard Business School; Richard Bryden, Project Director. 2011 – State Competitiveness – Rich Bryden 48 Employees 4, 600 = Copyright © 2011 Professor Michael E. Porter
South Carolina Job Creation in Traded Clusters Job Creation, 1998 to 2009 Net traded job creation, 1998 to 2009: -106, 029 Indicates expected job creation given national cluster growth. * * Percent change in national benchmark times starting regional employment. Overall traded job creation in the state, if it matched national benchmarks, would be -102, 702 Source: Prof. Michael E. Porter, Cluster Mapping Project, Institute for Strategy and Competitiveness, Harvard Business School; Richard Bryden, Project Director. 2011 State Competitiveness – Rich Bryden 49 Copyright © 2011 Professor Michael E. Porter
South Carolina Wages in Traded Clusters vs. National Benchmarks l Indicates average national wage in the traded cluster South Carolina average traded wage: $40, 142 U. S. average traded wage: $56, 906 Wages, 2009 Source: Prof. Michael E. Porter, Cluster Mapping Project, Institute for Strategy and Competitiveness, Harvard Business School; Richard Bryden, Project Director. 50
51
Agenda • Why clusters? • Identifying clusters • Cluster. Mapping. us today • Cluster. Mapping. us through March 2013 52 Copyright 2012 © Professor Michael E. Porter
New directions for website 1. Engaging & Educating 2. Community 53 Copyright 2012 © Professor Michael E. Porter
BEA Economic Regions 3. Customize Regions VT Albany Economic Area NH Boston Economic Area NY MA CT PA RI Hartford Economic Area NJ New York Economic Area definitions from U. S. Bureau of Economic Analysis 54 Copyright 2012 © Professor Michael E. Porter
4. Macro View of Clusters 55 Wired Magazine Copyright 2012 © Professor Michael E. Porter
National Association of Development Organizations (NADO) and the NADO Research Foundation 400 North Capitol Street, NW | Suite 390 | Washington, DC 20001 Ruraltransportation. org | Knowyourregion. org | Regionalcouncilguide. org 202. 624. 7806 | Info@nado. org NADO. org Regional Strategies. Solutions. Partnerships. 56 Copyright 2012 © Professor Michael E. Porter