Clementine Tutorial This tutorial will introduce you to


")


- Slides: 67
Clementine Tutorial
• This tutorial will introduce you to the Clementine toolkit for data mining and show you how to get started with your own data mining project.
• The first part provides a tour of the workspace, including an update of what's new in this version of Clementine. • The second part is a step-by-step guide to data mining in Clementine. All of the files shown in the examples are installed with Clementine so that you can follow along.
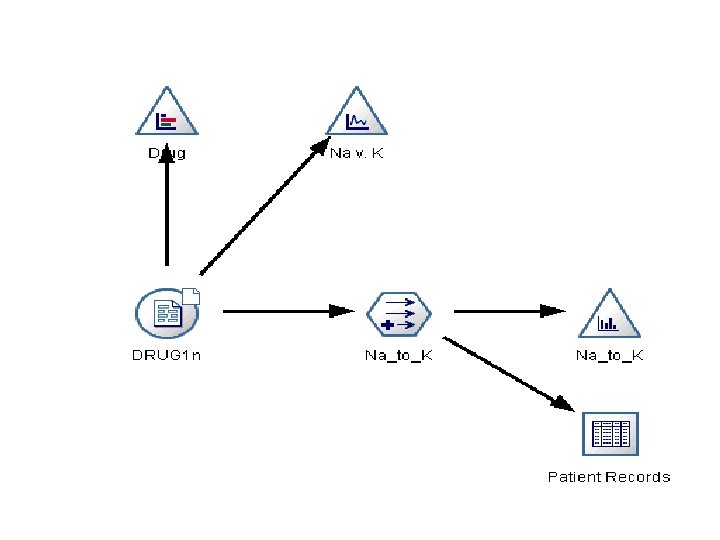
• Clementine uses a visual approach to data mining that provides a tangible way to work with data. • Each process in Clementine is represented by an icon, or node, that you connect to form a stream representing the flow of data through a variety of processes.
• Working in Clementine is essentially like using a visual metaphor to describe the world of data, statistics, and complex algorithms.
• Although it may take a minute to shift into this paradigm, you will soon find that Clementine's simplicity-of-use is exceedingly powerful. Let's take a closer look.
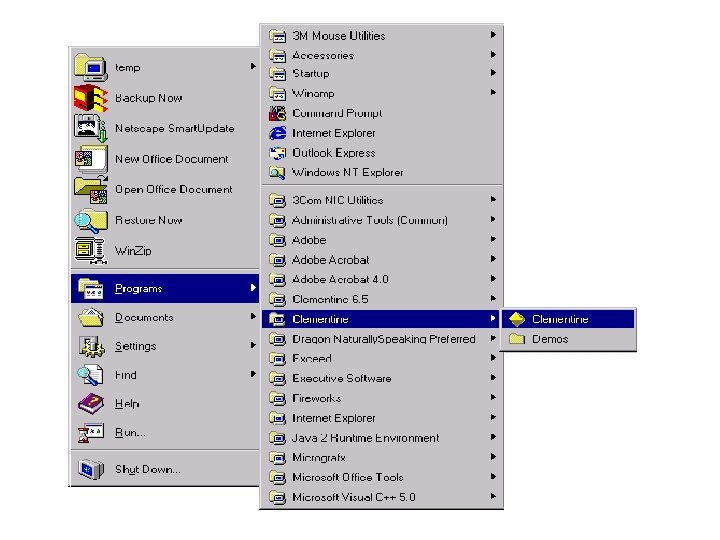
• To start Clementine: – From the Windows Start menu choose: • Programs Clementine
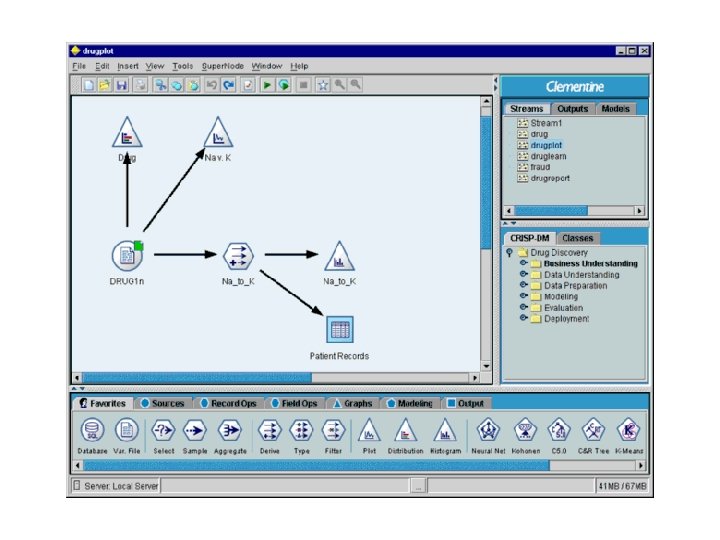
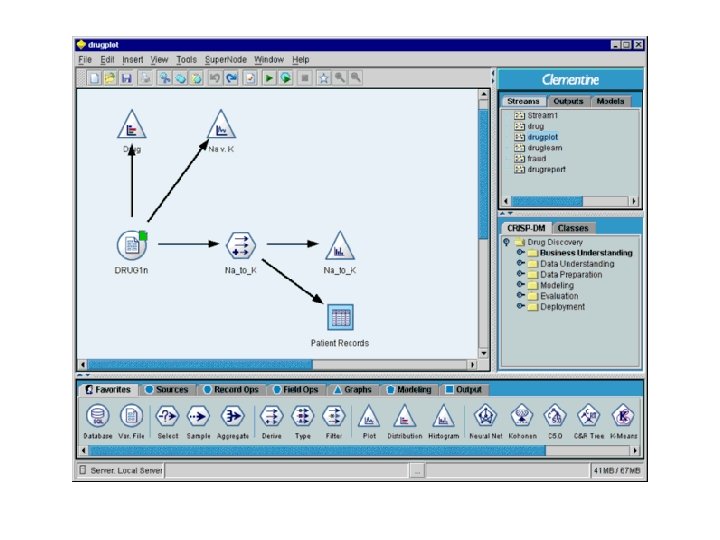
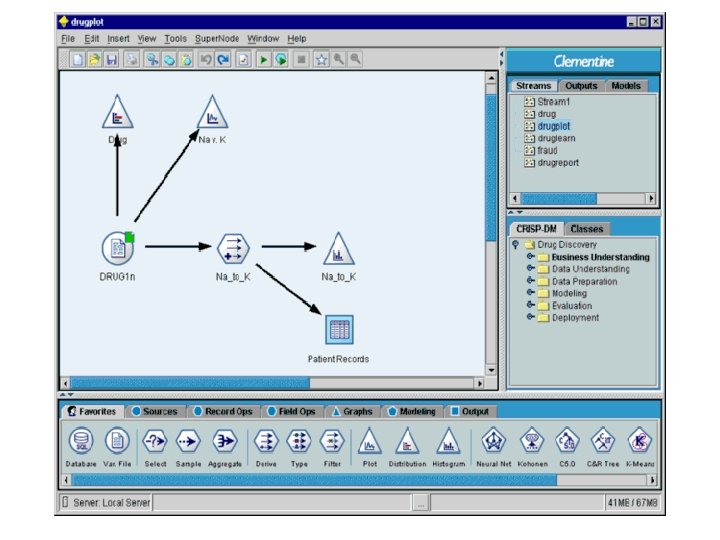
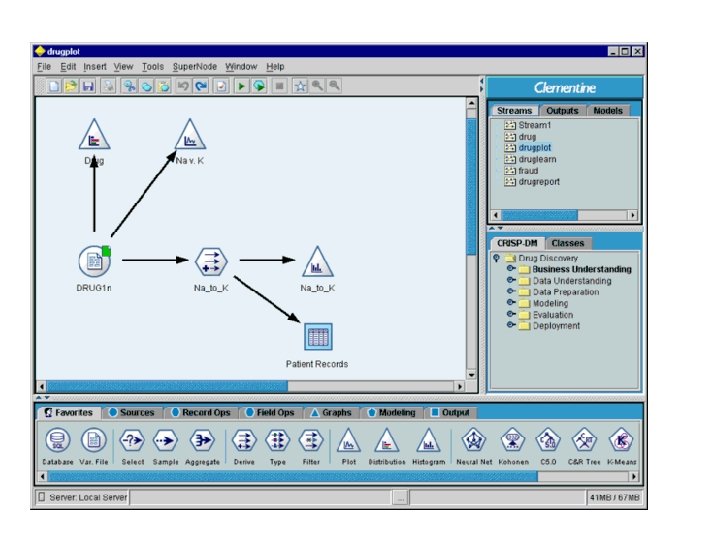
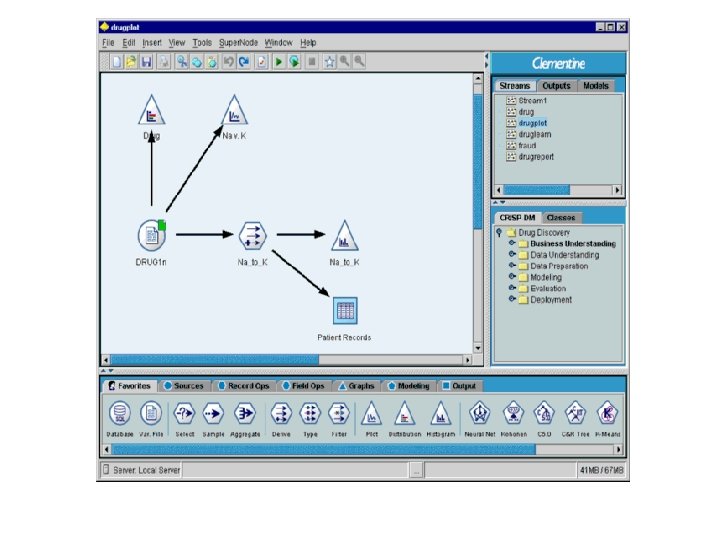
• When you first start Clementine, the workspace opens in the default view. • The tools here are used to help you create a visual representation of data mining operations.
• First, the area in the middle is called the stream canvas. This is the main area you will use to work in Clementine.
• Most of the data and modeling tools in Clementine reside in palettes, the area below the stream canvas.
• Each tab contains groups of nodes that are a graphical representation of data mining tasks, such as accessing and filtering data, creating graphs, and building models. • To add nodes to the canvas, double-click icons from the node palettes or drag and drop them onto the canvas. You then connect them to create a stream, representing the flow of data.
• You will learn more about building streams later in this tutorial. You can jump ahead now using the Contents button below.
• On the top right side of the window are the output and object managers. These tabs are used to view and manage a variety of Clementine objects.
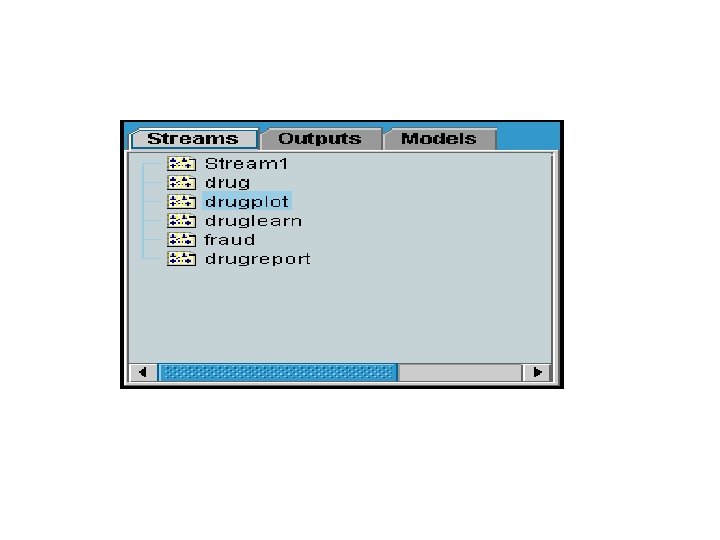
• The Streams tab contains all streams open in the current session. You can save and close streams as well as add them to a project.
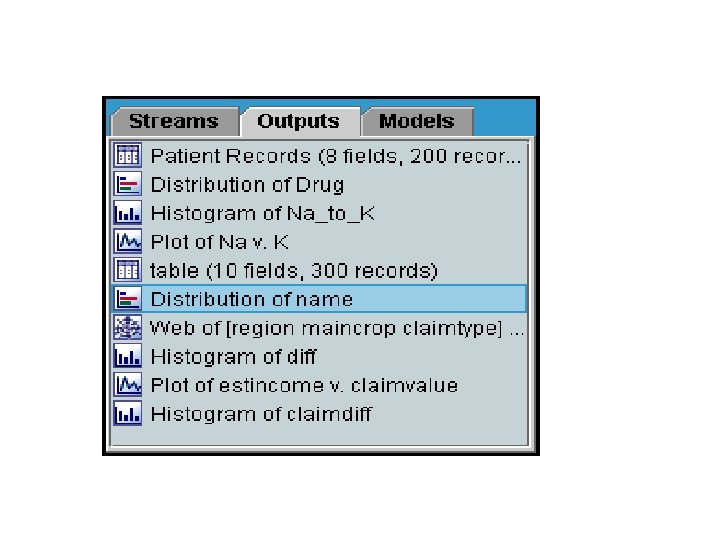
• The Outputs tab contains a variety of files produced by stream operations in Clementine. You can display, rename, and close the tables, graphs, and reports listed here
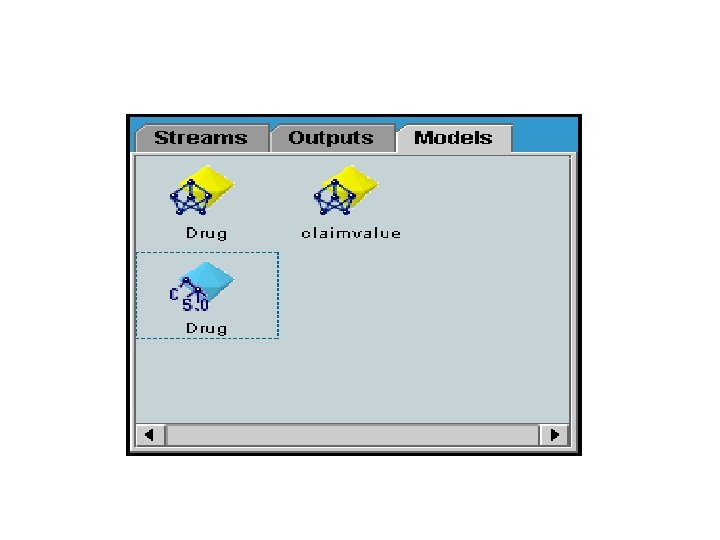
• The Models tab is a powerful tool that contains all generated models (models that have been built in Clementine) for a session. Models can be examined closely, added to the stream, exported, or annotated.
• Note: The Models tab replaces the Generated Models tab from earlier versions of Clementine.
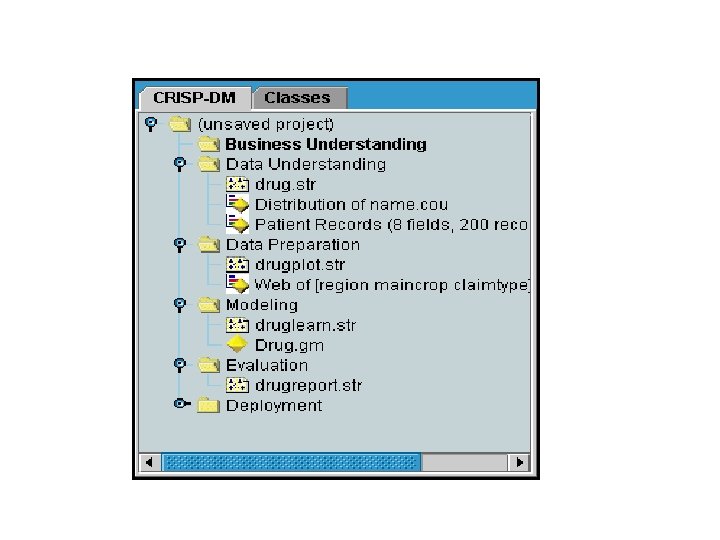
• On the bottom right side of the window is the projects tool, used to create and manage data mining projects. • There are two ways to view projects you create in Clementine--Classes view and CRISP-DM view.
• The CRISP-DM tab provides a way to organize projects according to the Cross. Industry Standard Process for Data Mining, an industry-proven, nonproprietary methodology. For both experienced and first-time data miners, using the CRISPDM tool will help you to better organize and communicate your efforts.
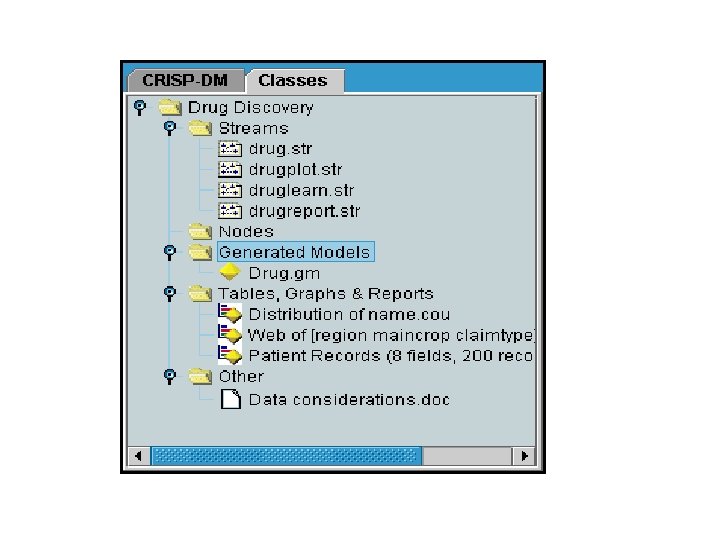
• The Classes tab provides a way to organize your work in Clementine categorically--by the types of objects you create. This view is useful when taking inventory of data, streams, models, etc.
• As a data mining application, Clementine offers a strategic approach to finding useful relationships in large data sets. In contrast to more traditional statistical methods, you do not necessarily need to know what you are looking for when you start. You can explore your data, fitting different models and investigating different relationships, until you find useful information.
• This section provides: – An overview of the types of data-mining problems Clementine can help solve. – A hands-on demonstration of building streams, deriving fields, using graphs, and modeling in Clementine.
• A wide variety of organisations use Clementine to help them mine vast repositories of data. Following is a sample of the types of problems data mining can help solve.
Public sector • Governments around the world use data mining to explore massive data stores, improve citizen relationships, detect occurences of fraud such as money laundering and tax evasion, detect crime and terrorist patterns, and enhance the expanding realm of e-goverment
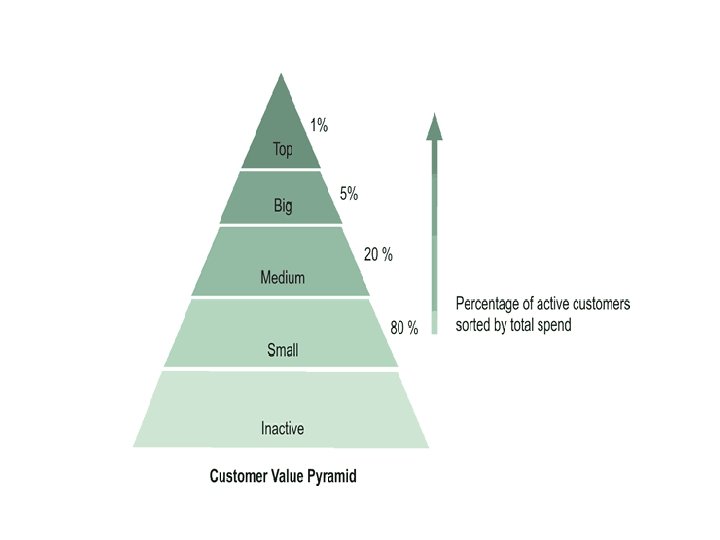
CRM • Customer relationship management can be improved thanks to smart classification of customer types and accurate predictions of churn. Clementine has successfully helped businesses attract and retain the most valuable customers in a variety of industries.
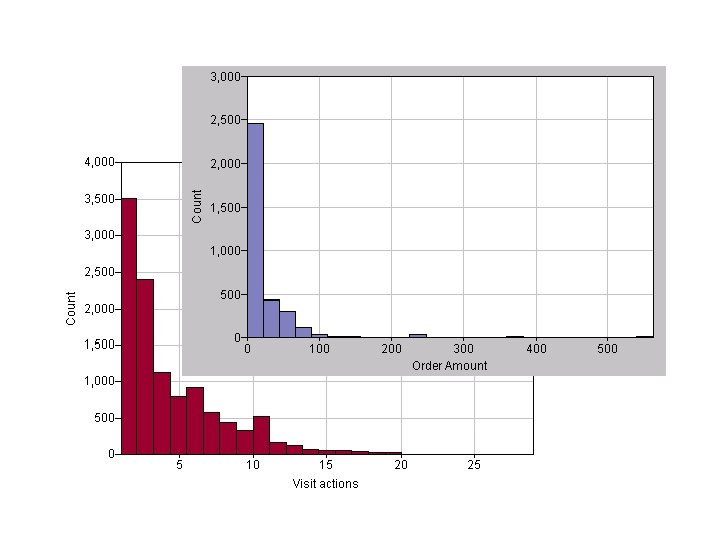
Web mining • With powerful sequencing and prediction algorithms, Clementine contains the necessary tools to discover exactly what guests do at a Web site and deliver exactly the products or information they desire. From data preparation to modeling, the entire data-mining process can be managed inside of Clementine.
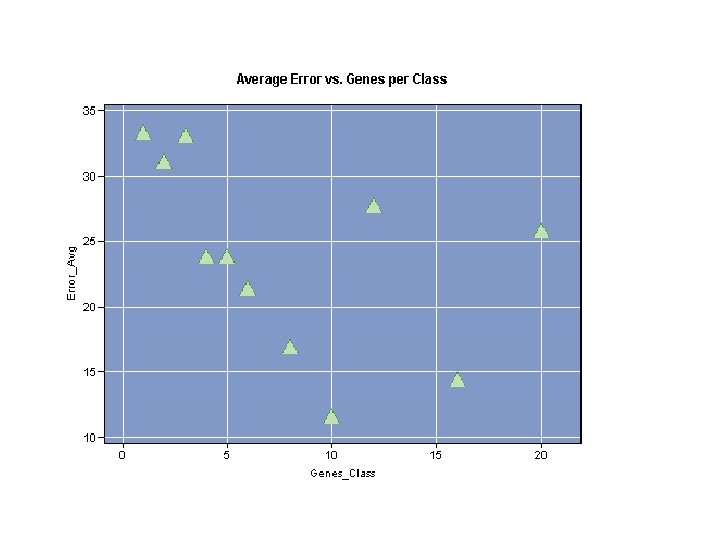
Drug discovery and bioinformatics • Data mining aids both pharmaceutical and genomics research by analyzing the vast data stores resulting from increased lab automation. Clementine's clustering and classification models help generate leads from compound libraries while sequence detection aids the discovery of patterns.
• Clementine provides templates for many of these data-mining applications. Clementine Application Templates, also known as CATs, are available for the following types of activities: – – – Web-mining Fraud detection Analytical CRM Telcommunications analytical CRM Microarray analysis Crime detection and prevention
• Let's get started learning how Clementine can help you conduct your own data mining project. • This section of the guide will show you how to build and execute simple streams using sample drug demonstration files that are included with Clementine. You will learn how to work with data in the various phases of data mining, including: – Visualization, which helps you gain an overall picture of your data. You can create plots and charts to explore relationships among the fields in your data set and generate hypotheses to explore during modeling. – Manipulation, which lets you clean and prepare the data for modeling. You can sort or aggregate data, filter out fields, discard or replace missing values, and derive new fields. – Modeling, which gives you the broadest range of insight into the relationships among data fields. Models perform a variety of tasks such as predict outcomes, detect sequences, and group similarities. These help your organization grow, streamline processes, detect fraud, and retain the most valuable customers.
• For this section, imagine that you are a medical researcher compiling data for a study. • You have collected data about a set of patients, all of whom suffered from the same illness. During their course of treatment, each patient responded to one of five medications. • Part of your job is to use data mining to find out which drug might be appropriate for a future patient with the same illness.
• The data fields used in this demo are: • • Age (Number) Sex M or F BP Blood pressure: HIGH, NORMAL, or LOW Cholesterol Blood cholesterol: NORMAL or HIGH Na Blood sodium concentration K Blood potassium concentration Drug Prescription drug to which a patient responded
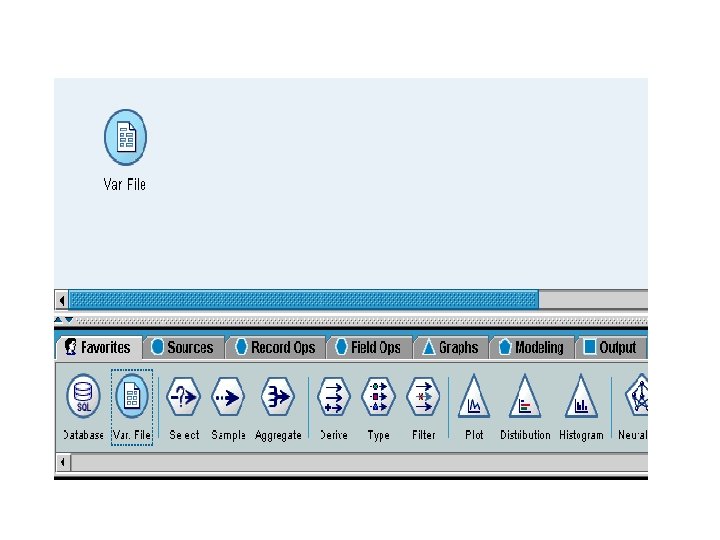
• The first step is to load the data file using a Variable File node. You can add a Variable File node from the palettes--either click the Sources tab to find the node or use the Favorites tab, which includes this node by default. Next, double-click the newly placed node to open its dialog box.
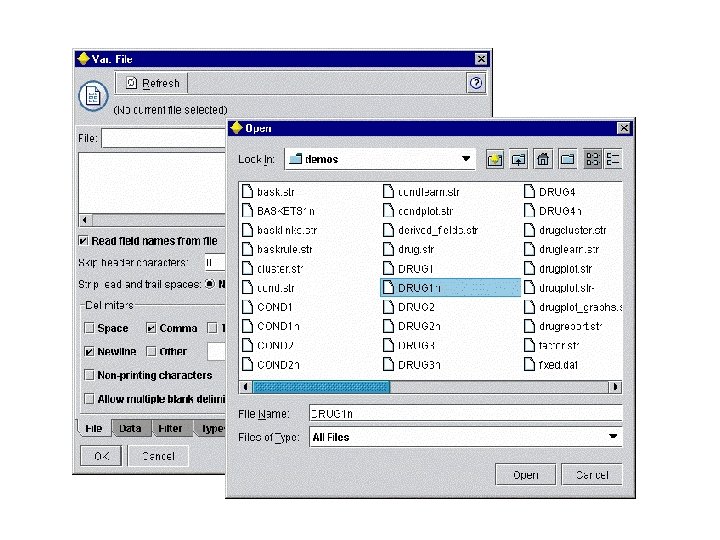
• Click the button just to the right of the File box marked with ellipses (. . . ). This opens a dialog box for browsing to the directory in which Clementine is installed on your computer (or server). Open the demos directory and select the file called DRUG 1 n.
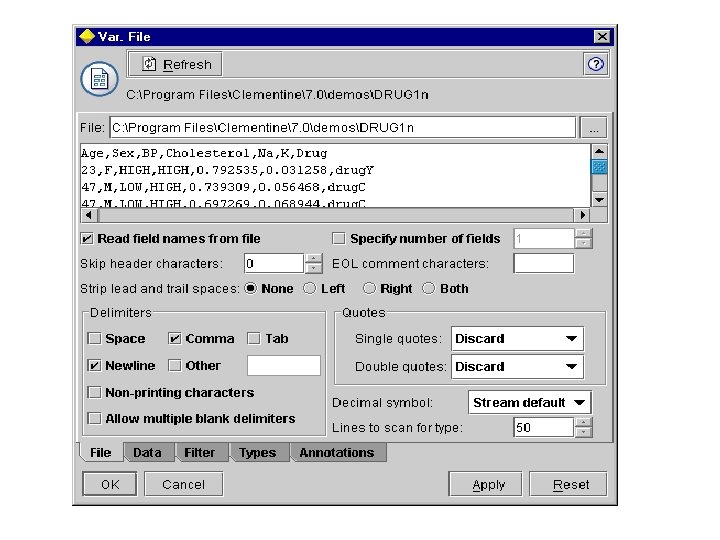
• Select Read field names from file and notice the fields and values that have just been loaded into the dialog box. Before clicking OK to close the dialog box, take a moment to look at the data using the other tabs on the Source node.
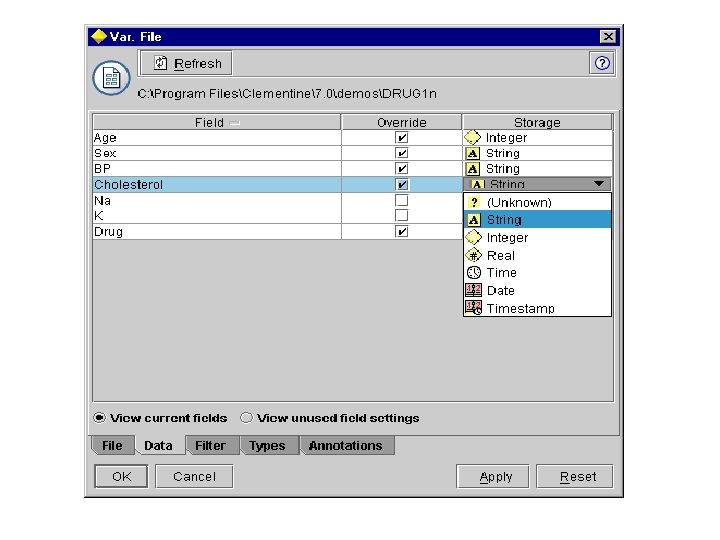
• Click the Data tab to override and change storage for a field. Note that storage is different than type, or usage of the data field.
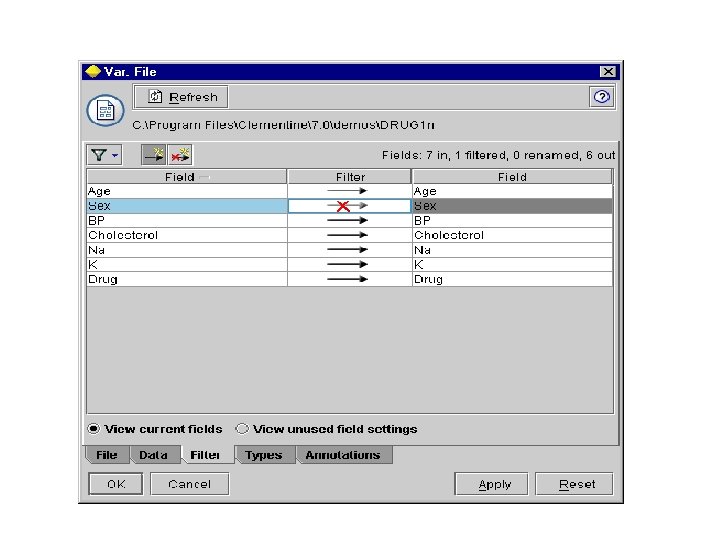
• The Filter tab can be used to remove any fields from the data that is brought into Clementine. Clicking on a field's arrow will mark it with a red X and filter it out. For this tutorial, though, we want to keep all fields.
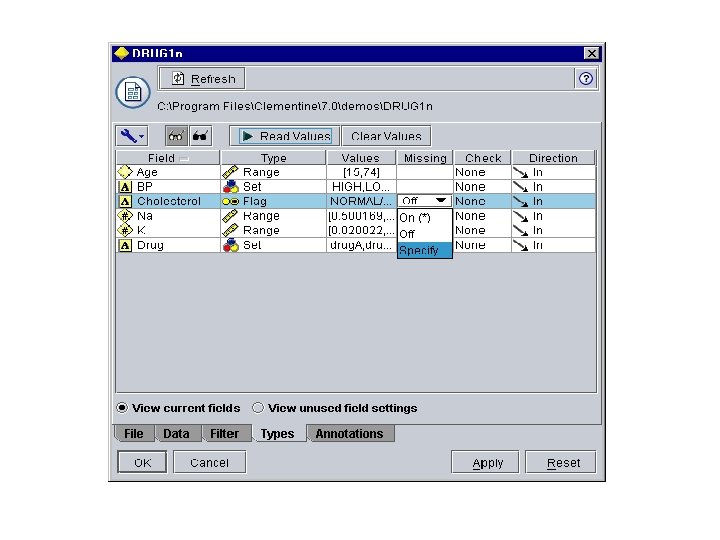
• The Types tab helps you learn more about the type of fields in your data. You can also choose Read Values to view the actual values for each field based on the selections that you make from the Values column. This process is known as instantiation.
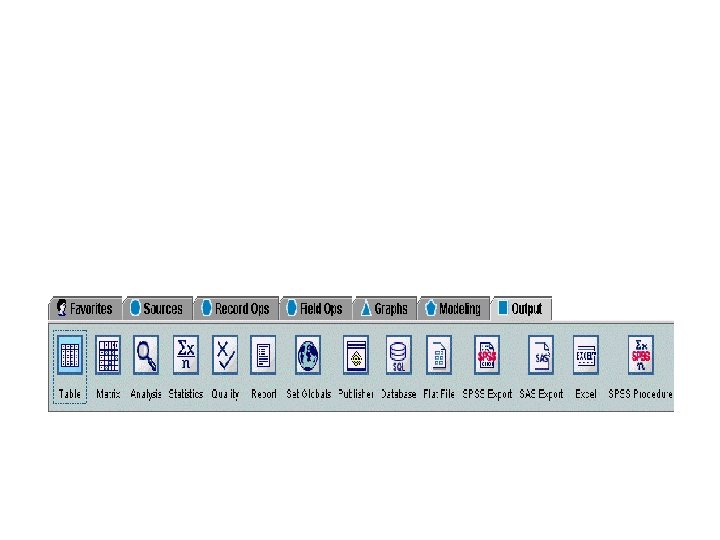
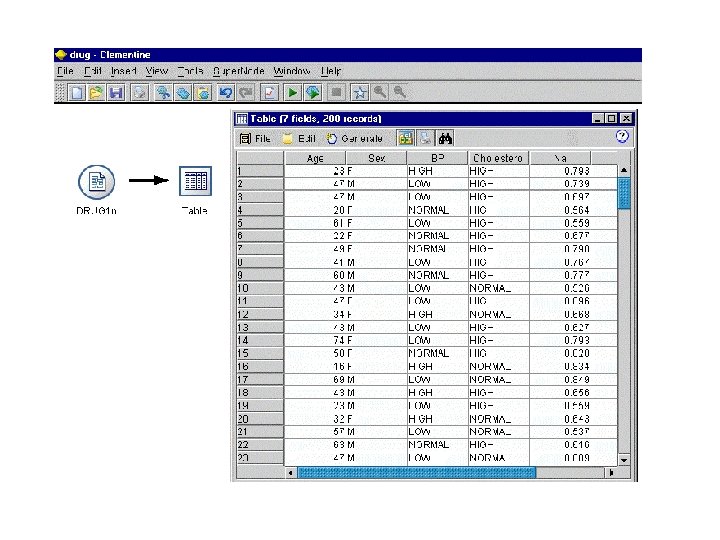
• Now that you have loaded the data file, you may want to glance at the values for some of the records. • One way to do this is by building a stream that includes a Table node. To place a Table node in the stream, either doubleclick the icon in the palette or drag and drop it on to the canvas.
• Note: Double-clicking a node from the palette will automatically connect it to the selected node in the stream canvas. However, you can not connect to terminal nodes like tables and graphs.
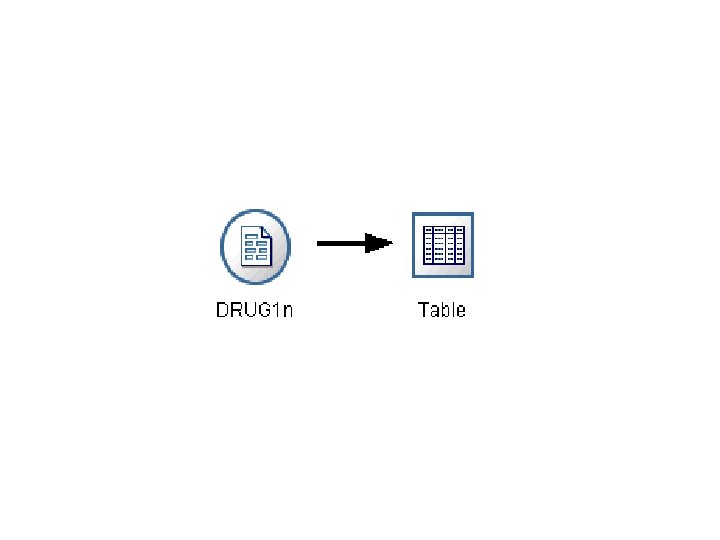
• Next, if the nodes are not already connected, you can use your middle mouse button to connect the Source node to the Table node. To simulate a middle mouse button, click the Alt key while using the mouse.
• Now that you have built a stream, you must execute it in order to view its output. Click the green arrow button on the toolbar to execute the stream and view an output table showing all of the records in the data file.