Classroom Reports Classroom Profile The Classroom Profile allows


")


 Student 21 Content")
 Student 22 Content")
 Student 23 Content")
 Student 24 Content")
 Current School Year View 25 Previous School Year View")
 Student Grade Level Content 26")
 Student Grade Level Content 27")
 Student Grade Level Content 28")


 36")
 Your students 37 National Peer Group NOTE: NPR only automatically")

 39")
 40")


 Report 53 The Class Standard Student Detail (CSSD) Report")


 terrence.")


- Slides: 58
Classroom Reports
Classroom Profile The Classroom Profile allows educators to view how an entire class performed within a specific Performance Series subject and unit. Use the objectives listed on the Classroom Profile to – 1. Inform your instruction for each class. 2. Find the point at which half the class is expected to comprehend a skill and progress from there. 3. Target individual students who have additional needs. Copyright © 2016 Scantron Corporation. All rights reserved. 2
Classroom Profile—Continued 3 Follow the steps below to locate a teacher’s Classroom Profile— Step 1: Log in to the Achievement Series (AS)/Performance Series (PS) website. Step 2: Click the Classroom icon. Step 3: From the dropdown menu, select the class of your choice. Note: You will see only the class(es) to which you are assigned. Copyright © 2016 Scantron Corporation. All rights reserved.
4
5
6
7
8 Click Here to access the Curriculum Alignment Guide and view suggested next steps for the students in your class. Click the Scaled Score heading to organize student scores from lowest to highest.
In the Index, you can search to find “Alabama. ” From there you will find the AS Alignments, PS Alignments, and Suggested Learning Objectives. 9 9
Choose from among these skills to develop a learning path for your students. Note: You may also run this report individually for students. Given a student's Scaled Score, teachers can identify the collection of skills that fall within the corresponding Scaled Score range. 10 10
11 Classroom Profile Student’s Scaled Score National Percentile Ranking Test Completion Date
12
Focusing in on Skills 13
N/A indicates a student who did not take or complete his or her PS test. 14 14
The Scaled Score is the student’s overall score independent of grade level. 15 15
A student who has a score, but no Performance Rating, likely tested outside of the prescribed PS testing periods. 16 16
The Performance Bands/Ratings are national, color-coded data points revealing how each student compares to his or her peers who tested in the norm study. 17 17
These are unit-specific skills and the number of students expected to have attained (A) or not attained (NA) the skills. 18 18
Click on a student’s name to access his or her individual student profile. 19 19
Student Profile Report 20
Scaled Score (SS) Student 21 Content
Scaled Score (SS) Student 22 Content
Scaled Score (SS) Student 23 Content
Scaled Score (SS) Student 24 Content
Scaled Score (SS) Current School Year View 25 Previous School Year View
Standard Item Pool (SIP) Student Grade Level Content 26
Unit Score Range (USR) Student Grade Level Content 27
Unit Score Range (USR) Student Grade Level Content 28
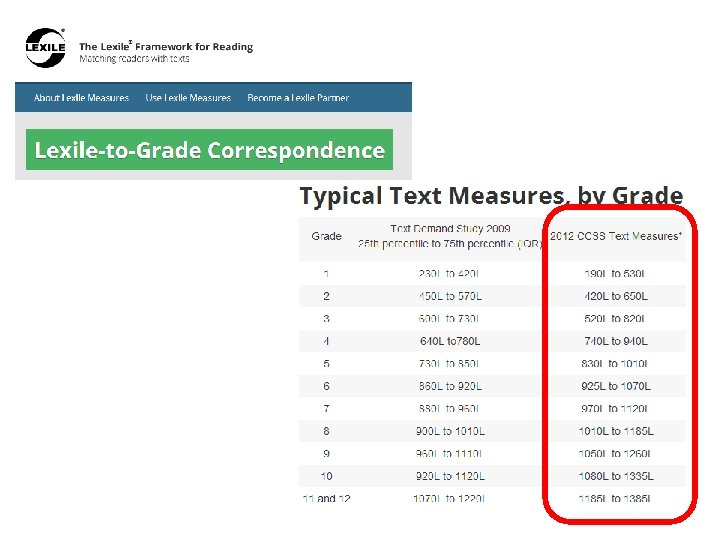
Lexile 29
30 Lexile Measures Provided by Metametrics ©
31
32 Lexile – Grade Level
33 Lexile – Grade Level
34 Lexile – Grade Level
National Percentile Rating (NPR) 36
National Percentile Rating (NPR) Your students 37 National Peer Group NOTE: NPR only automatically determined if assessment taken within designated windows Norms are available for: Reading, Mathematics, Language Arts, and Science for students in grades 2 -10 (at present time)
Grade Level Equivalent 38
Grade Level Equivalent (GLE) 39
Grade Level Equivalent (GLE) 40
41 Suggested Learning Objectives
42 SLOs - Making the Selection
43 Learning Plan for the Student
44 Use for SLOs • • • Provide educators with instructional next steps when they are unsure of where to begin with instruction for a student Aid in the creation of long-term goals on an IEP for Special Education students Act as an investment tool for students by looking at the Learning Objectives Attained as great accomplishments and the SLO as weekly goals. Provide work targets for enrichment plans Guide conversations in parent-educator conferences about next steps
District Reports
District Report – Student Listing 46
District Report – Student Listing 47
District Report – Student Listing 48
District Reports—Continued Here is a view of the Reading Summary District Report from the top row. Click here to disaggregate data in various ways. View multiple data points for all students. Click the Change button in the appropriate section to filter by time frame, demographics such as ethnicity and gender, or student groups. Copyright © 2016 Scantron. All rights reserved. 49
District Reports—Continued Here are the ways in which you can disaggregate data. Simply click on the icon of your choice to see data broken down in the way you prefer. For example, here is a snippet of the data disaggregated by students. Copyright © 2016 Scantron. All rights reserved. 50
District Reports—Continued Point to the area in which you would click to access aggregate Performance Bands data for your entire school. Copyright © 2016 Scantron. All rights reserved. 51
District Reports—Continued 52 Here is a snippet of the Gains Analysis Report for Reading. For more information on Gains and Gains Analysis, you may review the All About Gains and Gains Analysis PPT located in our Customer Dropbox (http: //bit. ly/alsdedropbox) in the Performance Series Information Power Points folder. Copyright © 2016 Scantron. All rights reserved.
Class Standard Student Detail (CSSD) Report 53 The Class Standard Student Detail (CSSD) Report displays Summary and Detailed views of students’ Suggested Learning Objectives by Unit, Skill, and Grade level. Run this report to see how all of your classes or even an entire grade level performed on each skill within the report. Click the picture below to access step-by-step instructions for rendering the CSSD Report. Copyright © 2016 Scantron. All rights reserved.
Printing Individual Student Profile Reports 54 Student profile reports provide a snapshot of the student’s most recent performance within a given Performance Series assessment. You can use this report to discuss educational progress with both students and parents. Click the picture below to access step-by-step instructions for rendering and printing student profile reports. Copyright © 2016 Scantron. All rights reserved.
55 Alabama AS/PS Project Please visit our Dropbox for training materials, recorded webinars, and other handouts and guides that will help you support your Achievement Series and Performance Series implementation http: //bit. ly/alsdedropbox Copyright © 2016 Scantron. All rights reserved.
56 Alabama Scantron Project Team Member Role/Email • Terrence Ingram Education Specialist (ES) terrence. ingram@scantron. com Education Specialist (ES) terry. grissom@scantron. com Sr. Client Program Manager (CPM) sallie. lawrence@scantron. com Manager of Client Program Management larry. ewing@scantron. com • Terry Grissom • Sallie Lawrence • Dr. Larry Ewing Copyright © 2016 Scantron. All rights reserved.
57 Survey 1. Type this URL in your browserhttp: //bit. ly/Scan. Survey. T 2. Training Today was- Performance Series Data Interpretation 3. Region – 8
Thank You! Copyright © 2016 Scantron. All rights reserved.