Classification predicting an item class Clustering finding clusters


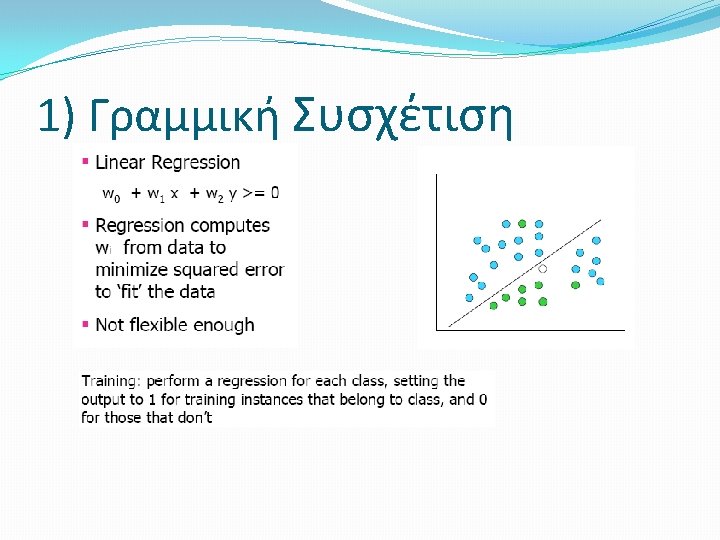
 �Σκοπός: Η οπτικοποίηση των δεδομένων για να διευκολυνθεί η κατανόηση συσχετίσεων �Π.")
 � Countries with similar quality-of-life factors end up clustered together. The countries")
 �This colour information can then be plotted onto a map of the")
 k-πλησιέστεροι γείτονες � The k-NN Rule: If the number of pre-classified points is")


 eqv. with hit rate, recall TPR")

. Training error is shown in blue,")

- Slides: 37
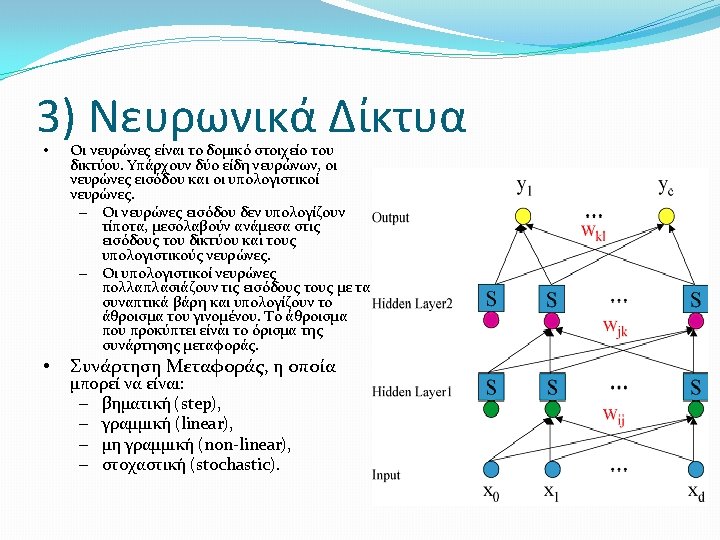
Βασικοί Στόχοι της Εξόρυξης Δεδομένων �Classification: predicting an item class �Clustering: finding clusters in data �Associations: e. g. A & B & C occur frequently �Visualization: to facilitate human discovery �Summarization: describing a group �Deviation Detection: finding changes �Estimation: predicting a continuous value �Link Analysis: finding relationships �…
Data Mining �Data Mining is an interdisciplinary field involving: �– Databases �– Statistics �– Machine Learning �– High Performance Computing �– Visualization �– Mathematics
Classification VS Clustering Classification Clustering �Supervised Learning �Unsupervised Learning
Οπτικοποίηση (Visulization) �Σκοπός: Η οπτικοποίηση των δεδομένων για να διευκολυνθεί η κατανόηση συσχετίσεων �Π. χ. Self-Organizes Maps (SOMs) �SOMs are commonly used as visualization aids. They can make it easy for us humans to see relationships between vast amounts of data �A SOM has been used to classify statistical data describing various quality-of-life factors such as state of health, nutrition, educational services etc.
Οπτικοποίηση (Visulization) � Countries with similar quality-of-life factors end up clustered together. The countries with better quality-of-life are situated toward the upper left and the most poverty stricken countries are toward the lower right. Each hexagon represents a node in the SOM.
Οπτικοποίηση (Visulization) �This colour information can then be plotted onto a map of the world like so:
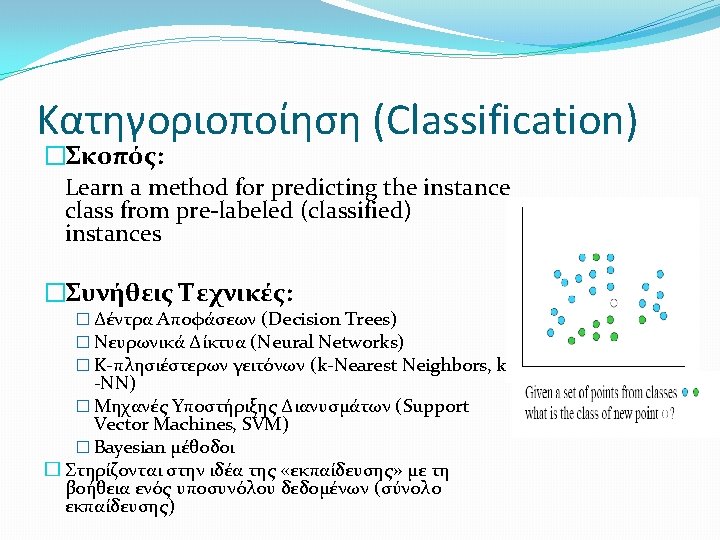
4) k-πλησιέστεροι γείτονες � The k-NN Rule: If the number of pre-classified points is large it makes good sense to use, instead of the single nearest neighbor, the majority vote of the nearest k neighbors. This method is referred to as the k-NN rule. �The number k should be: 1) large to minimize the probability of misclassifying x 2) small (with respect to the number of samples) so that the points are close enough to x to give an accurate estimate of the true class of x �Παραλλαγές: Weighted K-nn
Μετρικές Ακρίβειας �Sensitivity or true positive rate (TPR) eqv. with hit rate, recall TPR = TP / P = TP / (TP + FN) �False positive rate (FPR) eqv. with fall out FPR = FP / N = FP / (FP + TN) � Accuracy ACC = (TP + TN) / (P + N) �Positive predictive value (PPV) eqv. with precision PPV = TP / (TP + FP) actual value predi ction outc ome total p n total p' True False Posit ive P' n' False True Nega tive N' P N
F - score �The F score can be interpreted as a weighted average of the precision and recall, where an F score reaches its best value at 1 and worst score at 0. �The traditional F-measure or balanced F-score (F score) is the harmonic mean of precision and recall:
Overfitting/Overtraining in supervised learning (e. g. neural network). Training error is shown in blue, validation error in red. If the validation error increases while the training error steadily decreases then a situation of overfitting may have occurred.