Classification And Regression Tree analysis with Stata Wim


 dead(rfi) hea st(n f at)")
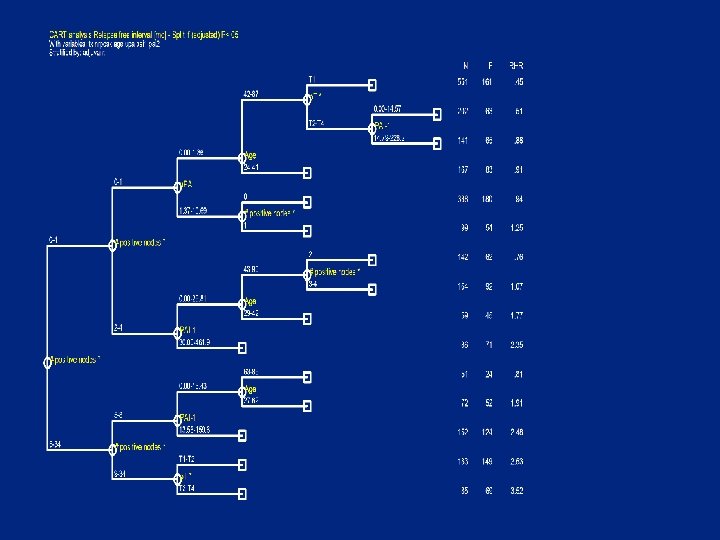
![Relapse free interval [mo] -------------Events: Relapse indicator Time [mnth] N _____60__ ____120__ REL RF%](https://slidetodoc.com/presentation_image_h/82f01dea0d6da7cb9b7093ade40439c2/image-6.jpg "Relapse free interval [mo] -------------Events: Relapse indicator Time [mnth] N _____60__ ____120__ REL RF%")
 group if splittable Repeat")
 fail(rfi) IRA assuming Hazard")

")


![cart. ado syntax cart varlist [if] [in] , time(var) fail(var) [ strata(varlist) adjust(varlist) pval(real](https://slidetodoc.com/presentation_image_h/82f01dea0d6da7cb9b7093ade40439c2/image-19.jpg "cart. ado syntax cart varlist [if] [in] , time(var) fail(var) [ strata(varlist) adjust(varlist) pval(real")


")
- Slides: 39
Classification And Regression Tree analysis with Stata Wim van Putten University Hospital Rotterdam Erasmus Medical Center Daniel den Hoed Cancer Center Department of Statistics NL Stata Users meeting, Maastricht, May 23, 2002
Rotterdam Breast Cancer series 3001 | Adjuvant treatment | no yes | Total ------+-----------+-----Number | 2094 907 | 3001 Year of surgery Range | 1978 -1993 Median | 1988 Age Mean; SD Range Median | | | 57; 13 25 -90 57 1979 -1993 | 1978 -1993 1989 | 1988 51; 12 | 24 -88 | 50 | 55; 13 24 -90 54
Rotterdam Breast Cancer series 3001 | Adjuvant treatment | no yes | Total ------+-----------+-----Age row % <=40 | 58 42 | 415 >40 -<=55 | 63 37 | 1165 >55 -<=70 | 77 23 | 1005 >70 | 81 19 | 416 p. T * T 1 | 76 24 | 1389 T 2 | 67 33 | 1311 T 3 | 50 50 | 169 T 4 | 58 42 | 132 # positive nodes * 0 | 99 1 | 1444 1 | 33 67 | 369 2 -4 | 39 61 | 537 5 -8 | 53 47 | 329 >8 | 48 52 | 322
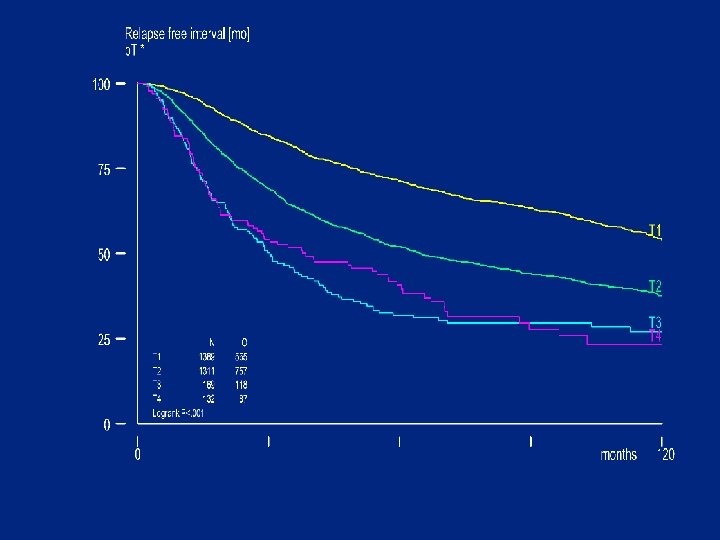
. sby agek tx np 5 adjuvant , time(rf) dead(rfi) hea st(n f at) actlab(RF) flab(REL) at(60, 120) Relapse free interval [mo] -------------Events: Relapse indicator Time [mnth] N _____60__ ____120__ REL RF% #at age in classes <=40 415 >40 -<=55 1165 >55 -<=70 1005 >70 416 256 567 516 188 50 63 60 59 192 672 538 180 33 48 44 47 57 228 160 38 p. T * T 1 T 2 T 3 T 4 565 757 118 87 71 52 32 41 894 608 44 36 54 38 27 23 273 187 17 6 1389 1311 169 132
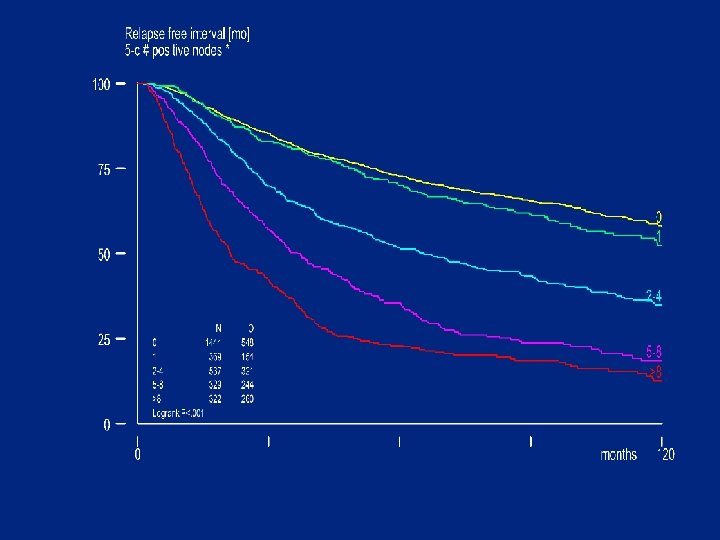
Relapse free interval [mo] -------------Events: Relapse indicator Time [mnth] N _____60__ ____120__ REL RF% #at # positive nodes * 0 1444 548 1 369 154 2 -4 537 321 5 -8 329 244 >8 322 260 73 70 52 35 23 948 230 250 93 61 58 52 35 19 13 307 69 70 20 17 Adjuvant treatment no 2094 1015 yes 907 512 62 1161 53 421 47 37 378 105
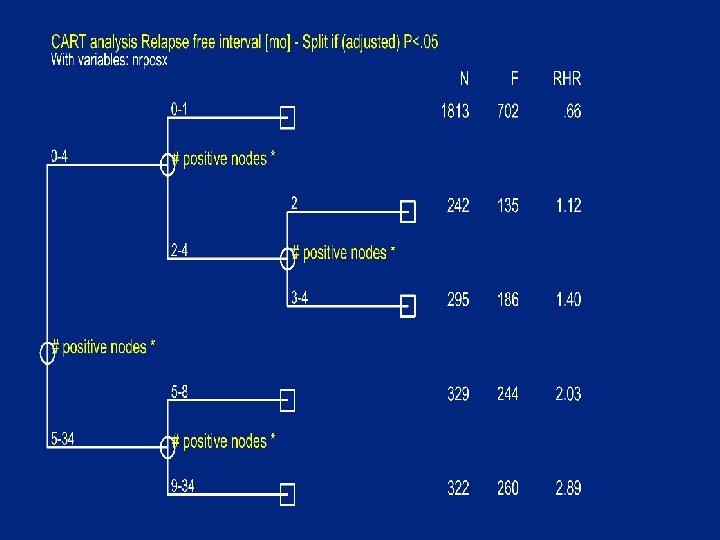
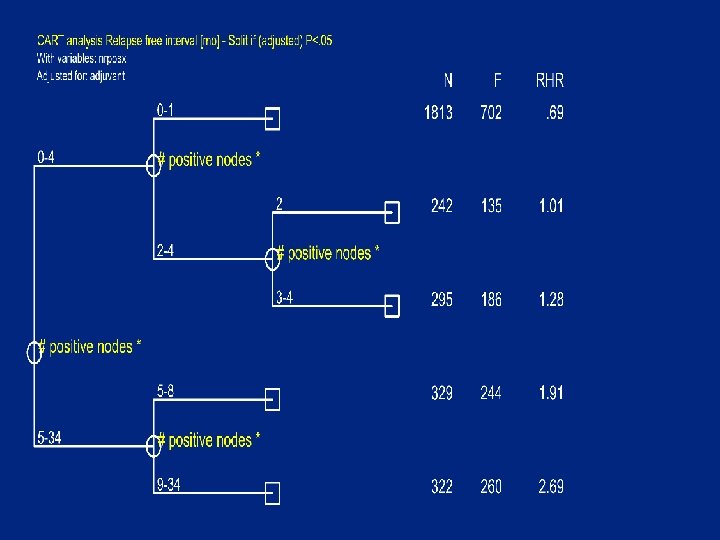
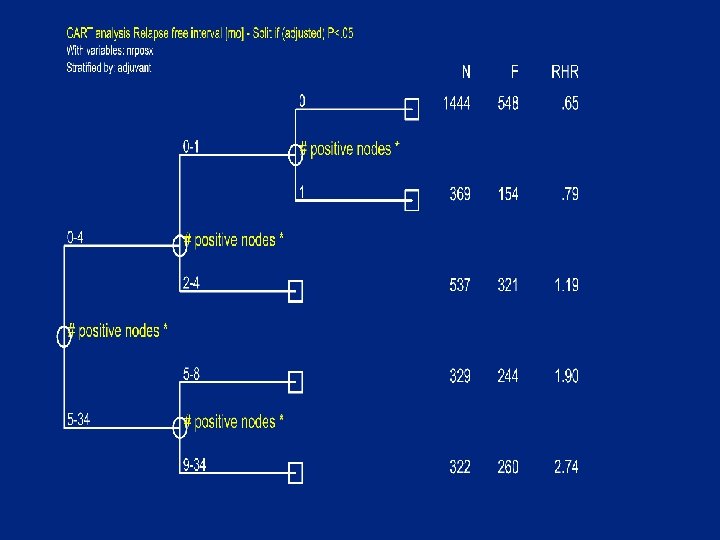
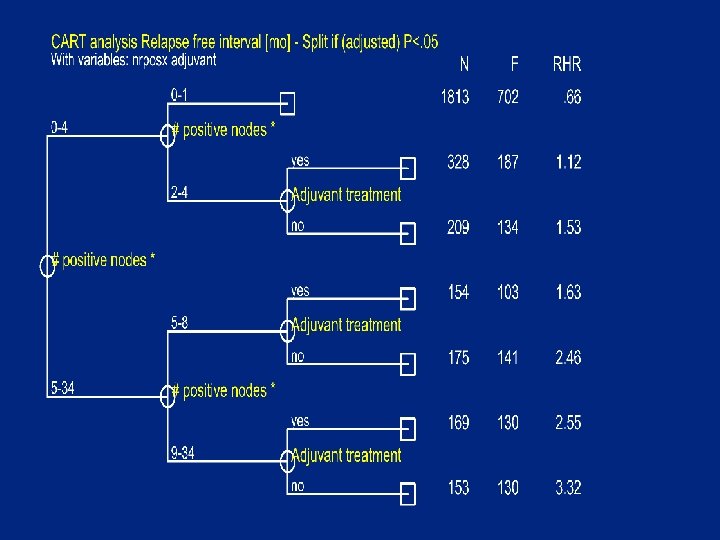
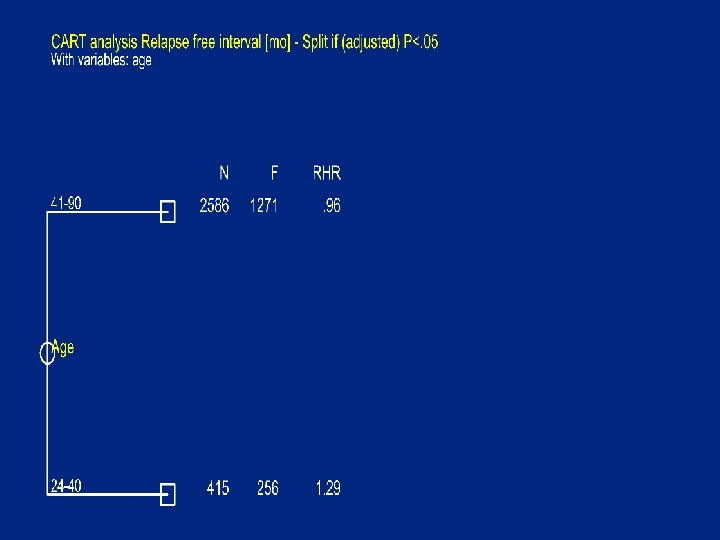
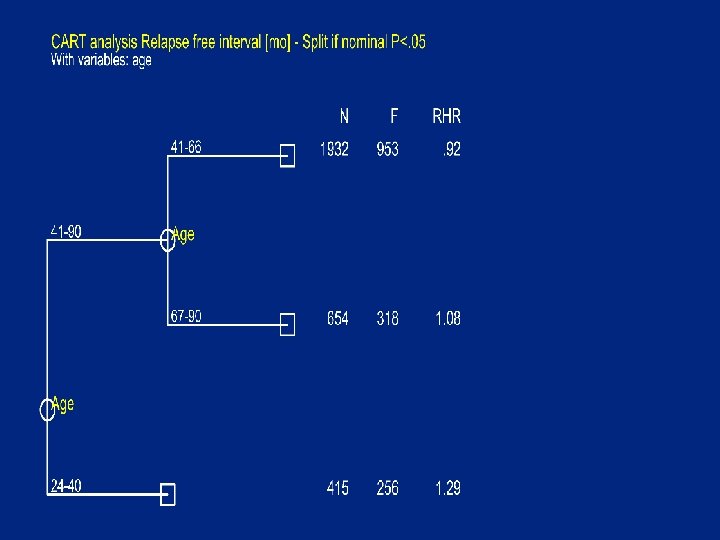
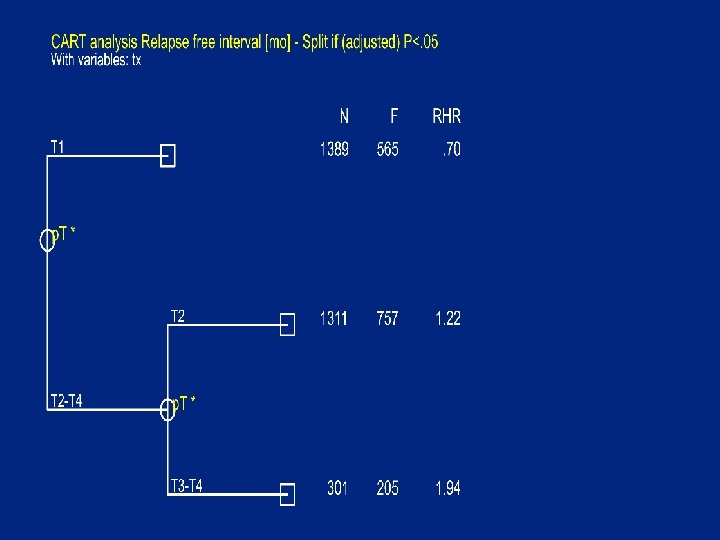
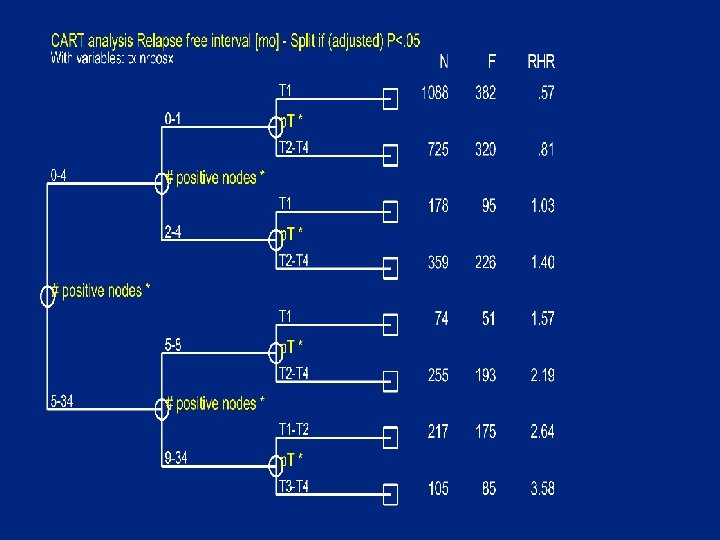
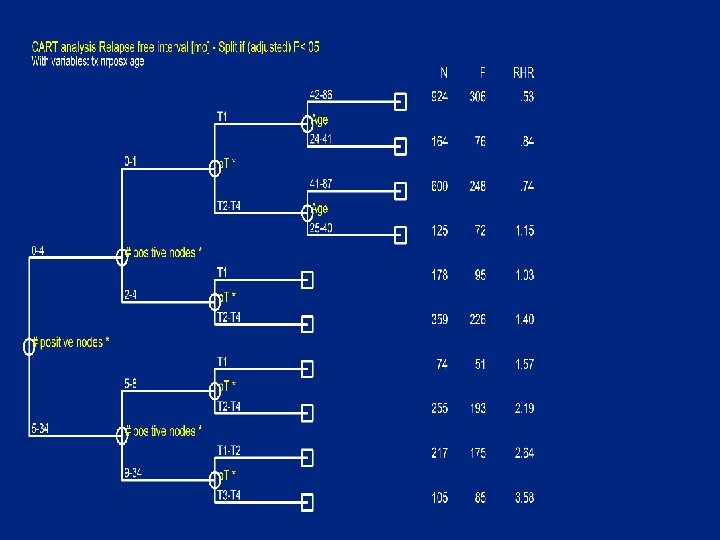
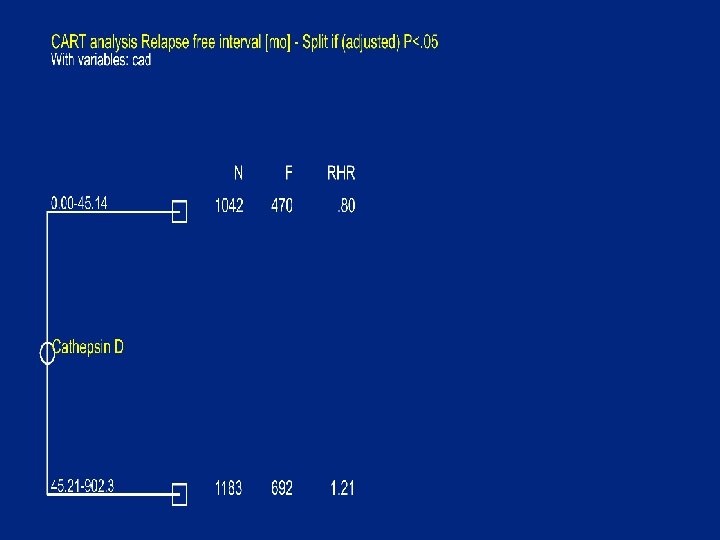
CART steps • • Start with full group Split (graft) group if splittable Repeat until all groups unsplittable No pruning or amalgamation of small groups • Show the results with a tree (+ tables )
Isotonic regression analysis: # positive nodes. srd nrposx , time(rf) fail(rfi) IRA assuming Hazard Rate (O/E) increasing with nrposx N O HR -------------0 - 0 1443 548 0. 6 1 - 1 369 154 0. 7 2 - 2 242 135 1. 1 3 - 4 295 186 1. 4 5 - 5 109 84 1. 9 6 - 6 93 67 2. 0 7 - 8 127 93 2. 2 9 - 10 117 92 2. 8 11 - 16 154 122 2. 9 17 - 30 49 44 3. 1 34 - 34 2 2 8. 1 -------------
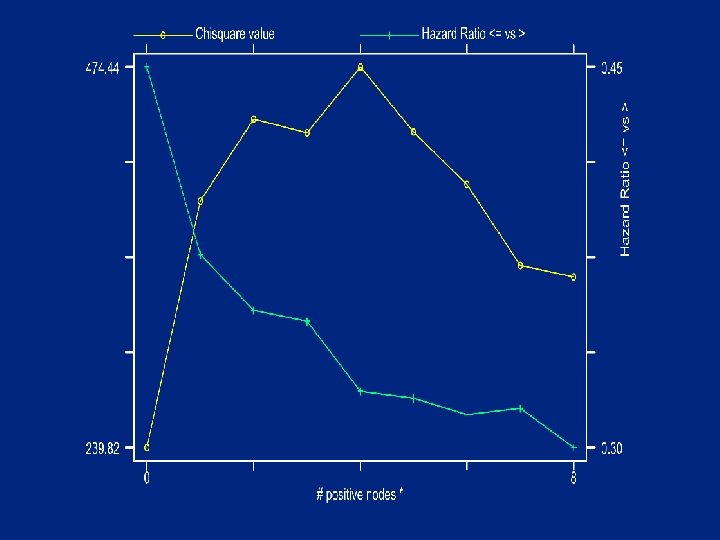
Cutpoint for # positive nodes with max Chi square Optimal cutpoint of nrposx at 4 with chisquare value 474. 438 P-value nominal 3. 5 e-105 adjusted (Miller&Siegmund) 4. 9 e-102 adjusted (Worsley) -4. 4 e-103 ? ? ? # cutpoints 9
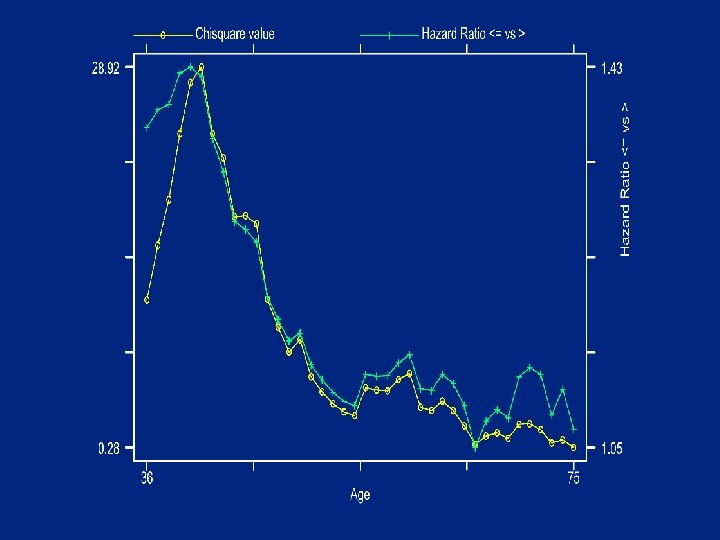
Isotonic regression analysis: Age adjusted for # positive nodes. xxi: srd age , time(rf) fail(rfi) adjust(i. np 5) IRA assuming Hazard Rate (O/E) decreasing with age N O HR -------------24 - 24 1 1 3. 90 25 - 26 4 3 2. 95 27 - 34 133 84 1. 48 35 - 40 277 168 1. 29 41 - 41 47 27 1. 21 42 - 46 417 208 1. 00 47 - 60 1041 516 0. 95 61 - 81 1053 514 0. 93 82 - 82 3 1 0. 68 83 - 83 9 3 0. 52 84 - 90 15 2 0. 34 --------------
Cutpoint for age with max Chi square Optimal cutpoint of age at 41 with chisquare value 28. 921 P-value nominal 7. 5 e-08 adjusted (Miller&Siegmund) 6. 6 e-06 adjusted (Worsley) 2. 1 e-06 # cutpoints 40
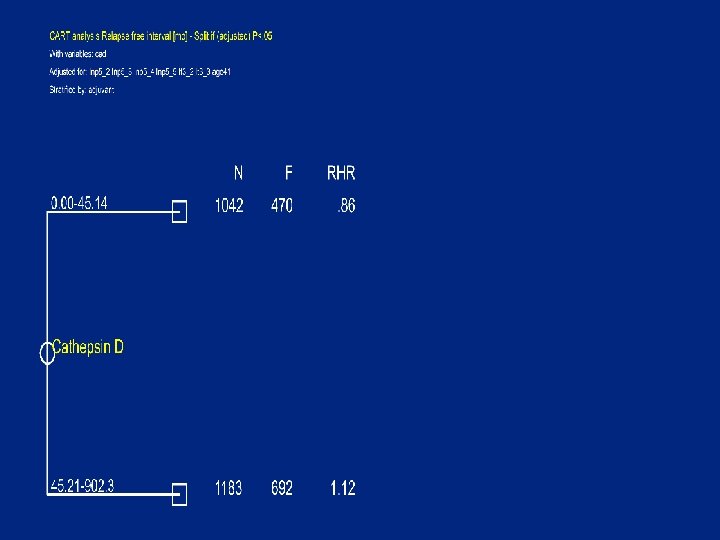
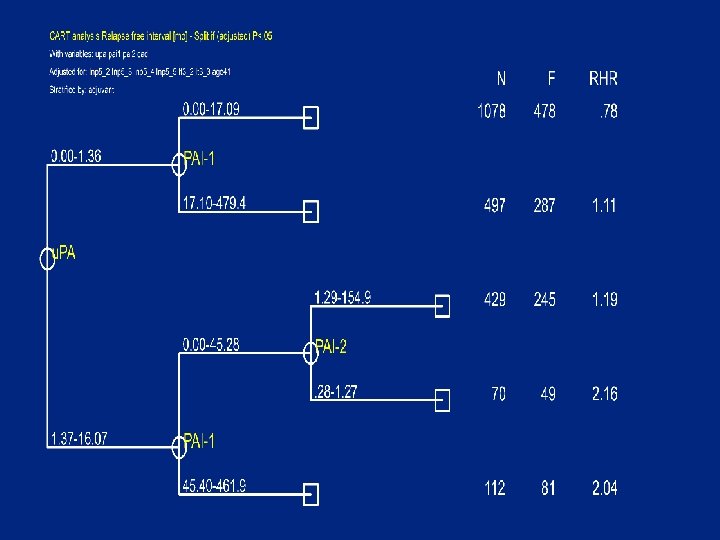
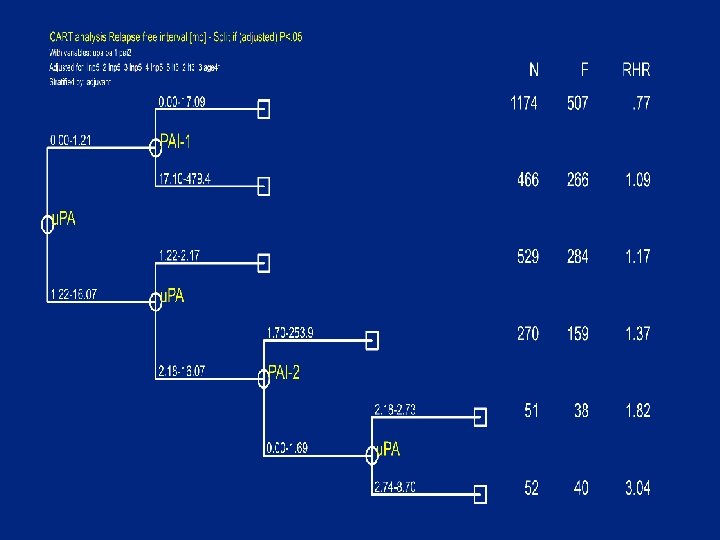
Split criteria • A group is splittable if • # failures in group >=Min. Fail (10) • and there is a covariate X with cutpoint C : – # {obs X<=C} >=Min. Size (10) – # {obs X>C } >=Min. Size (10) – logrank test P- value (adjusted) <Pcrit (0. 05) • based on martingale residuals O-E with optional adjustment for and stratification by other covariates • Choose X and C with smallest (adj) P-value
References • • • Breiman et al, Classification and Regression trees, 1984 Lausen et al, Informatik, Biometrie und Epidemiologie in Medizin und Biologie 28, 1 -13, 1997 Lausen et al, in Computational Statistics, 483 -496, 1994 Schmoor et al, Stat in Med, 2351 -2366, 1993 Ciampi et al, J Clin Epidemiol, 675 -689, 1995 Ciampi et al, J Clin Epidemiol, 737 -748, 1988 Ciampi et al, Comp Statitics and Data analysis, 185 -204, 1986 Le. Blanc et al, Biometrics, 411 -425, 1992 Marubini et al, Stat in Med, 295 -303, 1983 Miller and Siegmund, Biometrics, 1011 -1016, 1982 Worsley, Technometrics, 25, 35 -42
Adjustment for multiple testing • Adjustment for search for optimal cutpoint (Miller & Siegmund, Worsley; see Lausen) • No adjustment for – multiple covariates – multiple subgroups
cart. ado syntax cart varlist [if] [in] , time(var) fail(var) [ strata(varlist) adjust(varlist) pval(real 0. 05) pnominal minsize(int 10) minfail(int 10) sumby(varlist) tabby(varlist) at(string) name(string) ] In the examples minsize(50) has been used
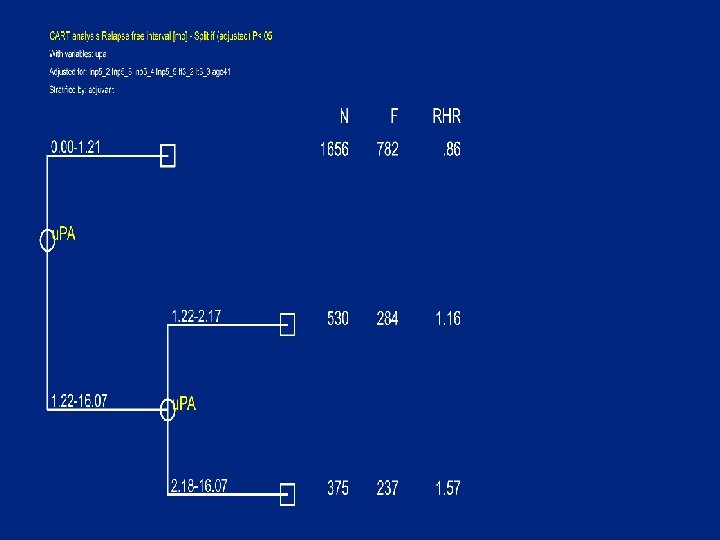
Not splittable if adjusted for nodes, T and age
Conclusions • • CART is a useful exploratory tool Helpful in case of one or a few covariates A way to choose cutpoints (if you want to) Model is not parsimonious Overfits “interactions” Underfits small/moderate general effects Probably best be used in addition to a regression model
CART can be done in Stata (next week)