Classic Urban Models Three models of urban structure
![Classic Urban Models Classic Urban Models](https://slidetodoc.com/presentation_image_h/f451f541f6db4982ba9445b4d7271b2d/image-1.jpg)
Classic Urban Models
![Three models of urban structure: – Concentric Zone model – Sector Model – Multiple Three models of urban structure: – Concentric Zone model – Sector Model – Multiple](http://slidetodoc.com/presentation_image_h/f451f541f6db4982ba9445b4d7271b2d/image-2.jpg)
Three models of urban structure: – Concentric Zone model – Sector Model – Multiple Nuclei Model Use of the models outside North America: – European cities – LDC’s
![A. Concentric Zone Model 1. Ernest Burgess (1920 s): depicts use of urban land A. Concentric Zone Model 1. Ernest Burgess (1920 s): depicts use of urban land](http://slidetodoc.com/presentation_image_h/f451f541f6db4982ba9445b4d7271b2d/image-3.jpg)
A. Concentric Zone Model 1. Ernest Burgess (1920 s): depicts use of urban land as a set of concentric rings - each ring devoted to a different land use (studied Chicago)
![2. Concentric Zones: Zone I: Central Business District (CBD) that is the most accessible 2. Concentric Zones: Zone I: Central Business District (CBD) that is the most accessible](http://slidetodoc.com/presentation_image_h/f451f541f6db4982ba9445b4d7271b2d/image-4.jpg)
2. Concentric Zones: Zone I: Central Business District (CBD) that is the most accessible zone where most of the tertiary employment is located Zone II: Zone of Transition where many industrial activities locate (nearby labor, markets, transport terminals like ports & rail) Zone III: Zone of Independent Workers is used by some industrial activities in inner cities and ethnic enclaves - contains the poorest segment of the urban population Zone IV: Zone of Better Residences is dominated by the working class (often second generation immigrants) Zone V: Commuter Zone represents higher quality suburban housing linked with higher commuting costs
![Social Area Analysis: Percent Renters IN Indianapolis, IN The distribution of renters in Indianapolis Social Area Analysis: Percent Renters IN Indianapolis, IN The distribution of renters in Indianapolis](http://slidetodoc.com/presentation_image_h/f451f541f6db4982ba9445b4d7271b2d/image-5.jpg)
Social Area Analysis: Percent Renters IN Indianapolis, IN The distribution of renters in Indianapolis illustrates the concentric zone model
![3. Concentric Zone Weaknesses: – too simple – developed for American cities – cars 3. Concentric Zone Weaknesses: – too simple – developed for American cities – cars](http://slidetodoc.com/presentation_image_h/f451f541f6db4982ba9445b4d7271b2d/image-6.jpg)
3. Concentric Zone Weaknesses: – too simple – developed for American cities – cars uncommon at time (horses & streetcars) – assumes reliance on public transit – lots of spatial differences in terms of ethnic & social patterns
![B. Sector Model 1. study done in 1939 by Homer Hoyt in Chicago 2. B. Sector Model 1. study done in 1939 by Homer Hoyt in Chicago 2.](http://slidetodoc.com/presentation_image_h/f451f541f6db4982ba9445b4d7271b2d/image-7.jpg)
B. Sector Model 1. study done in 1939 by Homer Hoyt in Chicago 2. land use NOT random: defined by functional sectoral wedges - transportation “corridors” impact land uses - rail lines, major roads, public transport create “sectors”
![THE Hoyt “Se. CTOR MODEL” In his model, Hoyt is taking into account differences THE Hoyt “Se. CTOR MODEL” In his model, Hoyt is taking into account differences](http://slidetodoc.com/presentation_image_h/f451f541f6db4982ba9445b4d7271b2d/image-8.jpg)
THE Hoyt “Se. CTOR MODEL” In his model, Hoyt is taking into account differences in accessibility and, therefore, in land values along transportation routes
![Indianapolis: Household Income The distribution of high income households in Indianapolis is an example Indianapolis: Household Income The distribution of high income households in Indianapolis is an example](http://slidetodoc.com/presentation_image_h/f451f541f6db4982ba9445b4d7271b2d/image-9.jpg)
Indianapolis: Household Income The distribution of high income households in Indianapolis is an example of a sector model.
![C. Multiple Nuclei Model 1. the Harris & Ullman Multi-Nuclei Model (1945) looks at C. Multiple Nuclei Model 1. the Harris & Ullman Multi-Nuclei Model (1945) looks at](http://slidetodoc.com/presentation_image_h/f451f541f6db4982ba9445b4d7271b2d/image-10.jpg)
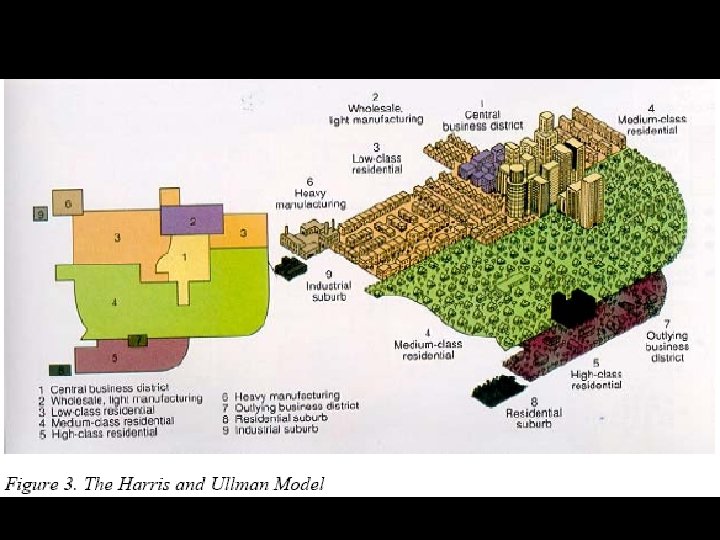
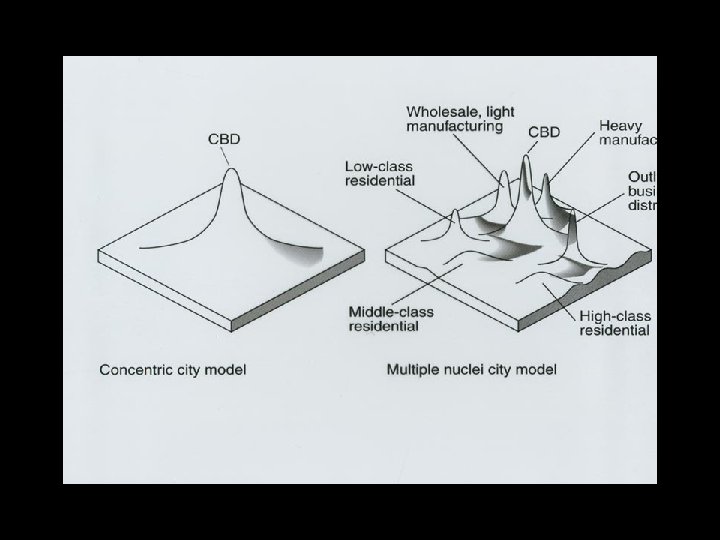
C. Multiple Nuclei Model 1. the Harris & Ullman Multi-Nuclei Model (1945) looks at a city as being multi-nucleated with a downtown center & satellite centers on the periphery – presence of many competing decentralized centers – reflects influence of automobile Five areas: 1. CBD 2. Wholesaling & light manufacturing area 3. Heavy industrial area 4. Residential areas 5. Outlying suburban areas
![](http://slidetodoc.com/presentation_image_h/f451f541f6db4982ba9445b4d7271b2d/image-11.jpg)
![Indianapolis: Ethnic Patterns The distribution of minorities in Indianapolis is an example of a Indianapolis: Ethnic Patterns The distribution of minorities in Indianapolis is an example of a](http://slidetodoc.com/presentation_image_h/f451f541f6db4982ba9445b4d7271b2d/image-12.jpg)
Indianapolis: Ethnic Patterns The distribution of minorities in Indianapolis is an example of a multiple nuclei model.
![URBAN MODEL COMPRISONS URBAN MODEL COMPRISONS](http://slidetodoc.com/presentation_image_h/f451f541f6db4982ba9445b4d7271b2d/image-13.jpg)
URBAN MODEL COMPRISONS
![](http://slidetodoc.com/presentation_image_h/f451f541f6db4982ba9445b4d7271b2d/image-14.jpg)
![St. Louis Metropolitan Area? The metropolitan area of St. Louis is spread over several St. Louis Metropolitan Area? The metropolitan area of St. Louis is spread over several](http://slidetodoc.com/presentation_image_h/f451f541f6db4982ba9445b4d7271b2d/image-15.jpg)
St. Louis Metropolitan Area? The metropolitan area of St. Louis is spread over several counties and two states.
![Typical Present-day U. S. City Typical Present-day U. S. City](http://slidetodoc.com/presentation_image_h/f451f541f6db4982ba9445b4d7271b2d/image-16.jpg)
Typical Present-day U. S. City
![The “Galactic” City The “Galactic” City](http://slidetodoc.com/presentation_image_h/f451f541f6db4982ba9445b4d7271b2d/image-17.jpg)
The “Galactic” City
![D. Social Differences in Cities 1. Urban life different due to: – large size D. Social Differences in Cities 1. Urban life different due to: – large size](http://slidetodoc.com/presentation_image_h/f451f541f6db4982ba9445b4d7271b2d/image-18.jpg)
D. Social Differences in Cities 1. Urban life different due to: – large size – high population density – social diversity
![E. Political Definitions of Cities 1. Urban settlements defined in three ways: – by E. Political Definitions of Cities 1. Urban settlements defined in three ways: – by](http://slidetodoc.com/presentation_image_h/f451f541f6db4982ba9445b4d7271b2d/image-19.jpg)
E. Political Definitions of Cities 1. Urban settlements defined in three ways: – by a legal boundary (a self-governing political unit) – a continuously built-up area – a functional area
- Slides: 19