Class 7 Regression Moderator Variables Heppner et al

Class 7: Regression: Moderator Variables Heppner et al. 2015 Chap 13; Frazier et al. (2004); Wei et al. , 2012

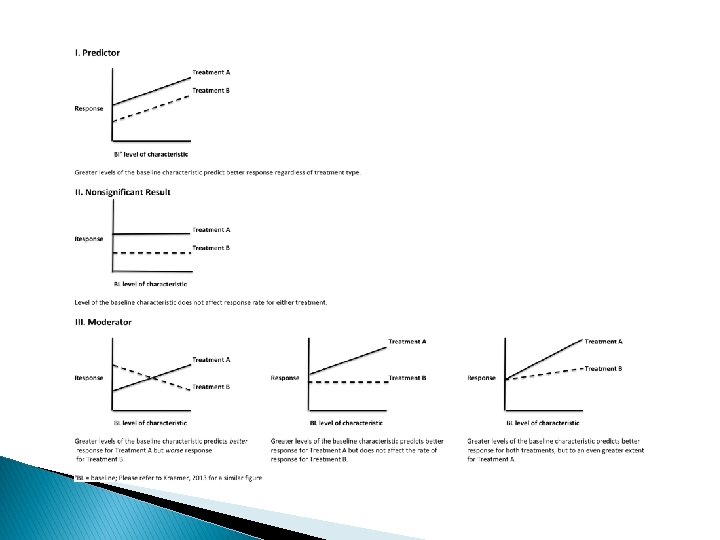
A moderator changes the strength and/or direction of the relation of an IV to a DV 2

Types of moderators 3
 Relation")
Moderation: Interaction Effect Predictor: Stress Criterion Depression Moderator: Social Support (also a predictor) Relation (+ - ; strength) of Stress to DEP among people with high SS (high = 1 SD above the mean) Versus Relation (+ - ; strength) of Stress to DEP among people with low SS (low = 1 SD below the mean)

Predictor: Stress A = Low Social Support Criterion: Depression B= Low Social Support

Moderation: Opposite Direction Effect

Moderation: No relation for level B; + relation for level A

Moderation Positive relation for levels A and B; stronger for A than B
 Control Variable Predictor Moderator(s) Criterion 10")
Wei et al. (2012) Control Variable Predictor Moderator(s) Criterion 10
 Control Variable: General Stress Predictor: Racial Discrimination Moderator(s): Ethnic Social")
Wei et al. (2012) Control Variable: General Stress Predictor: Racial Discrimination Moderator(s): Ethnic Social Conect. Mainstream Social Conect. Criterion PTSD 11

Wei et al. , 2012 Question 4 12

Rational for Hypotheses Moderation Ethnic Social Connection Moderation Racial Social Connection Control Variable 13
 Racial Discrimination would positively predict PTSD after controlling for general stress")
Hypotheses (p. 488) Racial Discrimination would positively predict PTSD after controlling for general stress The positive relation of Racial Discrimination to PTSD will be weaker for those high in Ethnic Social Connection. The positive relation of Racial Discrimination to PTSD will be weaker for those high in Mainstream Social Connection. 14

Wei et al. , 2012 15

Wei et al. , 2012 Question 5 f. 16

Where is the Mistake? 17

Plot Interaction Effect 1. http: //www. jeremydawson. co. uk/slopes. htm 2. Did they standardize the variables before conducting the regression. Yes- No 3. Select the appropriate Excel File in the web site – enter the name of the Predictor and moderator variables 4. Table 2: Obtain values for unstandardized (B) coefficients for the interaction effect. Constant = 3 5. Describe what the graph shows 18

Calculator to Select If you have two standardised variables, you can plot your interaction effect by entering the just unstandardised regression coefficients (including intercept/constant) in the following worksheet. If you have control variables in your regression, the values of the dependent variable displayed on the plot will be inaccurate unless you also standardise (or centre) all control variables first (although the pattern, and therefore the interpretation, will be correct). Note that the interaction term should not be standardised after calculation, but should be based on the standardised values of the IV & moderator. 2 -way_standardised. xls 19

2 -way_standardised. xls 20
 Slopes: Low Eth.")
v Graph Wei et al. , 2012 Interaction Effect (p. 490) Slopes: Low Eth. C B=. 42 High Eth. C B =. 29 - 43% diff in strength 5 4, 5 4 PTSD 3, 5 Low E Social C 3 High E Social C 2, 5 2 1, 5 1 Low Racial D High Racial D 21

Graph Wei et al. , 2012 Interaction Effect This worksheet plots two-way interaction effects for standardised variables. For further information see www. jeremydawson. co. uk/slopes. htm. Enter information from your regression in the shaded cells Variable names: Name of independent variable: Discrimination Name of moderator: Social C. Unstandardised Regression Coefficients: Independent variable: 0. 33 Moderator: -0. 06 Interaction: -0. 09 Intercept / Constant: 3 22

23

Interaction effect: College S-E Moderator 5 Persistence Attitudes 4, 5 4 3, 5 Low Self-Eff 3 High Self-Eff 2, 5 2 1, 5 1 Low Minority Stress High Minority Stress 24

Interaction effect: College S-E Moderator 25
- Slides: 25