Class 18 Effect Sizes Lipsey et al 2012
 Andrew Ho, Harvard Graduate School")
 Norm- vs. Criterion-Referenced Scores • wikipedia © Andrew Ho Harvard Graduate")
 Norm- vs. Criterion- Referenced Scores • Criterion-referenced scores reference performance to an absolute")
 Reporting Effects When you report your analyses, You must address: SIGNIFICANCE, SIGN, and")

: Referencing to pre-post change © Andrew Ho Harvard Graduate School")


- Slides: 32
Class 18: Effect Sizes (Lipsey et al. , 2012) Andrew Ho, Harvard Graduate School of Education Wednesday, November 6, 2017
Unit 1: 8) Norm- vs. Criterion-Referenced Scores • wikipedia © Andrew Ho Harvard Graduate School of Education 2
8) Norm- vs. Criterion- Referenced Scores • Criterion-referenced scores reference performance to an absolute criterion. – Proficient, Passing, “A” (assuming no curve) • When these terms describe tests, “norm-” has historically implied psychological and aptitude measurements, and “criterion-” has referred more to “achievement” tests. – This can imply differences in test design, particularly with the spread of item difficulties (more for norm-referenced tests, less for criterion-referenced tests). – But all tests can support norm- and criterion-referenced score interpretations. © Andrew Ho Harvard Graduate School of Education 3
1) Reporting Effects When you report your analyses, You must address: SIGNIFICANCE, SIGN, and SIZE Report whether you have detected an effect, or not. effect Report the direction of the effect you have the effect detected Report the magnitude of the effect you of the effect have detected. This means … report your hypothesis testing to stipulate whether the effect is different from zero in the population. This means … stipulate whether the effect is positive or negative. This means … give readers a sense of whether the effect is small, medium, or large, in context. Reporting magnitudes is one of the most tricky and important challenges to confront once you have found an effect. Ø There is a science of “effect size reporting” that addresses the substantive (as opposed to the statistical) nature of the effect. Ø The “New Statistics” (Cummings, 2014) [My related commentary in measurement. ] You can often achieve all this simultaneously, by plotting fitted trend lines for individuals who are prototypical for the population. Ø Classes on meta-analysis and power analysis address this. Ø We have one slide. © John Willett and Andrew Ho, Harvard Graduate School of Education Unit 1 d – Slide 4
Effect Sizes: Communicating the Magnitude of Coefficients Blind adherence to these guidelines is a sure sign of a lazy or inadequately trained intermediate statistician. I hesitate to even present them… From Cohen himself… When you report differences between groups, a difference of: ü. 2 st. dev. is Small ü. 5 st. dev. is Medium ü. 8 st. dev. is Large When you report relationships, a correlation of : ü. 10 is Small ü. 30 is Medium ü. 50 is Large "The terms 'small, ' 'medium, ' and 'large' are relative, not only to each other, but to the area of behavioral science or even more particularly to the specific content and research method being employed in any given investigation. . In the face of this relativity, there is a certain risk inherent in offering conventional operational definitions for these terms for use in power analysis in as diverse a field of inquiry as behavioral science. This risk is nevertheless accepted in the belief that more is to be gained than lost by supplying a common conventional frame of reference which is recommended for use only when no better basis for estimating the ES [Effect Size] index is available. " (Cohen, 1988, p. 25, emphasis added) © Andrew Ho and John Willett, Harvard Graduate School of Education Unit 1 d – Slide 5
Lipsey et al. (2012): Referencing to pre-post change © Andrew Ho Harvard Graduate School of Education 6
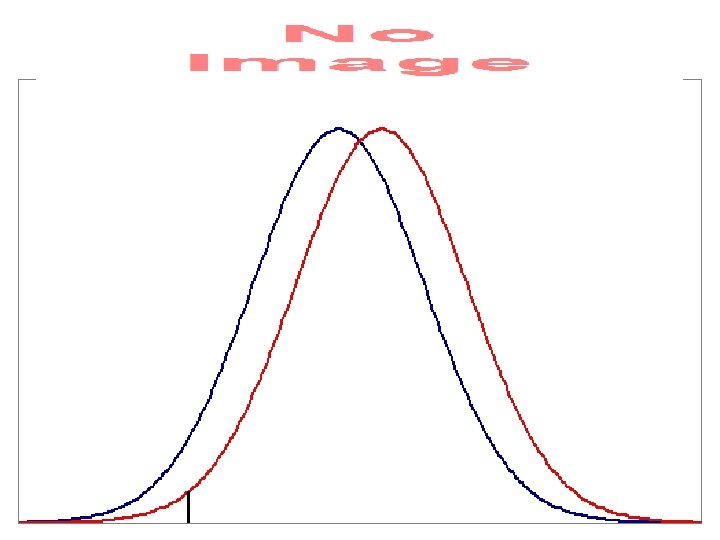
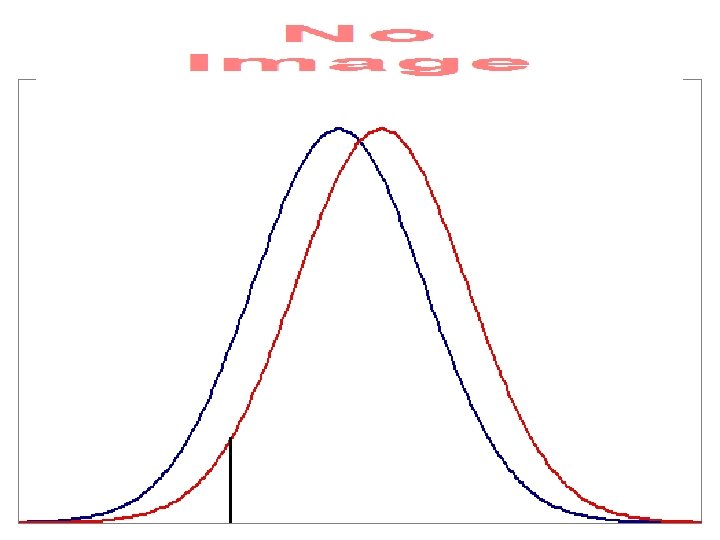
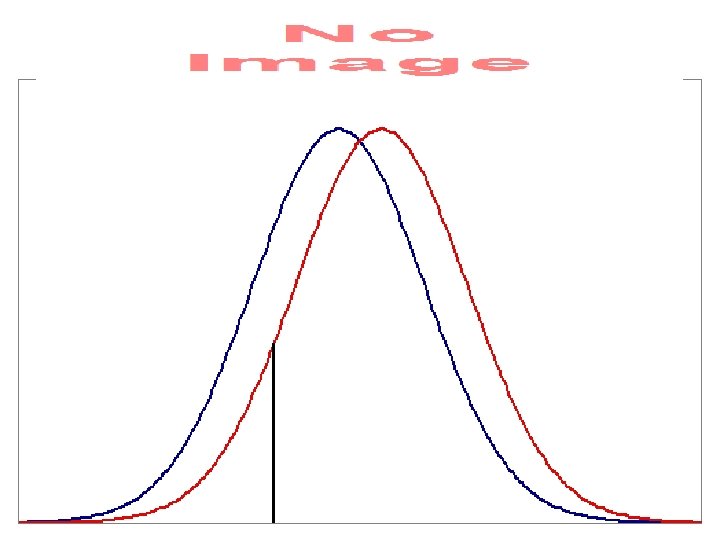
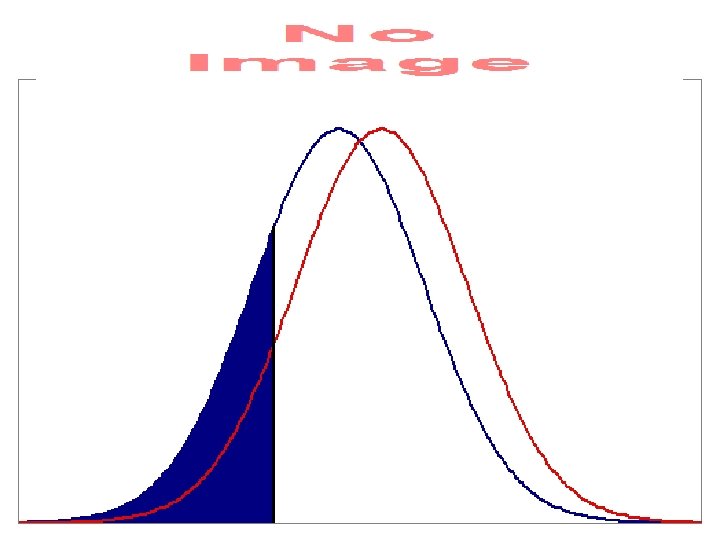
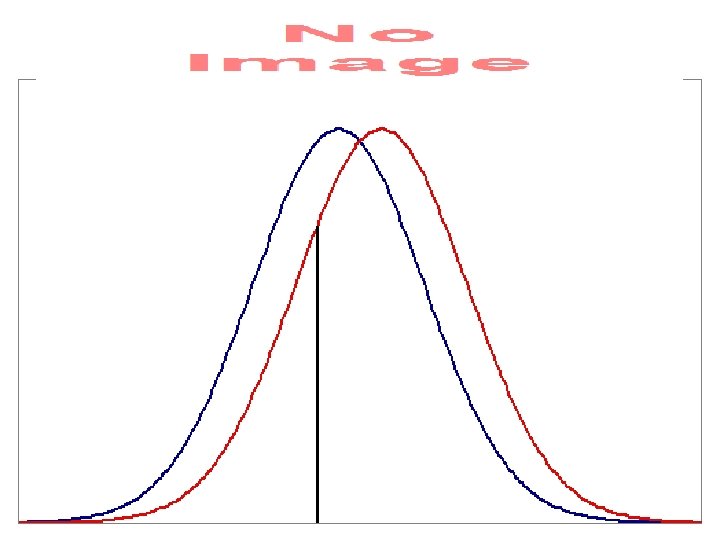
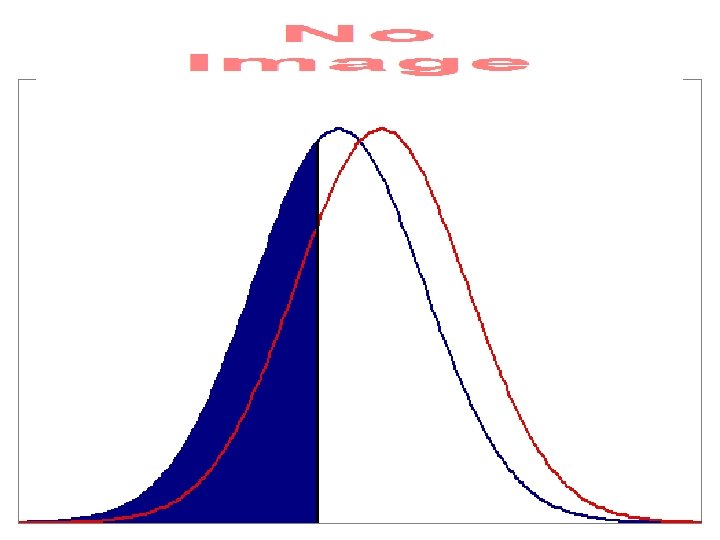
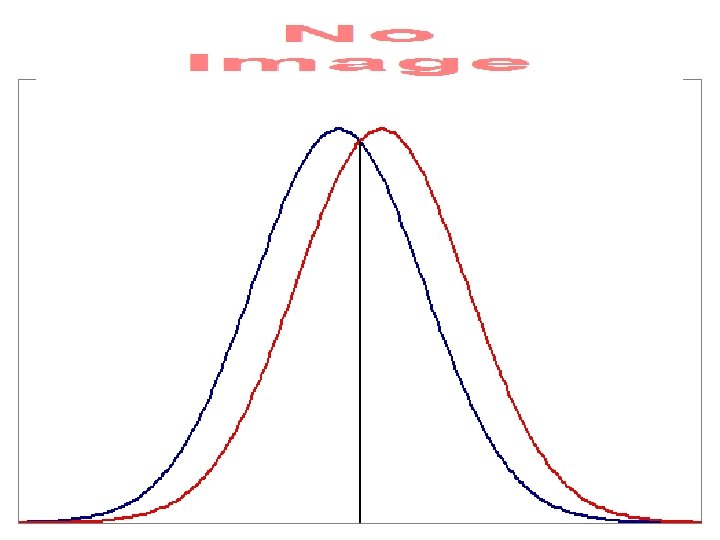
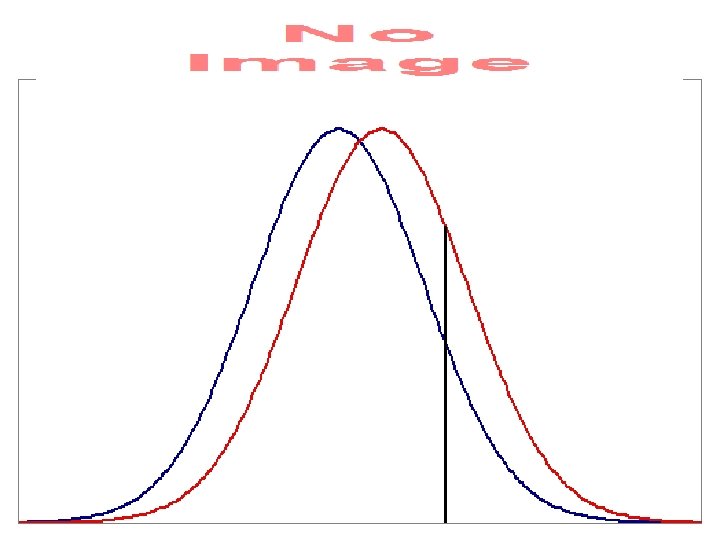
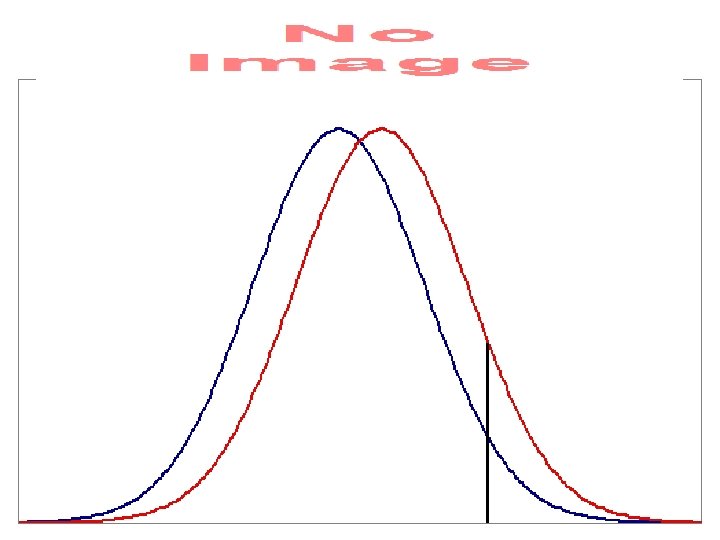
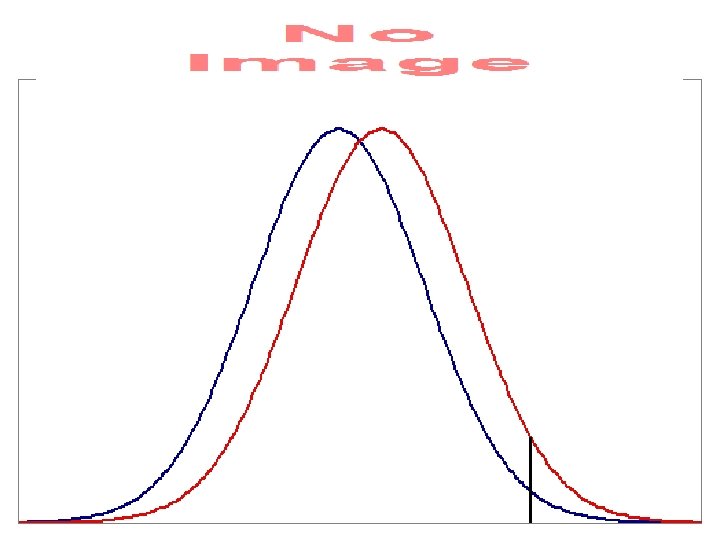
Overlap in distributions © Andrew Ho Harvard Graduate School of Education 7
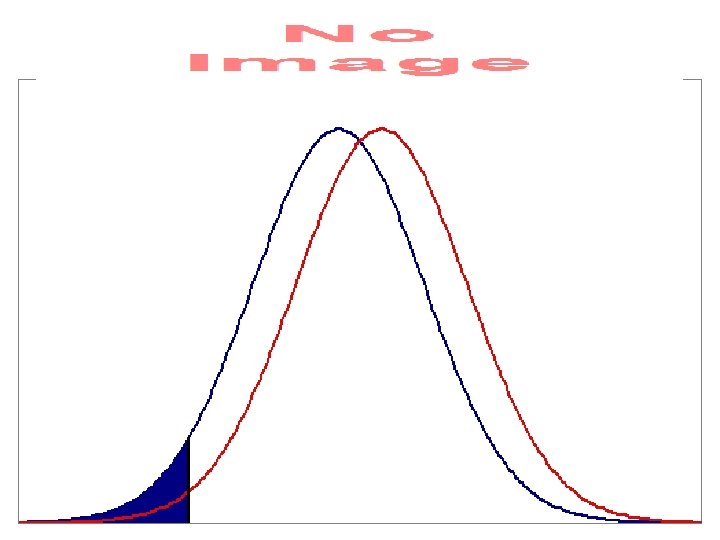
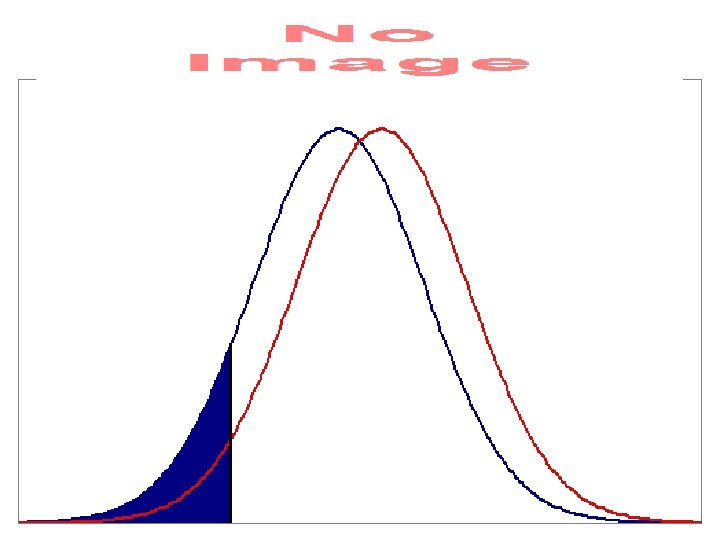
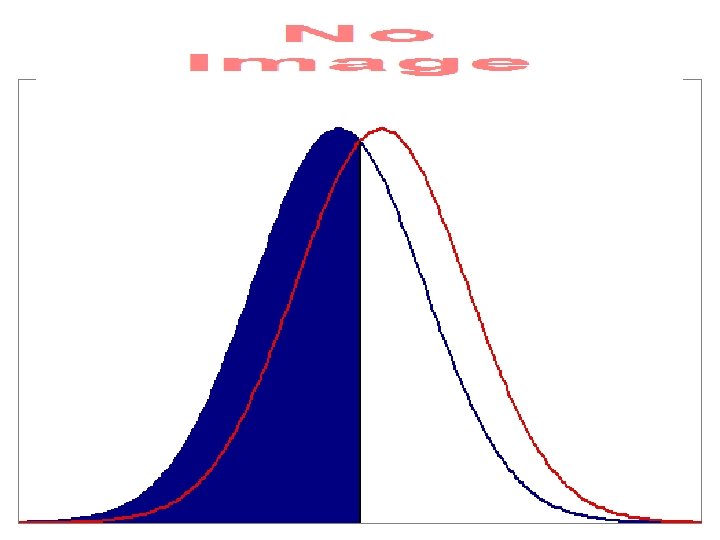
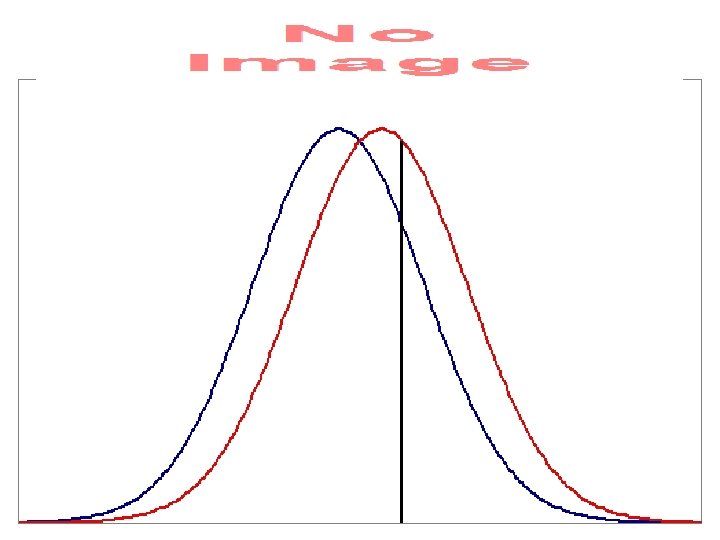
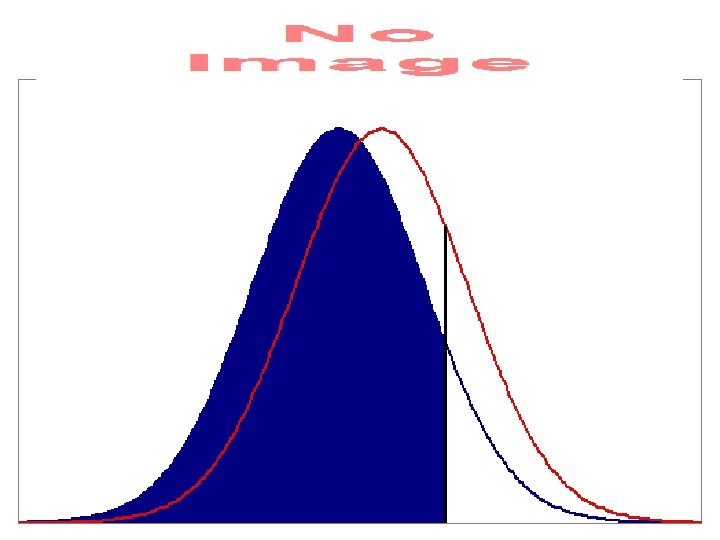
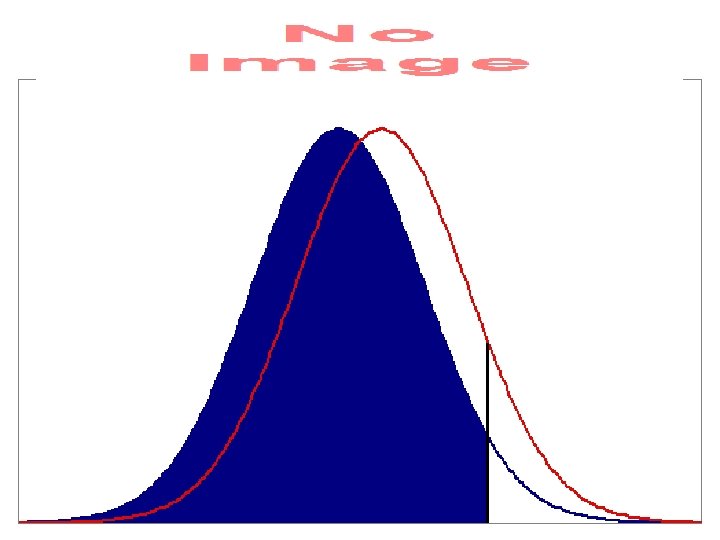
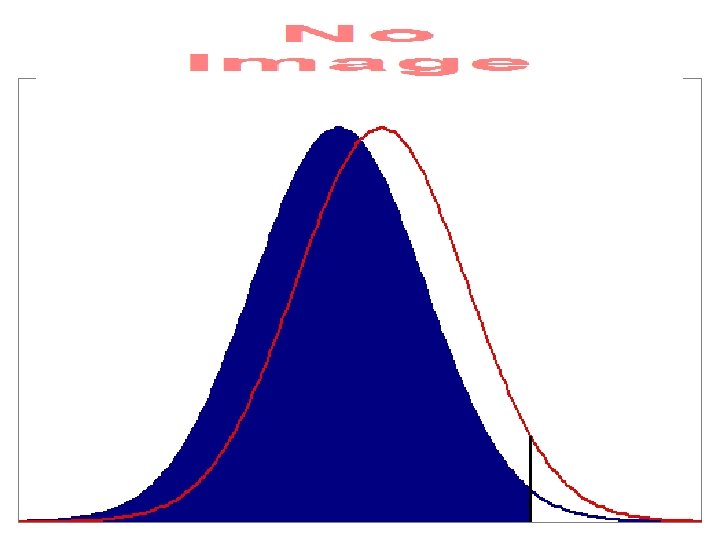
Percent above percentiles © Andrew Ho Harvard Graduate School of Education 8
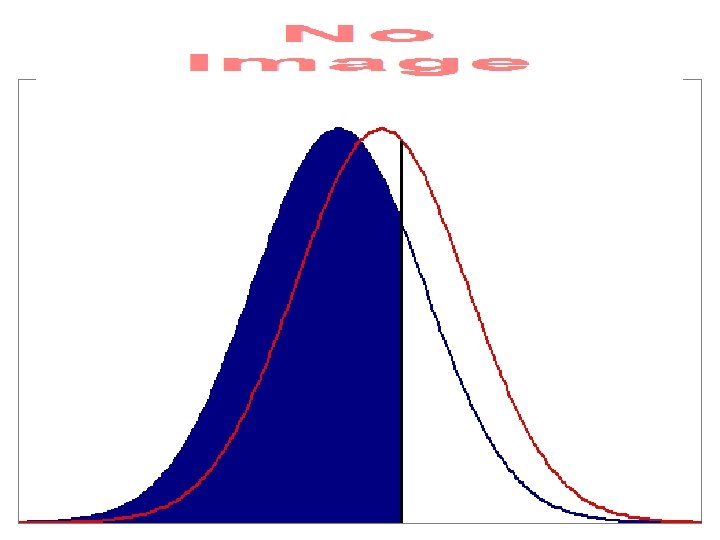
Percent above cut, binomial effect size © Andrew Ho Harvard Graduate School of Education 9
With continuous rank data Part of a general two-sample toolkit:
Months of learning © Andrew Ho Harvard Graduate School of Education 30
Referencing to achievement gaps © Andrew Ho Harvard Graduate School of Education 31
Cost-effectiveness, cost-benefit © Andrew Ho Harvard Graduate School of Education 32