
City rents in a global context Maurizio Grilli
City rents in a global context Maurizio Grilli & Richard Barkham June 2012
Aim of the research ■ Most models looking at the determinants of rental change generally aim at explaining rental changes in the short-run. Models can be macro (mostly TS) or micro (mostly crosssectional). ■ We aim at establishing an intuitive hierarchy of rental values across markets. ■ The markets we analyse here are urban conurbations across the globe. We believe that property investment is essentially citydriven (rather than country-driven) and, as a result of on-going urban growth, it is vital to be able to pick those cities which will outperform.
The rationale ■ By understanding the drivers behind rental values, an investor may acquire assets in the markets that are currently under-rented and thereby out-perform competitors. Vice versa investors can avoid the high risks associated with over-rented markets. ■ By taking a long-run perspective, subject to accurate forecasts of the drivers of rental values, an investor may deploy capital in the markets that will deliver the highest capital value uplift.
The cities ■ Half of the world’s population live in cities and these generate more than 80% of global GDP. The top 600 cities (equivalent to 20% of the world’s population) deliver 60% of global GDP. In 2030, the top cities will still provide most of total GDP, but the names of those cities will be different. ■ A successful city will generally have most, if not all, of the following features: – – – Large size, in terms of population, GDP and real estate stock; A strong and diversified economy including advanced business services; A well-educated workforce; High level of connectivity; Low levels of crime; A good transport system; Good entertainment and cultural offer; A general sense of vibrancy and innovation; High standard of liveability; A cosmopolitan feeling; A responsible environmental policy.
The data ■ By drawing on the Grosvenor in-house database we were able to collect office and retail rental data for 140 cities. This was supplemented with residential rental data for more than 110 cities. ■ The explanatory variables found to be most important are as follows: – GDP; – Connectivity; – Quality of life; – Population density; – Planning constraints.
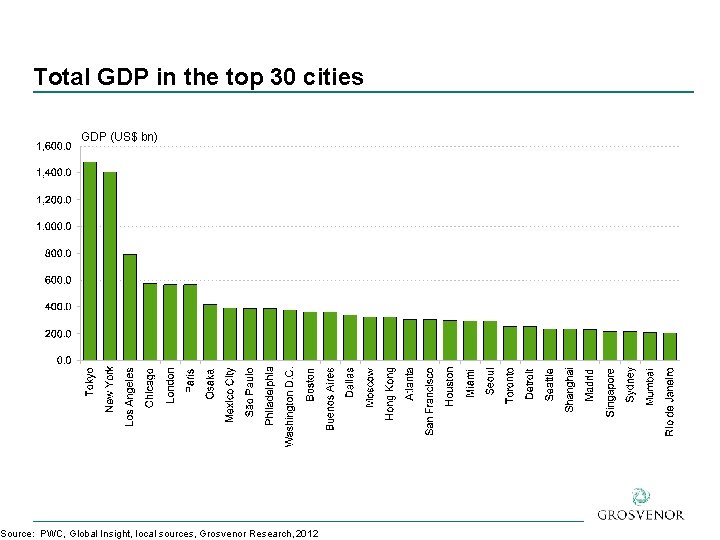
Total GDP in the top 30 cities GDP (US$ bn) Source: PWC, Global Insight, local sources, Grosvenor Research, 2012
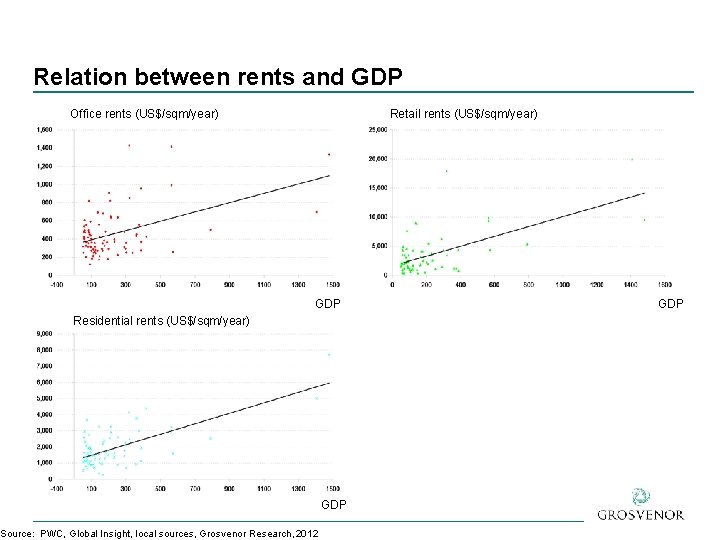
Relation between rents and GDP Office rents (US$/sqm/year) Retail rents (US$/sqm/year) GDP Residential rents (US$/sqm/year) Source: PWC, Global Insight, local sources, Grosvenor Research, 2012 GDP
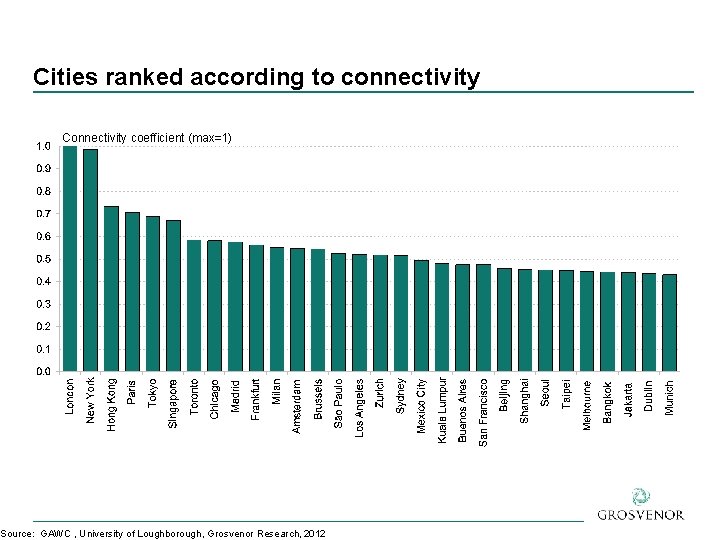
Cities ranked according to connectivity Connectivity coefficient (max=1) Source: GAWC , University of Loughborough, Grosvenor Research, 2012
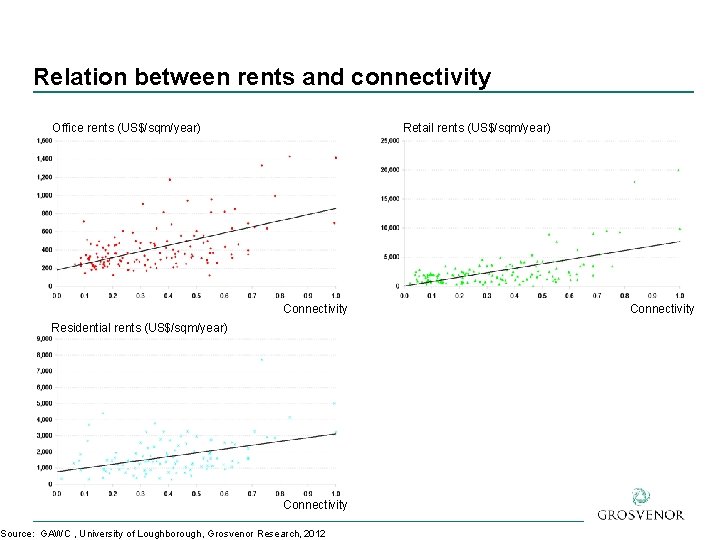
Relation between rents and connectivity Office rents (US$/sqm/year) Retail rents (US$/sqm/year) Connectivity Residential rents (US$/sqm/year) Connectivity Source: GAWC , University of Loughborough, Grosvenor Research, 2012 Connectivity
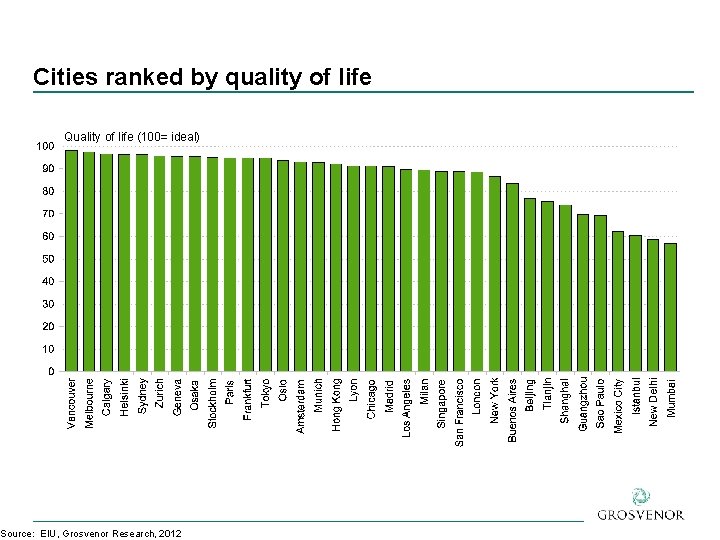
Cities ranked by quality of life Quality of life (100= ideal) Source: EIU, Grosvenor Research, 2012
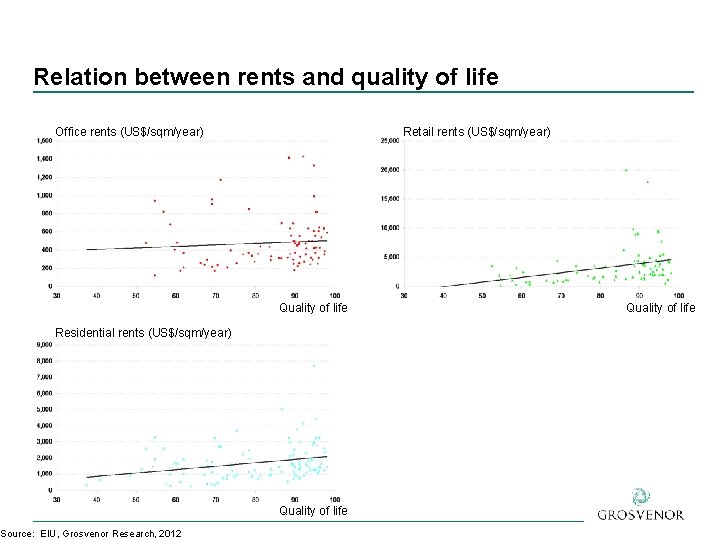
Relation between rents and quality of life Office rents (US$/sqm/year) Retail rents (US$/sqm/year) Quality of life Residential rents (US$/sqm/year) Source: EIU, Grosvenor Research, 2012 Quality of life
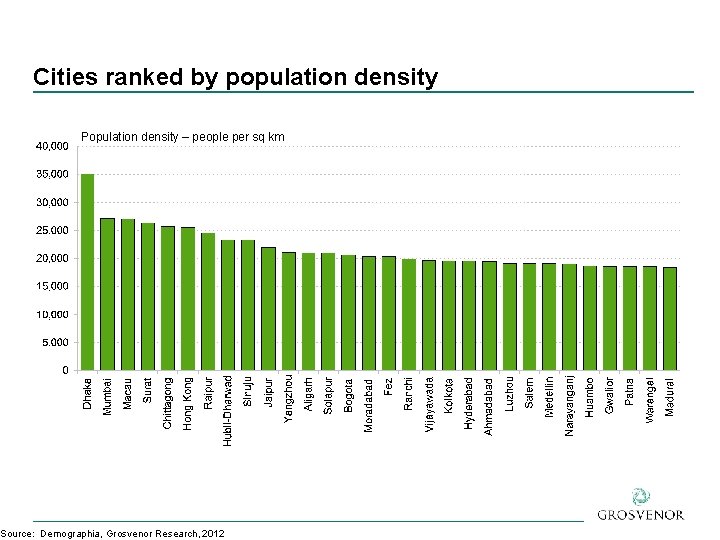
Cities ranked by population density Population density – people per sq km Source: Demographia, Grosvenor Research, 2012
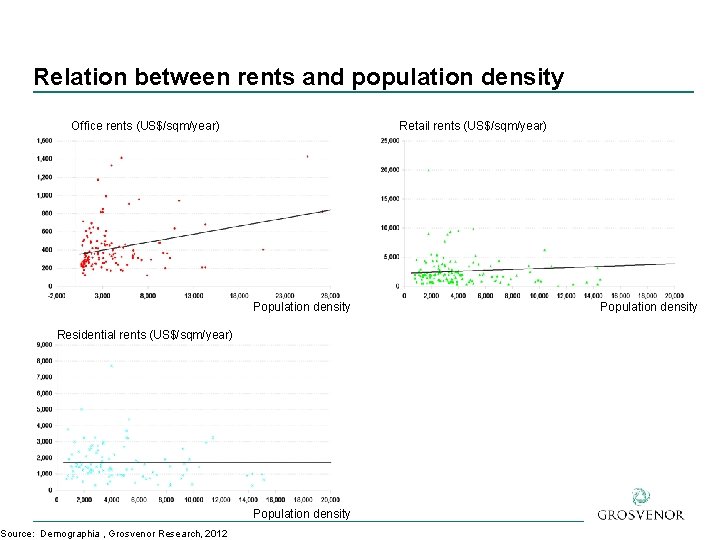
Relation between rents and population density Office rents (US$/sqm/year) Retail rents (US$/sqm/year) Population density Residential rents (US$/sqm/year) Source: Demographia , Grosvenor Research, 2012 Population density
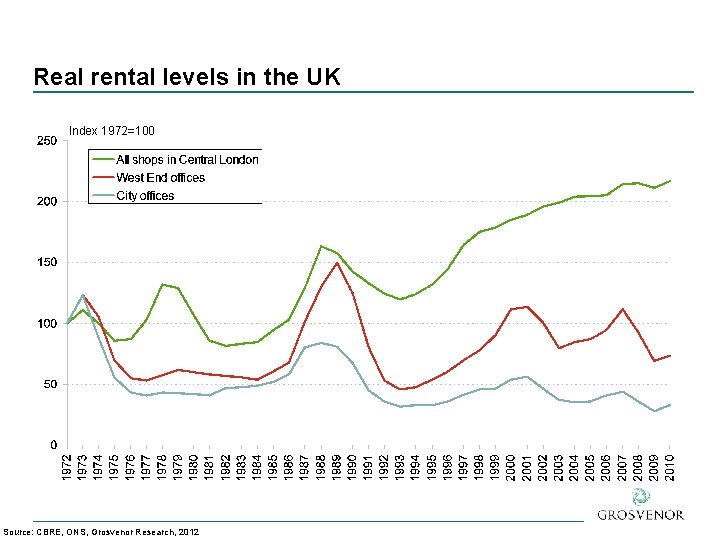
Real rental levels in the UK Index 1972=100 Source: CBRE, ONS, Grosvenor Research, 2012
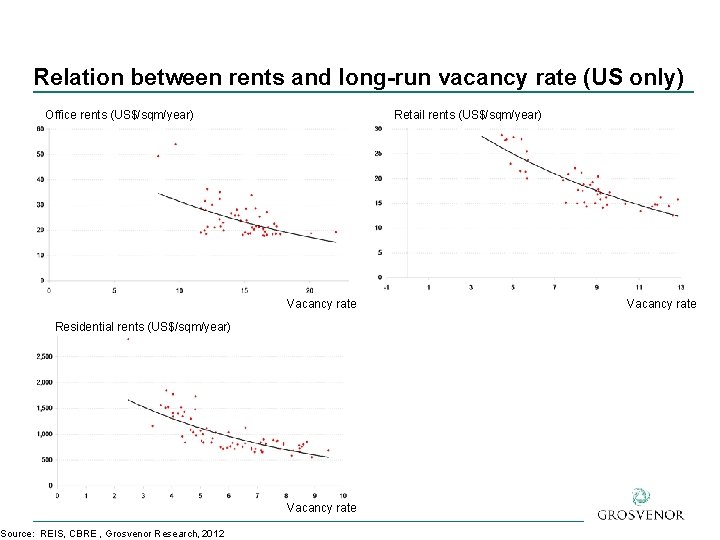
Relation between rents and long-run vacancy rate (US only) Office rents (US$/sqm/year) Retail rents (US$/sqm/year) Vacancy rate Residential rents (US$/sqm/year) Source: REIS, CBRE , Grosvenor Research, 2012 Vacancy rate
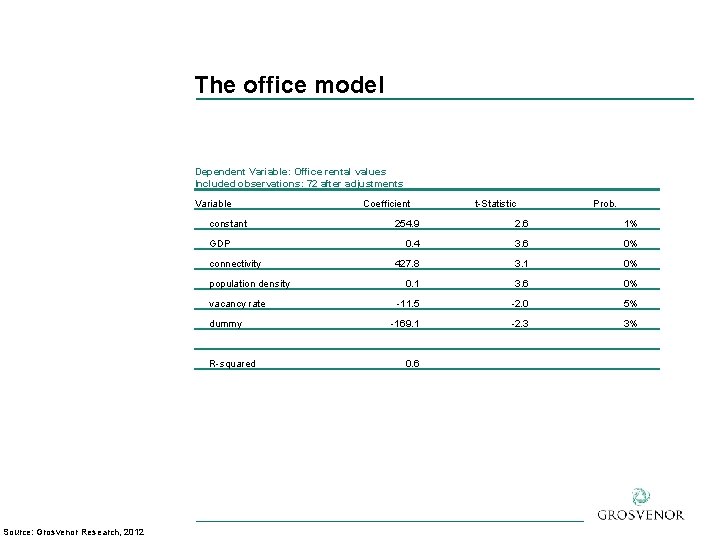
The office model Dependent Variable: Office rental values Included observations: 72 after adjustments Variable constant GDP connectivity population density vacancy rate dummy R-squared Source: Grosvenor Research, 2012 Coefficient t-Statistic Prob. 254. 9 2. 6 1% 0. 4 3. 6 0% 427. 8 3. 1 0% 0. 1 3. 6 0% -11. 5 -2. 0 5% -169. 1 -2. 3 3% 0. 6
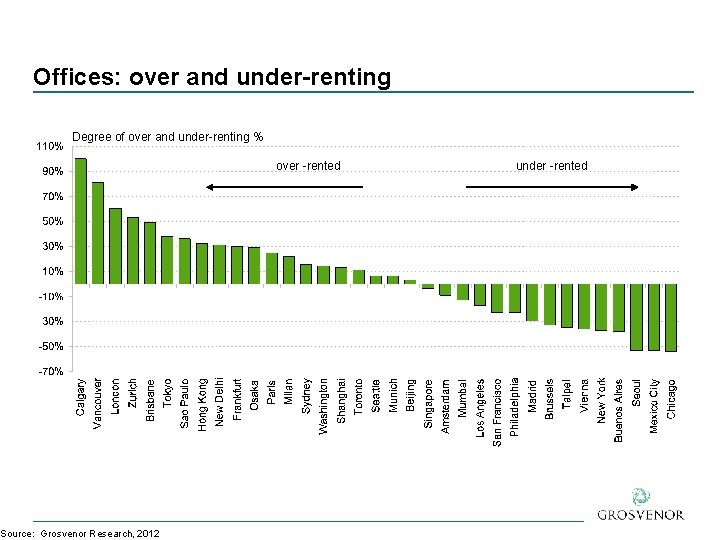
Offices: over and under-renting Degree of over and under-renting % Source: Grosvenor Research, 2012 over -rented under -rented
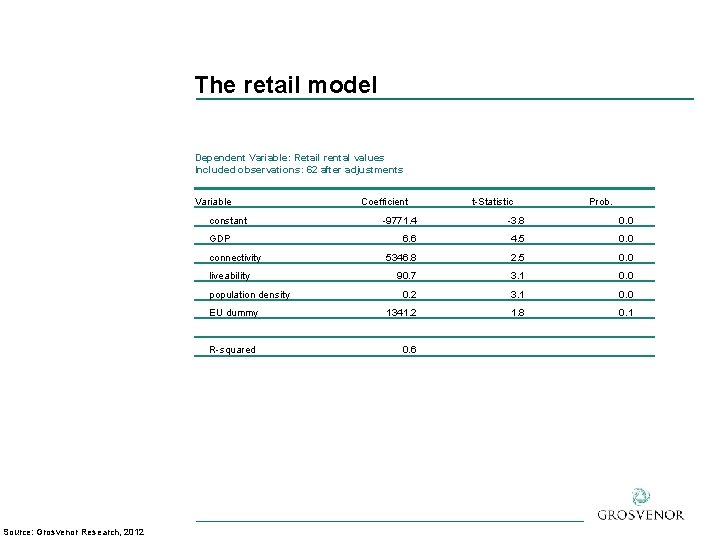
The retail model Dependent Variable: Retail rental values Included observations: 62 after adjustments Variable constant t-Statistic Prob. -9771. 4 -3. 8 0. 0 6. 6 4. 5 0. 0 5346. 8 2. 5 0. 0 90. 7 3. 1 0. 0 0. 2 3. 1 0. 0 EU dummy 1341. 2 1. 8 0. 1 R-squared 0. 6 GDP connectivity liveability population density Source: Grosvenor Research, 2012 Coefficient
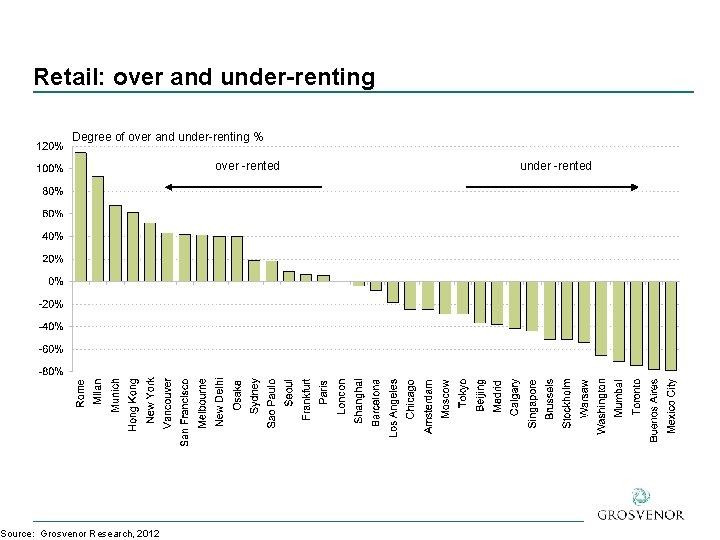
Retail: over and under-renting Degree of over and under-renting % Source: Grosvenor Research, 2012 over -rented under -rented
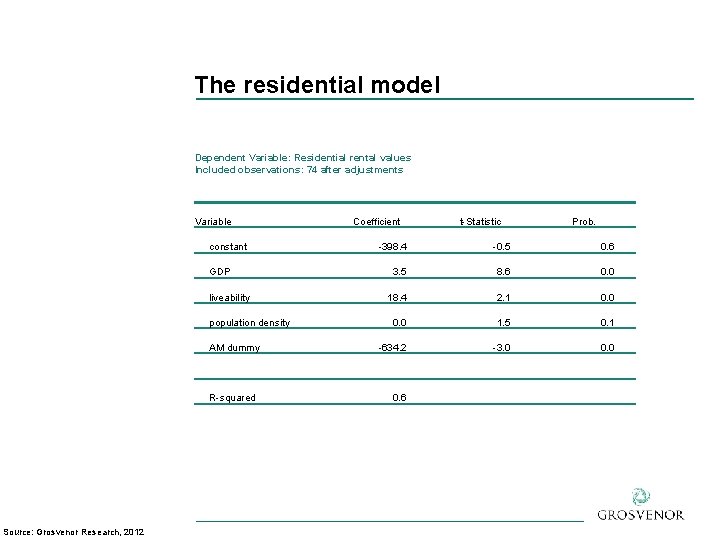
The residential model Dependent Variable: Residential rental values Included observations: 74 after adjustments Variable constant GDP liveability population density AM dummy R-squared Source: Grosvenor Research, 2012 Coefficient t-Statistic Prob. -398. 4 -0. 5 0. 6 3. 5 8. 6 0. 0 18. 4 2. 1 0. 0 1. 5 0. 1 -634. 2 -3. 0 0. 6
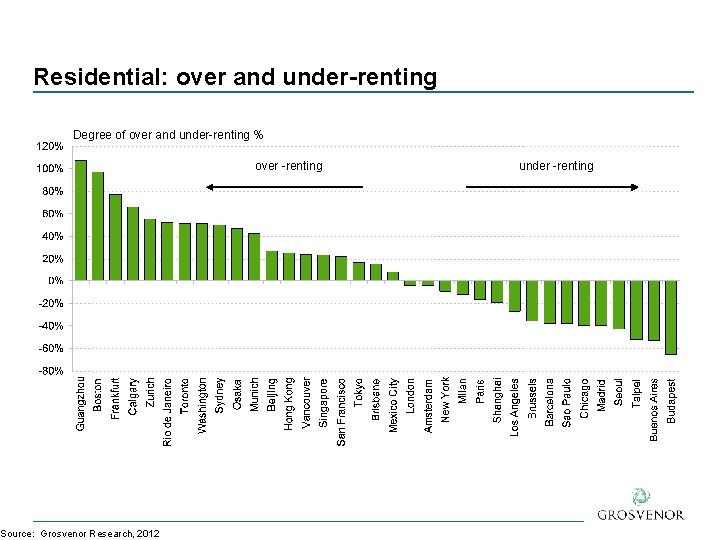
Residential: over and under-renting Degree of over and under-renting % Source: Grosvenor Research, 2012 over -renting under -renting
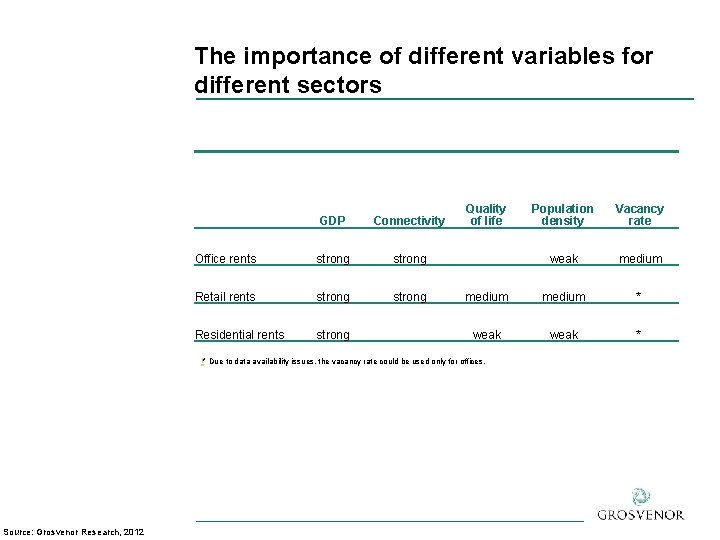
The importance of different variables for different sectors GDP Connectivity Quality of life Population density Vacancy rate Office rents strong weak medium Retail rents strong medium * Residential rents strong weak * ]* Due to data availability issues, the vacancy rate could be used only for offices. Source: Grosvenor Research, 2012
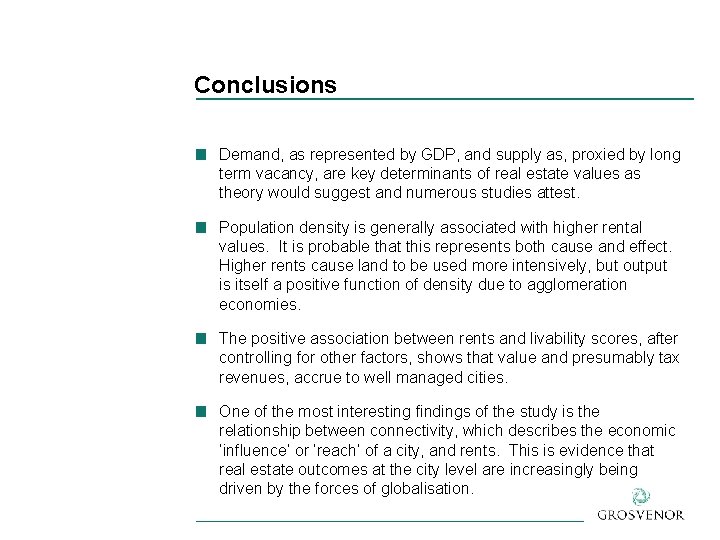
Conclusions ■ Demand, as represented by GDP, and supply as, proxied by long term vacancy, are key determinants of real estate values as theory would suggest and numerous studies attest. ■ Population density is generally associated with higher rental values. It is probable that this represents both cause and effect. Higher rents cause land to be used more intensively, but output is itself a positive function of density due to agglomeration economies. ■ The positive association between rents and livability scores, after controlling for other factors, shows that value and presumably tax revenues, accrue to well managed cities. ■ One of the most interesting findings of the study is the relationship between connectivity, which describes the economic ‘influence’ or ‘reach’ of a city, and rents. This is evidence that real estate outcomes at the city level are increasingly being driven by the forces of globalisation.
- Slides: 23