City of Kodiak Harbor Rates Harbor Rate Study

City of Kodiak Harbor Rates

Harbor Rate Study • Recommendations from Northern Economics – Option 1 ▫ 18. 5% increase and increase based on Producer Price Index each year for the next 4 years i. e. average 2. 8% increase each year • Alternative Recommendation – Option 2 ▫ 6% non-compounding increase per year
 pending more")
Council Questions & Concerns Council Action: : ØPostponed rate increase (both options) pending more discussion, information and time for public feedback Council Questions & Concerns: ØNot enough time for customers to prepare for rate increase July 1, 2016 ØWhat will the cost impact be to user? ØWhy is the moorage rate higher per foot for larger vessels ? ØHow do we compare to other markets ?

User Cost Impacts: Option 1 18. 5% Year One; Average 2. 8% Each Year Thereafter Table : 1 ANNUAL FEE PER FOOT Vessel Length Current Rate FY 17 FY 18 FY 19 FY 20 FY 21 (Jan 1, 2017) (July 1, 2018) (July 1, 2019) (July 1, 2020) 36. 55 37. 56 38. 62 39. 7 49. 94 51. 34 52. 78 54. 25 74. 3 76. 39 78. 52 80. 72 87. 1 89. 54 92. 05 94. 63 99. 89 102. 69 105. 56 108. 52 108. 41 111. 45 114. 57 117. 78 121. 81 125. 23 128. 74 132. 34 0 to 40 feet $30. 00 35. 55 41 to 60 feet $41. 00 48. 58 61 to 80 feet $61. 00 72. 28 81 to 100 feet $71. 50 84. 73 101 to 120 feet $82. 00 97. 17 121 to 150 feet $89. 00 105. 46 151 + feet $100. 00 118. 5 Table : 2 Vessel Length ANNUAL FEE PER VESSEL Current Rate FY 17 FY 18 FY 19* FY 20 FY 21 40 feet $1, 200. 00 1, 422. 00 1, 461. 82 1, 502. 75 1, 544. 82 1, 588. 08 60 feet $2, 460. 00 2, 914. 80 2, 996. 41 3, 080. 31 3, 166. 56 3, 255. 23 80 feet $4, 880. 00 5, 782. 40 5, 944. 31 6, 110. 75 6, 281. 85 6, 457. 74 100 feet $7, 150. 00 8, 473. 00 8, 710. 24 8, 954. 13 9, 204. 85 9, 462. 58 120 feet $9, 840. 00 11, 660. 00 11, 986. 48 12, 322. 10 12, 667. 12 13, 021. 80 150 feet $13, 350. 00 15, 819. 00 16, 261. 93 16, 717. 27 17, 185, 35 17, 666. 39 151 $15, 100. 00 17, 893. 50 18, 394. 52 18, 909. 57 19, 439. 03 19, 983. 32
")
Table : 3 User Cost Impacts: Option 2 (6% per year for 5 years) ANNUAL FEE PER FOOT (6% increase per year) Vessel Length Current Rate FY 17 FY 18 FY 19 FY 20 FY 21 (Jan 1, 2017) (July 1, 2018) (July 1, 2019) (July 1, 2020) 0 to 40 feet $30. 00 $31. 80 $33. 60 $35. 40 $37. 20 $39 41 to 60 feet $41. 00 $43. 46 $45. 92 $48. 38 $50. 84 $53. 30 61 to 80 feet $61. 00 $64. 66 $68. 32 $71. 98 $75. 64 $79. 30 81 to 100 feet $71. 50 $75. 79 $80. 08 $84. 37 $88. 66 $92. 95 101 to 120 feet $82. 00 $86. 92 $91. 84 $96. 76 $101. 68 $106. 60 121 to 150 feet $89. 00 $94. 34 $99. 68 $105. 02 $110. 36 $115. 70 151 + feet $100. 00 $106. 00 $112. 00 $118. 00 $124. 00 $130. 00 Table : 4 ANNUAL FEE PER VESSEL (6% increase per year) Vessel Length Current Rate FY 17 40 feet $1, 200. 00 $1, 272. 00 60 feet $2, 460. 00 $2, 607. 60 80 feet $4, 880. 00 $5, 172. 80 100 feet $7, 150. 00 $7, 579. 00 120 feet $9, 840. 00 $10, 430. 40 150 feet $13, 350. 00 $14, 151. 00 151 $15, 100. 00 $16, 006. 00 FY 18 $1, 344. 00 FY 19* $1, 416. 00 FY 20 $1, 488. 00 FY 21 $1, 560. 00 $2, 755, 20 $2, 902. 80 $3, 050. 40 $3, 198. 00 $5, 465. 60 $5, 758. 40 $6, 051. 20 $6, 334. 00 $8, 008. 00 $8, 437. 00 $8, 866. 00 $9, 295. 00 $11, 020. 80 $11, 611. 20 $12, 201. 60 $12, 792. 00 $14, 952. 00 $15, 753. 00 $16, 554. 00 $17, 355. 00 $16, 912. 00 $17, 818. 00 $18, 724. 00 $19, 630. 00

User Annual Cost Impacts Option 1 VS Option 2 Table : 2 Vessel Length ANNUAL FEE PER VESSEL (18. 5% year one, 2. 8% thereafter) Current Rate FY 17 FY 18 FY 19* FY 20 FY 21 1, 502. 75 1, 544. 82 1, 588. 08 40 feet $1, 200. 00 1, 422. 00 1, 461. 82 60 feet $2, 460. 00 2, 914. 80 2, 996. 41 3, 080. 31 3, 166. 56 3, 255. 23 80 feet $4, 880. 00 5, 782. 40 5, 944. 31 6, 110. 75 6, 281. 85 6, 457. 74 100 feet $7, 150. 00 8, 473. 00 8, 710. 24 8, 954. 13 9, 204. 85 9, 462. 58 120 feet $9, 840. 00 11, 660. 00 11, 986. 48 12, 322. 10 12, 667. 12 13, 021. 80 150 feet $13, 350. 00 15, 819. 00 16, 261. 93 16, 717. 27 17, 185, 35 17, 666. 39 151 $15, 100. 00 17, 893. 50 18, 394. 52 18, 909. 57 19, 439. 03 19, 983. 32 Table : 4 Vessel Length ANNUAL FEE PER VESSEL (6% increase per year) Current Rate FY 17 40 feet $1, 200. 00 $1, 272. 00 60 feet $2, 460. 00 $2, 607. 60 80 feet $4, 880. 00 $5, 172. 80 100 feet $7, 150. 00 $7, 579. 00 120 feet $9, 840. 00 $10, 430. 40 150 feet $13, 350. 00 $14, 151. 00 151 $15, 100. 00 $16, 006. 00 FY 18 $1, 344. 00 FY 19* $1, 416. 00 FY 20 $1, 488. 00 FY 21 $1, 560. 00 $2, 755, 20 $2, 902. 80 $3, 050. 40 $3, 198. 00 $5, 465. 60 $5, 758. 40 $6, 051. 20 $6, 334. 00 $8, 008. 00 $8, 437. 00 $8, 866. 00 $9, 295. 00 $11, 020. 80 $11, 611. 20 $12, 201. 60 $12, 792. 00 $14, 952. 00 $15, 753. 00 $16, 554. 00 $17, 355. 00 $16, 912. 00 $17, 818. 00 $18, 724. 00 $19, 630. 00
 Build")
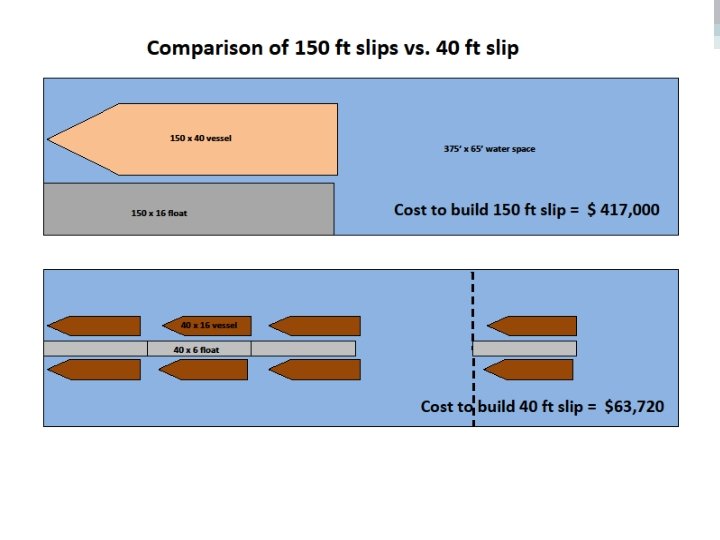
Build & Operating Cost - Per slip Table : 5 Slip Length (1) Build Cost Per LF (2) Total Build (3) Annual (4) Annual (5) Total Cost Per Slip Build Cost Per Operating Cost Annual Slip Per Slip ($60 ft) Cost (6) Total Annual Percent of Revenue Cost Billed per slip 23 1, 593 36, 639 1, 221 1, 380 2, 601 1, 092 42% 24 1, 593 38, 232 1, 274 1, 440 2, 714 1, 140 42% 30 1, 593 47, 790 1, 593 1, 800 3, 393 1, 425 42% 40 1, 593 63, 720 2, 124 2, 400 4, 524 1, 900 42% 48 1’ 593 76, 464 2, 549 2, 880 5, 429 2, 808 52% 55 1, 593 87, 615 2, 921 3, 300 6, 221 3, 188 52% 60 1, 858 111, 480 3, 716 3, 600 7, 316 3, 510 48% 62 1, 858 115, 196 3, 840 3, 720 7, 560 4, 867 64% 85 1, 947 165, 495 5, 516 5, 100 10, 616 7, 566 71% 100 2, 528 252, 800 8, 427 6, 000 14, 427 8, 900 62% 110 2, 528 278, 080 9, 269 6, 600 15, 869 10, 945 69% 150 2, 780 417, 000 13, 900 9, 000 22, 900 15, 975 70% 151 2, 780 419, 780 13, 993 9, 060 23, 052 17, 743 77% Build Cost Formula: total cost divided by total linear footage of facility (1), x length of slip = build cost per linear foot (2), divided by 30 year life cycle = slip build cost per year (3). • 23 to 62 foot slips build cost based on PND estimates for replacement (2016). • M, and P floats build cost based on actual cost (2008). • N float build cost based on M&P actual cost (2008) plus inflation adjustment of 10%. Operational cost Formula: 50% of annual harbor enterprise fund operating cost (1, 802, 500), divided by total linear feet of moorage = cost per linear foot x length of slip = annual operational cost per slip (4). Annual Revenue per slip formula: Total transient revenue (525 k) divided by total moorage linear feet (30 k) = transient revenue per linear foot (17. 50) x slip length = transient revenue per slip, + exclusive revenue per slip = total annual revenue per slip (6).

St Herman Harbor Shipyard & Travelift site P M N Ø N float cost 5 million in 2000 Ø M&P floats cost 9. 2 million in 2008 Ø Estimated E thru L floats replacement cost 29 million

Market Comparisons Alaska Washington Vessel Size Kodiak Homer Seaward Dutch Fisherman’s Edmonds Shilshole Harbor Terminal Marina Bay Island Marina 40 ft 1, 200. 00 1, 996. 40 2, 172. 80 1, 610. 00 3, 379. 20 5, 172. 60 6, 440. 00 6, 324. 36 110 ft 9, 020. 00 5, 196. 40 5, 826. 70 10, 120. 00 12, 156. 00 16, 125. 96 21, 776. 28 NA

FY 2017 Harbor Revenues by Source Appropriation from Fund Balance, 1, 369, 696, 36% Interfund Intergovernmental, Charges, 74, 258, 2%147, 365, 4% Miscellaneous, Rents & Net Investment 7, 300, 0% Royalties, Income, 16, 500, 0% 14, 000, 0% Charges for Services, 2, 162, 500, 57%

Harbor FY 2017 Budget - Charges for Services Dockages Pier / Dock AMHS, Fees, 198, 000, Other Misc 32, 500, 2% -, 0% Fees, 167, 000, 9% 8% Transient Moorage, 525, 000, 24% Exclusive Moorage, 1, 240, 000, 57%

Harbor Fund Balance 2014 Actual 2015 Actual 2016 Estimated 2017 Budget 2018 Forecast 2019 Forecast 2020 Forecast 2021 Forecast Restricted for Assigned to Capital Assets Debt Service Capital Projects Unassigned 11, 146, 129, 5 618 81 Unknown 3, 271 9, 877, 129, 5 533 81 Unknown 3, 523, 982 9, 877, 129, 5 2, 940, 9 533 81 01 123, 096 9, 877, 129, 5 2, 940, 9 533 81 01 (4, 187, 501) 9, 877, 129, 5 533 81 (4, 953, 392) 9, 877, 129, 5 533 81 (5, 821, 913) 9, 877, 129, 5 533 81 (6, 793, 063) 9, 877, 129, 5 533 81 (7, 866, 875)

Harbor Fund – Appropriations Year FY 2016 Estimated FY 2017 Budget Annual Net Deficit - Appropriations (474, 216) (1, 369, 696) FY 2018 Forecasted (765, 891) FY 2019 Forecasted (868, 521) FY 2020 Forecasted (971, 150) FY 2021 Forecasted (1, 073, 812)

Harbor Fund Balance 20, 000 15, 000 3, 271 3, 523, 982 123, 096 10, 000 5, 000 - t as or ec 20 21 F as or ec 20 20 F Fo re 20 19 or ec as ca st t t 7 B 20 1 Unassigned Restricted for Debt Service 20 18 F ud ge ed im at st 20 16 E A 15 20 20 14 A ct ct u al ua l (10, 000) t (4, 187, 501) (4, 953, 392) (5, 821, 913) (6, 793, 063) (7, 866, 875) (5, 000) Assigned to Capital Projects Restricted for Capital Assets

Harbor Charges for Services – Option 1 Charges for Services Dockages AMHS Exclusive Moorage Transient Moorage Other Misc Fees Pier / Dock Fees Total Charges for Services FY 2017 FY 2018 FY 2019 FY 2020 FY 2021 Budget 18. 5% 1/1 2. 8% 32, 50 32, 5 3 00 0 500 00 32, 500 0 1, 240, 00 1, 510, 1, 552, 8 1, 641, 0 00 0 543 38 1, 596, 318 5 525, 0 573, 56 639, 657, 4 694 00 3 545 52 675, 860 4 167, 0 197, 89 203, 209, 1 221 00 5 436 32 214, 988 8 198, 0 234, 63 241, 247, 9 262 00 0 200 53 254, 896 3 2, 16 2, 278, 2, 627, 2, 699, 2, 774, 5 2, 8 2, 500 588 224 875 62 340

Harbor Charges for Services – Option 2 Charges for Services Dockages AMHS Exclusive Moorage Transient Moorage Other Misc Fees Pier / Dock Fees Total Charges for Services FY 2017 FY 2018 FY 2019 FY 2020 FY 2021 Budget 6% 1/1 6% 6% 32, 50 32, 5 00 0 0 00 32, 500 1, 240, 00 1, 388, 80 1, 463, 2 1, 6 00 0 0 00 1, 537, 600 000 525, 0 540, 75 588, 00 619, 5 00 0 0 00 651, 000 500 167, 0 177, 02 187, 04 197, 0 00 0 0 60 207, 080 100 198, 0 209, 88 221, 76 233, 6 00 0 0 40 245, 520 400 2, 16 2, 200, 2, 418, 2, 545, 2, 673, 7 2, 8 2, 500 150 100 900 00 500

Harbor Charges for Services – Comparison Charges for Services FY 2017 Budget FY 2017 6% 1/1 FY 2018 6% FY 2019 6% FY 2020 6% FY 2021 6% 2, 16 2, 278, 2, 627, 2, 699, 2, 774, 5 2, 8 2, 500 588 223 876 62 340 2, 16 2, 200, 2, 418, 2, 545, 2, 673, 7 2, 8 2, 500 150 100 900 00 500 Option 1 Option 2 Difference -0 - (78, 438) (209, 124) (153, 975) (100, 862) (49, 840) * Note Option 1 generates $592, 240 more revenue than Option 2 over a 5 year period
 doesn’t fully address the harbors financial short")
Summary • Proposed rate increase (either option) doesn’t fully address the harbors financial short falls but option 1 generates $592, 240 in additional funds over the 5 year period. • The tiered rate structure is justified based on build costs for the varying slip sizes, bigger slips cost more per SF to build. • The smaller vessel are not charged anywhere near the build and operational cost and are far below other comparable Alaska markets. • Large vessels are exceeding current Alaska markets after 5 years. • What is Councils direction moving forward?
- Slides: 19