City Climate The Heat Island Effect HO Puising


- Slides: 30
City Climate The Heat Island Effect HO Pui-sing
City Climate as a micro-climate Micro-climate is a climate conditions of the nearest 100 m of the ground surface.
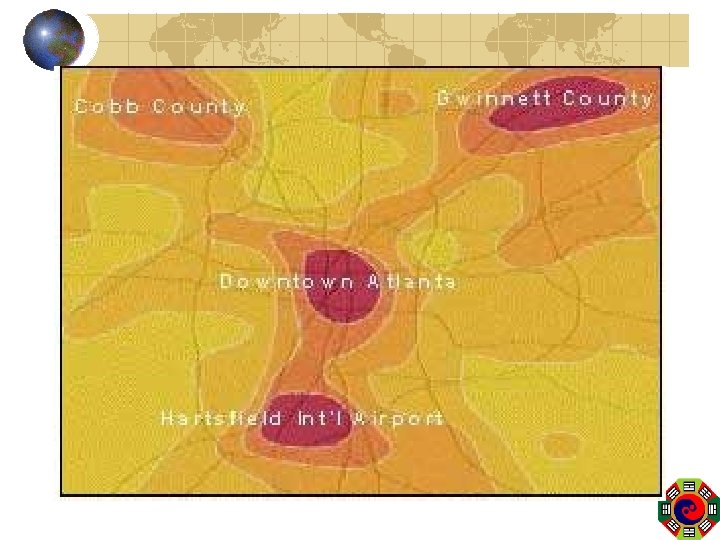
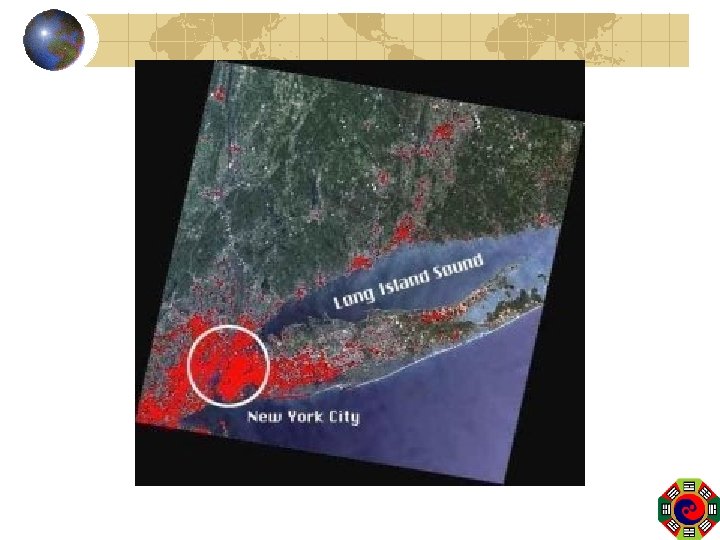
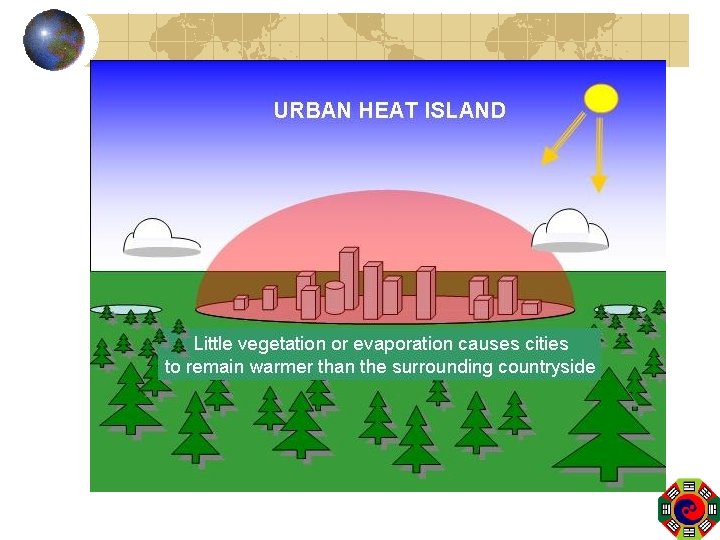
Heat Island ØTemperature of cities is higher than the temperature of the surrounding areas. ØShowing by isotherm, it looks like a “warm island” surrounded by a “cool sea”.
The Heat Island Effect Causes of the heat island Magnitude of the head island Temperature distribution within a city
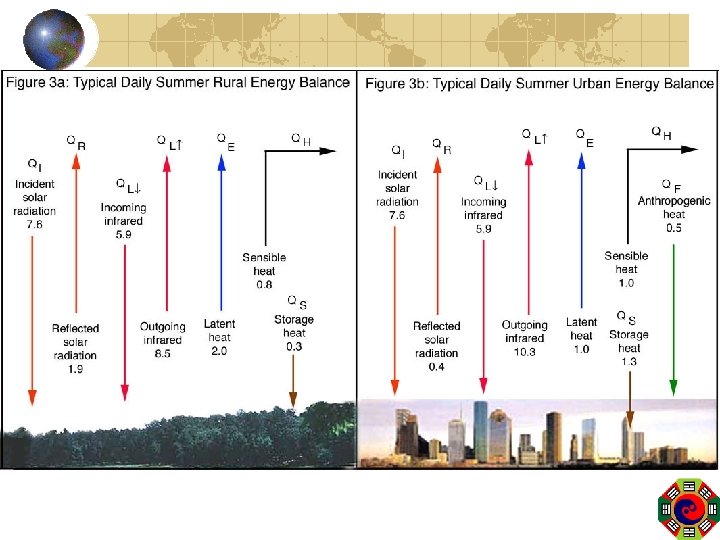
Causes of the Heat Island Changes of surface Heat Production Changes in the composition of atmos. Increase Turbidity
Causes of the Heat Island Changes of surface Waterproof cement surface Thermal Admittance Roughness of the surface
Causes of the Heat Island Heat Production Industrial Activities Cooling and Heating Concentration of People
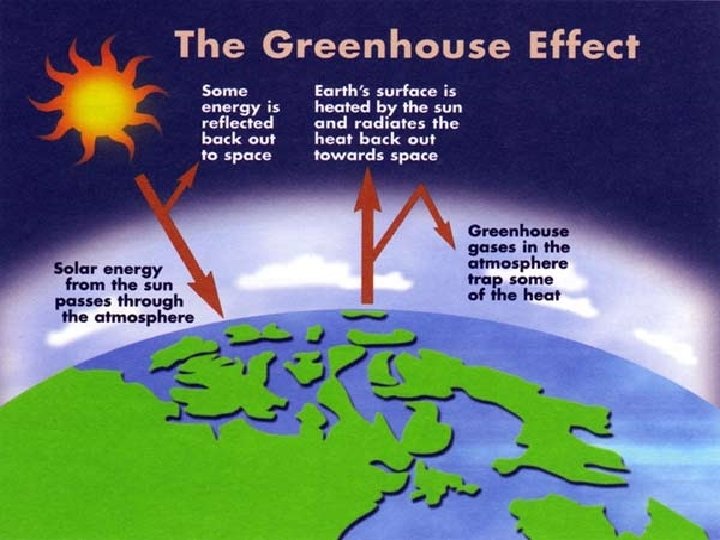
Causes of the Heat Island Changes in the composition of atmosphere Increase green-house gases – CO 2, CO Enhance green-house effect
Green House Effect
Causes of the Heat Island Increase Turbidity Industrial and transport activities introduce a great quantity of fine particles into the air. Increase the counter-radiation Hinder heat dispersion
Magnitude of Heat Island Size of cities Local Micro-climate condition Topography Diurnal and Weekly variation Seasonal variation Building density Distance from city
Magnitude of Heat Island Size of cities Large city – strong heat island effect Small city – weak heat island effect
Magnitude of Heat Island Local Micro-climate condition Wind speed • fast – weak effect • Slow – strong effect Cloud cover • High - strong effect • Low – weak effect
Magnitude of Heat Island Topography The effect will be less pronounced among ocean, rivers, lakes, wood land, pastures and areas of high elevation
Magnitude of Heat Island Diurnal and weekly variation More pronounced at night and during week days Seasonal variation More pronounced during winter
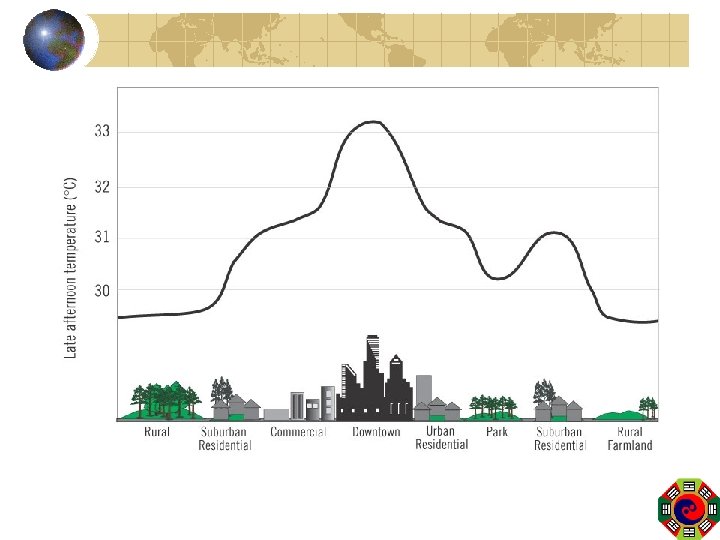
Magnitude of Heat Island Building density Magnitude increases with increasing building density Distance from city centre Magnitude increases with decreasing distance from city centre
Magnitude of Heat Island
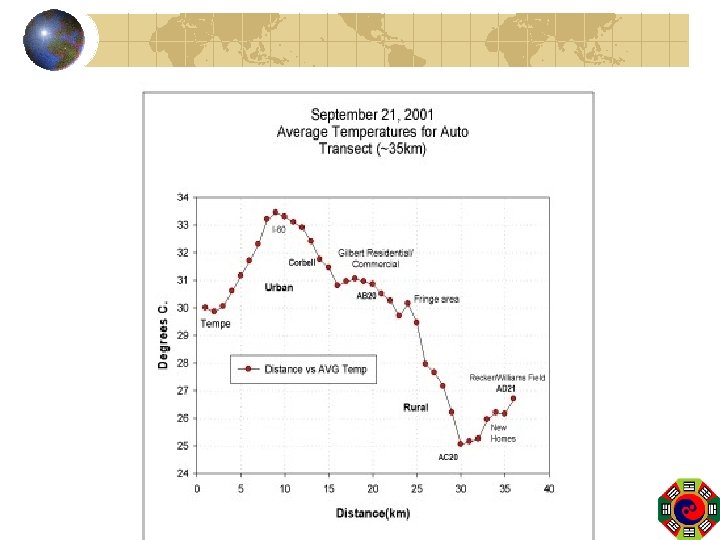
Temperature distribution within a city Variation within a city / Horizontal distribution Street intersection – (the coldest place) Heavily traveled main roads (2 degree ) Around stop light (2 -3 degree )
Temperature distribution within a city Vertical distribution Normal Inversion
Temperature distribution within a city Inversion and Pollution
Temperature distribution within a city Dust Dome / Pollution Dome
The End