Chromosomes Karyotypes 1 Chromosomes 2 Chromosome Number All

Chromosomes & Karyotypes 1

Chromosomes 2
 have 46 or 23")
Chromosome Number All cells in the human body (SOMATIC CELLS) have 46 or 23 pairs of chromosomes Called the DIPLOID or 2 n number GAMETES (eggs & sperm) have only 23 chromosomes Called the MONOPLOID or 1 n number 3

Nondisjunction Chromosomes may fail to separate during meiosis Resulting gametes may have too few or too many chromosomes Examples of chromosomal disorders: Down Syndrome – three #21 chromosomes Turner Syndrome – single X chromosome Klinefelter’s Syndrome – XXY chromosomes 4

Karyotype �A picture of a person’s chromosomes

Normal Male 2 n = 46 6

Normal Female 2 n = 46 7
 2 n = 47 8")
Male, Trisomy 21 (Down’s) 2 n = 47 8

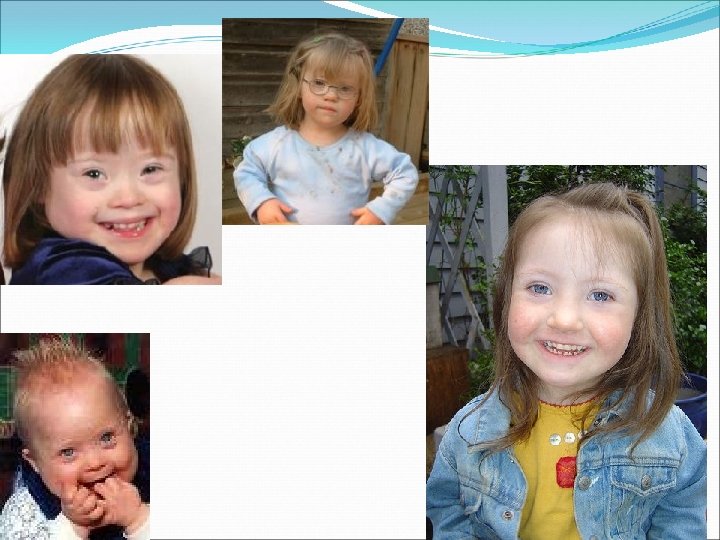
Female Down’s Syndrome 2 n = 47 9

Downs Syndrome �Set of symptoms that can range from mild to severe �Slower mental and physical development �Flat face with an upward slant to the eye, short neck, and abnormally shaped ears �Poor muscle tone, loose ligaments �Heart disease � Eye problems �Intestinal problems

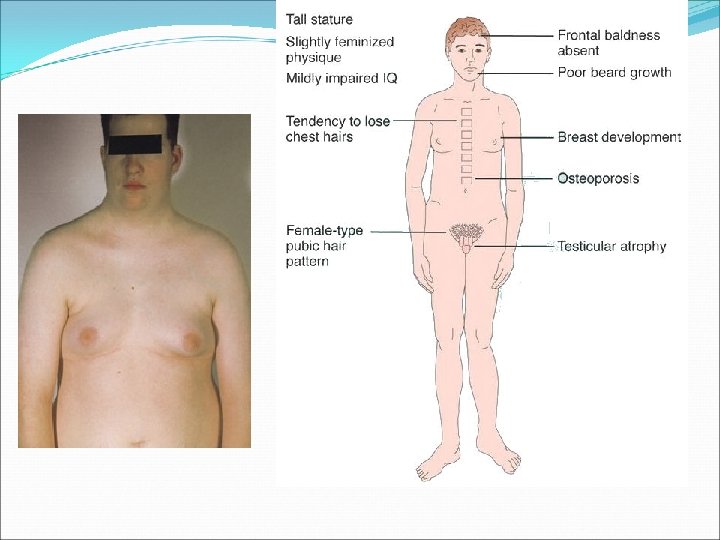
Klinefelter’s Syndrome 2 n = 47 12

Klinefelter’s syndrome �Male �Don’t produce enough testosterone �Smaller testes �Breast enlargement �Reduced body and facial hair �Most infertile �Increased risk of breast cancer �May have learning disabilities � 1 in 500 births

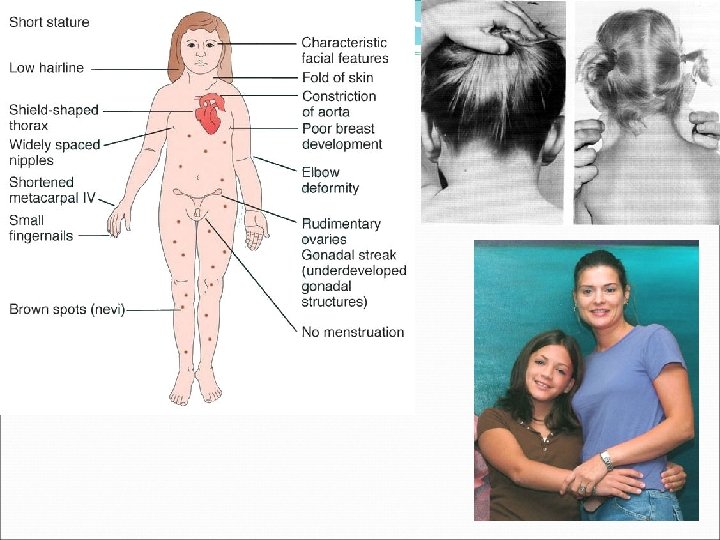
Turner’s Syndrome 2 n = 45 15

Turner Syndrome �Short stature �Ovaries don’t function correctly �Won’t go through puberty unless treated with hormones � 1/3 have extra folds on the neck � 1/3 have heart defects � 1 in 2500 births (many miscarry, though)

Pedigree Charts The family tree of genetics

What is a Pedigree? �A pedigree is a chart of the genetic history of family over several generations. �Scientists or a genetic counselor would find out about your family history and make this chart to analyze.

Constructing a Pedigree Female Male

Connecting Pedigree Symbols Examples of connected symbols: �Married Couple �Siblings

Example �What does a pedigree chart look like?

Interpreting a Pedigree Chart 1. Determine if the pedigree chart shows an autosomal or X-linked disease. � If most of the males in the pedigree are affected the disorder is X-linked � If it is a 50/50 ratio between men and women the disorder is autosomal.

Example of Pedigree Charts �Is it Autosomal or X-linked?

Answer �Autosomal

Interpreting a Pedigree Chart 2. Determine whether the disorder is dominant or recessive. � If the disorder is dominant, one of the parents must have the disorder. � If the disorder is recessive, neither parent has to have the disorder because they can be heterozygous.

Example of Pedigree Charts �Dominant or Recessive?

Answer �Dominant

Example of Pedigree Charts �Dominant or Recessive?

Answer �Recessive

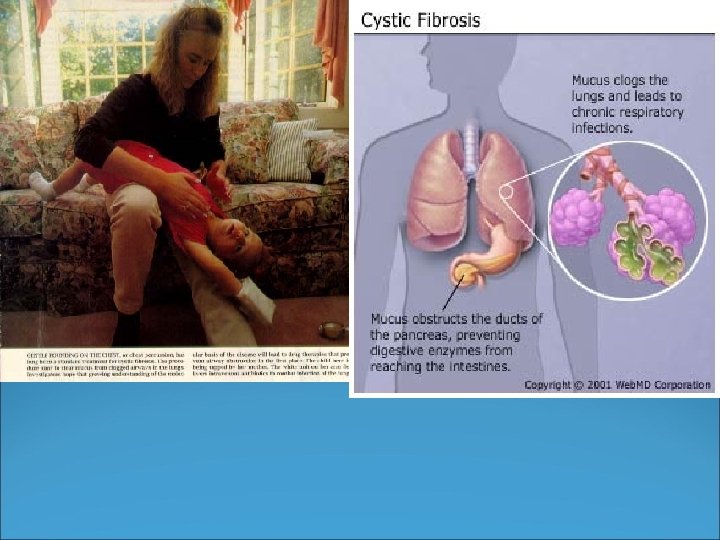
Examples of recessive traits �Albinism – lack of hair and skin pigmentation �Tay-Sachs – fatal disease that causes nerve damage �Cystic fibrosis – defective protein needed for lungs and digestion


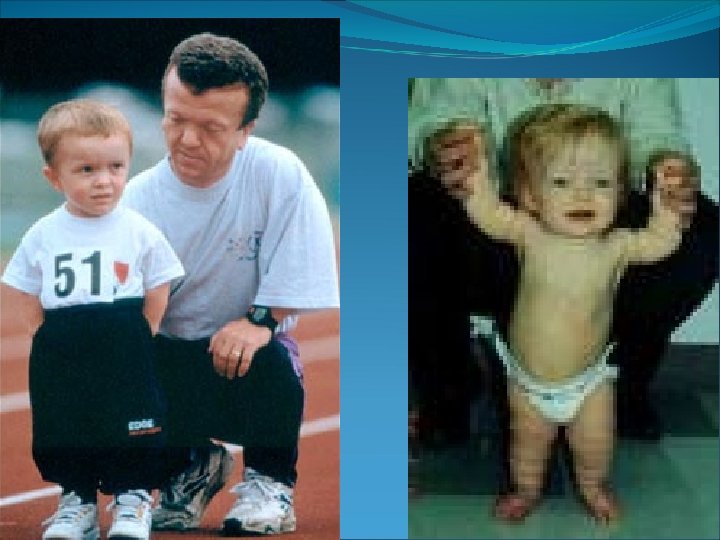
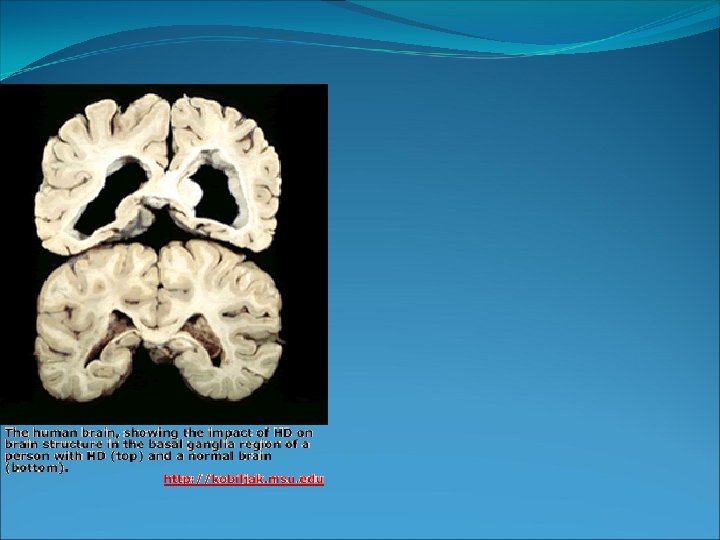
Examples of dominant traits �Achodroplasia – dwarfism – 1 out of 25, 000 �Huntington’s disease – degeneration of nervous system leading to death
- Slides: 37