CHROMATOGRAPHY Basics to Advancements Separation A key Step

CHROMATOGRAPHY: Basics to Advancements

Separation- A key Step! q A key step towards purification, isolation and reliable measurements of chemical mixtures in many areas of scientific research q Different separation methods have been developed over the years (Precipitation, Distillation, Sublimation, Extraction etc. ) q Chromatography is one of the versatile separation technique!

What is Chromatography ? Chromatography = Color -Writing Chroma-Colour and Graphein-Write “Chromatography is a broad range of physical methods in which the components to be separated are distributed between two phases, one of which is stationary while the other moves in a definite direction” (IUPAC) • Analyze • Identify Separate • Purify Mixture Components • Quantify

Principle Chromatography utilizes the ability of solute to distribute itself b/w two phases, according to distribution or partition coefficients (Kc) Xm Xs Kc = [X]s / [X]m Xs = Concentration of the solute component in the stationary phase Xm = Concentration of the solute component in the mobile phase

A Typical Chromatographic Set Up

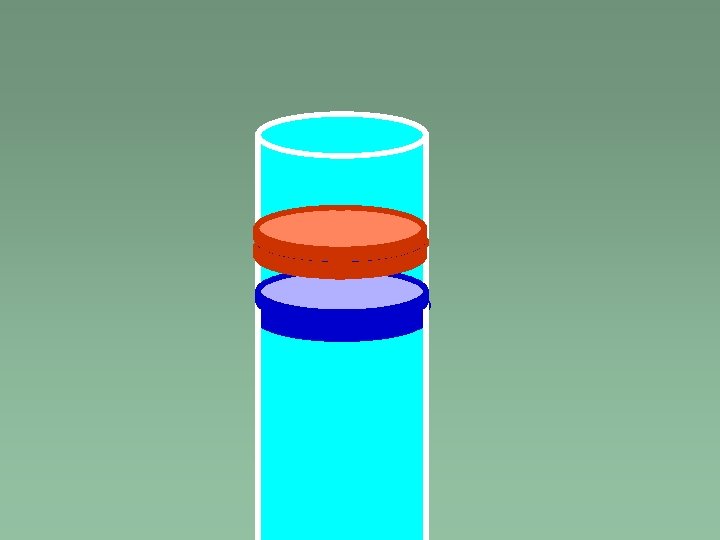
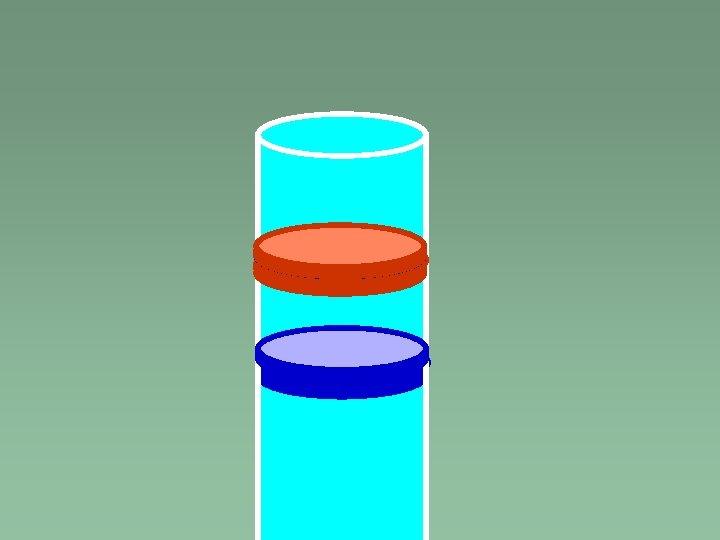
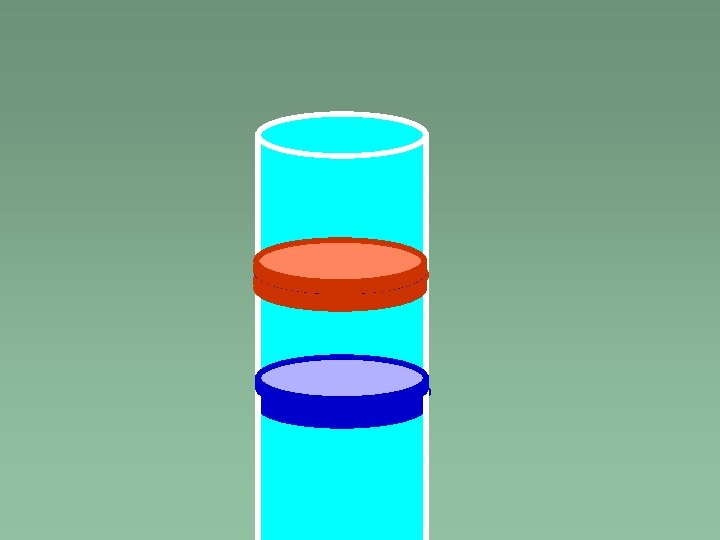
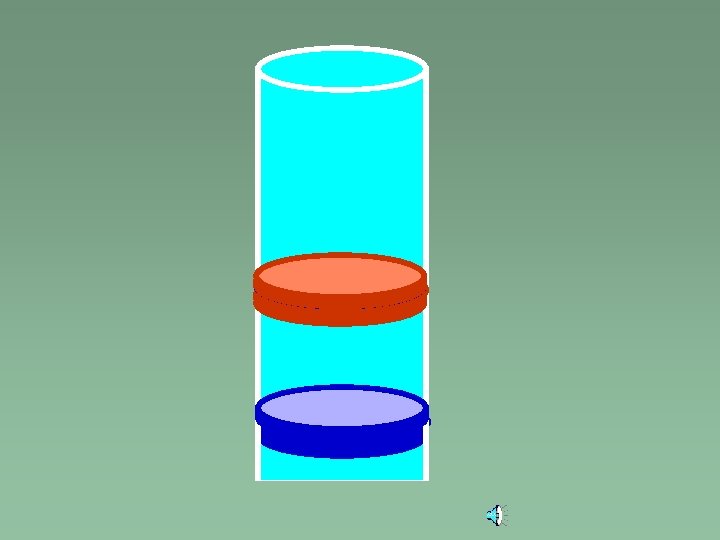
How mixed sample can be separated? direction of flow river bed 6

What is the difference? Strong Weak Interaction difference 7
 v 1938 Izmailov & Shraiber")
Historical Account v 1903 -06 Mikhail Tswett (Column Chromatography) v 1938 Izmailov & Shraiber (Thin Layer Chromatography) v 1942 Martin and Synge (Partition Chromatography) v 1952 Martin and James (Gas Chromatography /GC) v Tswett Founder of Chromatography 1967 Horvoth & Lipsky (High Performance Liquid Chromatography/HPLC) v Knox & Grant 1991 (Capillary electrochromatography)
 l Mode of")
Classification of Chromatography On the basis of: l Geometry (Planner, Colum) l Mode of Separation (Adsorption, Partition, Ion Exchange, Size Exclusion, Affinity) l Nature of Stationary Phase i. LSC & LLC l ii. GSC, GLC l l Nature of Mobile Phase (Liquid chromatography, Gas chromatography, Super critical fluid chromatography) 9

Classification Based on Mechanism of Separation • Adsorption • Partition • Size Exclusion • Ion Exchange • Affinity
 Probably one of the oldest types of chromatography")
Adsorption Chromatography (LSC, GSC) Probably one of the oldest types of chromatography

Normal phase LS Reverse phase LS 30 d- d+ Si - O - H Silica Gel • In LSC, there is competition of the solute components for the active sites on an adsorbent such as Silica Gel • NP-LS: Components elute in order of increasing polarity • RP-LS: Components elute in order of increasing hydrophobicity

Partition Chromatography Solute undergo partition between the mobile phase and the liquid stationary phase

Gel Permeation / Gel Filtration / Size Exclusion Chromatography l Lacks an attractive interaction between the stationary phase and solute l Porous gel separates the molecules according to their size l Mainly used for the separation of Polymers & Proteins l Order of elution - larger to smaller

Gel-Filtration Chromatography – Separation based on size
 Fractionation range MW 0 -800,")
Four Basic Types of GELS 1. Dextran (Sephadex Type) Fractionation range MW 0 -800, 000 Daltons 2. Polyacrylamide (Bio-Gels) 100 -400, 000 Daltons 3. Agarose (Sepharose Type and Bio-Gels) 10, 000 -150, 000 4. Polyacrylamide-Dextran (Sephacryl Type) 5, 000 -8, 000

• • Affinity Chromatography Most selective type of chromatography It utilizes the specific interaction between one kind of solute molecule and a second molecule that is immobilized on a stationary phase The immobilized molecule may be an antibody to some specific protein.

Affinity Chromatography • Bound proteins can be eluted with the small molecule or with denaturing reagents (urea, guanidine, etc. ) • Small molecules are attached to beads and complex protein mixtures are applied

Ion-exchange Chromatography l Ion-exchange separations are carried out in columns packed with an ion-exchanger. l Solute ions of the opposite charge in the mobile liquid phase are attracted to the ion-exchanger by electrostatic forces.

Ion-exchange Mechanism Cation Exchanger RSO-3 …… Na+ + exchanger counter ion +NH 3 R / charged molecule to be changed RSO-3 …… +NH 3 R / + Na+ bound molecular exchanged ion Anion Exchanger (R)4 N+ …… Cl- exchanger counter ion + -OOCR/ charged molecule to be changed (R)4 N+ …… -OOCR/ + Cl- bound molecular exchanged ion

Column Chromatography

Principles of Separation on a column


Column chromatography – an example of the equipment used in low-performance liquid chromatography Solvent reservoir Column head Column packing Porous glass plate Sample is usually applied directly to the top of the column. Detection is by fraction collection with later analysis of each fraction

Thin layer chromatography TLC is method of separating mixture by eluting them through a planar chromatographic bed then visualizing the separating bed by staining or charring. v Easy to learn, fast and versatile technique v Used both for qualitative and quantitative purposes v An indispensable tool in both quality control and research labs.

Out line of TLC method 1. i. Preparation of TLC Plates Selection of plate (standard 20 x 5 or 20 x 20 cm ) ii. Selection of adsorbent and making the slurry (1: 2 w/v) (Properties of adsorbent can be modified) iii. Applying thin layer to the support ( Spreading, pouring, spraying and dipping) iv. Activation of plate (120 -150 °C; 30 min )

2. Application of Sample Microanalytical TLC ( 20 x 20 cm; thickness 0. 25 mm) o Sample volume = 0. 1 - 0. 5 mm 3 applied as spot o Loading ~ 12 g per spot (1 -5 g l-1 solution concentration are practicable ) Semipreparative TLC ( 20 x 20 cm; thickness 0. 25 mm) o Sample is often applied as streak o Loading ~ 4 mg Preparative TLC ( 20 x 20 cm; thickness 0. 5 -2 mm) o Sample is often applied as streak o Loading ~ 250 mg Spotting a TLC plate with sample
 ü Radial or circular")
3. ü Development One-dimensional ( Asecding TLC & Desending TLC) ü Radial or circular TLC Running the TLC plate in solvent

TLC: A Two-Component Mixture solvent front component B Less polar! component A More polar! solvent front component B component A origin mixture solvent front origin Increasing Development Time origin

TLC: Qualitative Analysis

3. Location of Separated Substances 1. Visual Inspection 2. Chemical Methods (Involve the application of derivatising agent/ locating reagent/ chromogenic reagent Ø Specific reagents (2, 4 -DNPH–test for carbonyl compounds) Ø non-specific reagents (Iodine, sulphuric acid ) 3. Physical Methods Ø Ultraviolet detection (absorption & transmission measurements) Ø Fluorescence measurements Ø TLC scanners

Visualized under a UV light

TLC: Determination of Rf Values Rf of component A = d. A d. S Rf of component B = d. B d. S The Rf value is a decimal fraction, generally only reported to two decimal places

Difference b/w Normal-TLC and High Performance -TLC N-TLC HP-TLC Thickness of plate layer 0. 25 Thickness of plate layer 0. 1 mm mm Silica gel with 5 -40 m particle Refined silica gel with a mean 5 size distribution (1000 – 2000 m narrowed particle size theoretical plates per 5 cm distribution migration) (10000 theoretical plates per 5 cm migration) Normal analysis speed ----- Fast analysis (5 – 10 fold reduction in analysis time) Improved sensitivity and resolution
")
Stationary Phases in TLC • Particle size • Homogeneity Silica (Si. O 2)

Alumina Acidic: -Al-OH Neutral: -Al-OH + -Al-OBasic: -Al-O-

Solvents in TLC Generally a solvent or solvent mixture of lowest polarity consistent with good separation or employed

Paper Chromatography PC may be described as a technique for the separation of substances using paper (a mat of cellulose fibers) as a chromatographic sorbent with a liquid mobile phase The use of paper as chromatographic medium is usually regarded as a typical partition chromatography

Developing the PC Chromatogram l Place the strips in the beakers l Make sure the solution does not come above your start line l Keep the beakers covered l Let strips develop until the ascending solution front is about 2 cm from the top of the strip l Remove the strips and let them dry l Locate the spots and quote results

Factors which govern PC separation Propelling Forces l Solvent Flow l Solubility Retarding Forces l Partition l Adsorption

Some Representative Separation by TLC and PC Substance Solvent system Locating reagent Unsaturated fatty acids Pet. ether/Et 2 O I 2 (TLC) Lipids Pet. ether/Et 2 O/Ac. OH (80/20/1) I 2 or 50% H 2 SO 4 (TLC) Hydrocarbon oils CHCl 3/C 6 H 6 Flrorescence or conc. H 2 SO 4 (TLC) Sterols CHCl 3/Me 2 Co 50% H 2 SO 4 (TLC) Sugars Et. OAc/Ac. OH/Me. OH/H 2 O (60/15/15/10) -Naphthol - H 2 SO 4 (TLC) Amino acids Bu. OH/Et. OH/H 2 O Ninhydrin (TLC ) Vitamins Hexane/Acetone Sb. Cl 3 in Ac. OH (TLC ) Carotenoids, Chlorophyll Pet. ether/Et 2 O Visual (PC) Co, Mn, Ni, Cu, Fe chlorids Acetone/conc. HCl/water (87/8/5) Rubenic acid (PC) Aminoacids Bu. OH/Ac. OH/water (40/10/50) Ninhydrin (PC) (95/5)
 (James and Martin 1952) A technique for separating volatile/vaporized substances by")
Gas Chromatography (GC) (James and Martin 1952) A technique for separating volatile/vaporized substances by percolating a stream of inert gas over the stationary phase • A versatile analytical tool • A state-of-the-art separation technique • A choice in the hands of analytical chemist
 (Adsorption Chromatography) 2. Gas Liquid Chromatography")
Modes of GC 1. Gas Solid Chromatography (GSC) (Adsorption Chromatography) 2. Gas Liquid Chromatography (GLC) (Partition Chromatography)

Schematic Diagram

GC Animation

Gas Supply System in GC l Inert, easily available, pure, low cost l Compatible with the detector l Typical inlet pressure 10 -50 psi l Low density gas- faster separation l High density gas-better separation l Common gases (Helium, Nitrogen, Hydrogen)

Sample Injection System in GC v Sample must be volatile/vaporizable v A “Micro Syringe” is used to inject sample v Typical sample size; v Packed column 1 -20 L Capillary column 0. 1– 1. 0 L Typical gas sample volume 1– 10 m. L

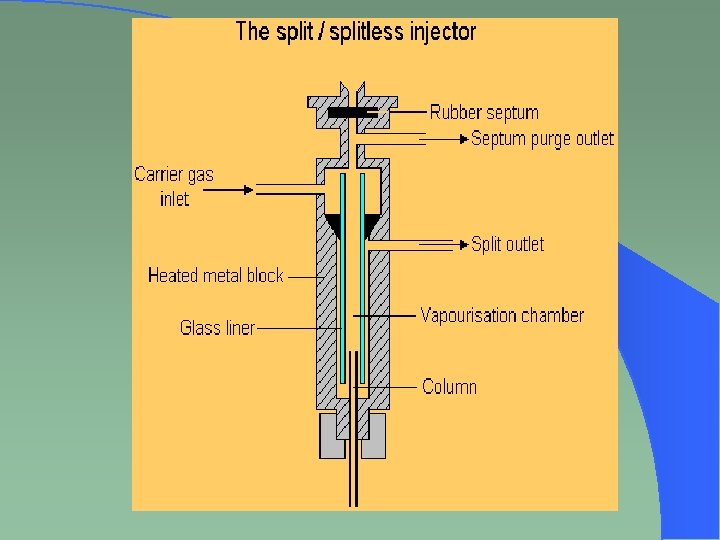
Sample Injection Modes in GC l Split/Splitless Injection l On-Column Injection l Programmed-Temperature Vaporization (PTV) l Head Space Analysis l Thermal Desorption l Auto Sampler l Pyrolysis

GC Columns 1. Packed columns ( Length 1. 5 -10 m; I. D 2 -4 mm) 2. Capillary columns / Open tubular columns ( Length 10 -100 m; I. D 0. 2 -0. 5 mm) 2. 1 WCOT Columns 2. 2 SCOT Columns 2. 3 FSOT Columns (polyamide coated FS and metal coated FS)

Typical Packed Column

Typical Capillary Column

Conditioning of Column l Conditioning for at least 10 h at about 20 °C, above or just close to the upper working temperature of the column l Conditioning must be done below the maximum temp. limit for the stationary phase

Liquid Stationary Phases use in Columns 100% dimethyl polysiloxane Non-polar, Stable to 360°C Uses: solvents, waxes, petroleum and pharmaceutical samples 5% diphenyl - 95% dimethyl polysiloxane Non-polar, Stable to 360°C Uses: flavors, environmental samples, aromatic hydrocarbons Carbowax® PEG Polar, Stable to 250°C Uses: FAMEs, flavors, acids, amines, solvents, xylene 50% cyanopropylphenyl - 50% phenylmethyl polysiloxane Polar, Stable to 260°C Uses: FAMEs, carbohydrates

20% diphenyl - 80% dimethyl polysiloxane Slightly polar, Stable to 310°C Uses: volatile compounds, alcohols 6% cyanopropylphenyl - 94% dimethyl polysiloxane Slightly polar, Stable to 280°C Uses: volatile compounds, insecticides, residue solvents in pharmaceutical products 14% cyanopropylphenyl - 86% dimethyl polysiloxane Intermediately polar, Stable to 280°C Uses: pesticides, Aroclors, alcohols, oxygenates 65% diphenyl - 35% dimethyl polysiloxane Intermediately polar, Stable to 370°C Uses: triglycerides, rosin acids, free fatty acids

Efficiency of a Column can be guessed by its Theoretical Plate l Theoretical plate number (N) N = 16 (t. R/wb)2 l HETP = L/N
 2 - Electron Capture Detector (ECD)")
GC Detectors 1 - Flame Ionization Detector (FID) 2 - Electron Capture Detector (ECD) 3 - Thermal Conductivity Detector (TCD) 4 - Nitrogen Phosphorous Detector (NPD) 5 - Flame Photometric Detector (FPD) 6 - Fourier Transform Infra Red (FTIR) 7 - Mass Spectrometry (MS)
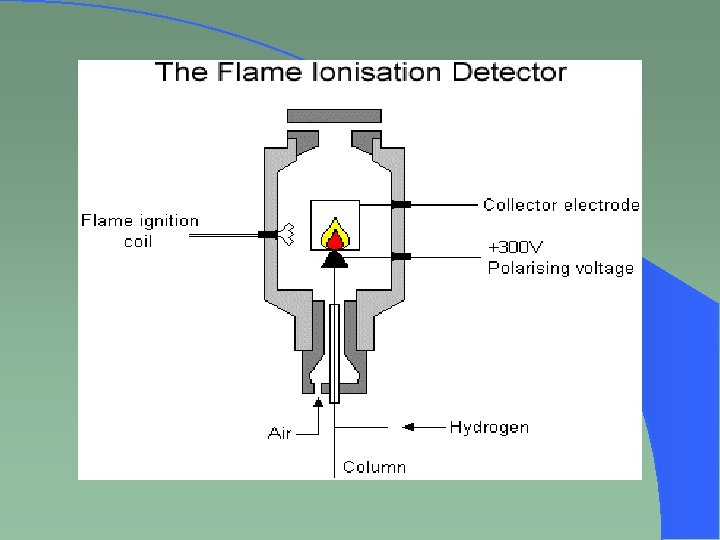

General Features of GC Detectors Applications Sensitivity Linear dynamic range FID Most organic compounds 10 -100 pg Excellent. up to 107 TCD General, responds to all substances 5 -100 ng up to 107 ECD All substances that have affinity to capture electrons (halides, nitrates, nitriles, peroxides, anhydrides, organometallics) 0. 05 -1. 00 pg up to 105 NPD Nitrogen and phosphorus compounds 0. 1 -10 pg up to 106 FPD Sulphur and phosphorus compounds 10 pg S, 1 pg P up to 103 MS Nearly all substances Excellent

Data Interpretation in GC Qualitative analysis The retention times of unknown compounds are compared with those of pure standards Quantitative analysis Triangulation Integration of peak area Area = Wb x height 2 Normalization %Area = Area of peak x 100 Tolal Area height base

Isothermal and Programmed-Temperature Elution in GC

Typical Chromatogram of GC

Typical Chromatogram of GC

GC Chromatogram of Banaspati Tullo Dalda VTF

Coupling GC with MS
 l Mass l Ion analyzers detector")
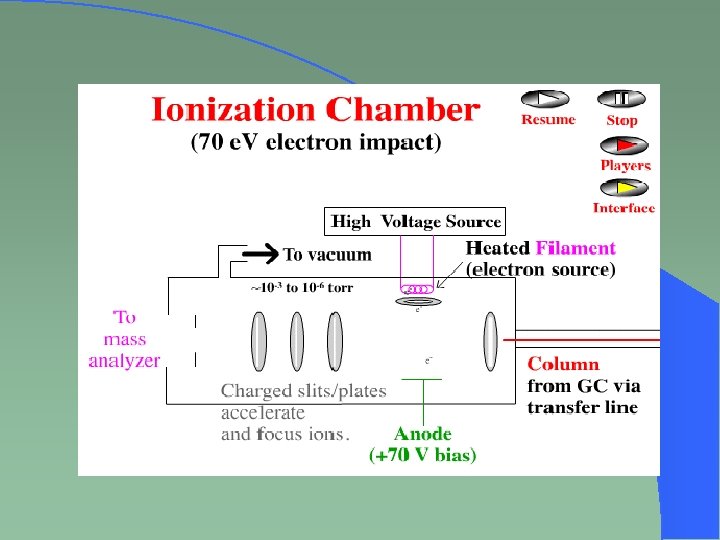
Component of MS l Ion source (Ionization chamber) l Mass l Ion analyzers detector l Read out Devices
")
Ion Sources l Electron Impact Ionization l Chemical l Fast Ionization Atomic Bombardment (EI) (CI) (FAB)

Mass Analyzer l Single focussing magnetic analyzer l Double l Time focussing magnetic analyzer of flight l Quardropole mass analyzer

Quadropole analyzer

Ion Collector
 M/z [CH 3 -CH 2 -CH")
MS spectrum of n-hexane M+/z Fragments Intensity (%) M/z [CH 3 -CH 2 -CH 3]+ 35 86 [CH 3 -CH 2 -CH 2]+ 10 71 [CH 3 -CH 2 -CH 2]+ 100 57 [CH 3 -CH 2]+ 75 43 40 29 [CH 3 -CH 2]+

Interpretation of Mass Spectra l The peak of highest m/z is the molecular ion peak and it gives the molecular weight of compound. l The peak of highest intensity about 100% is the base peak and it is due to most stable ion. l Meta stable ion peaks appear on some non integral value of M/z and give information about the mechanism of fragmentation

Applications of GC-MS l Determination of mass, molecular formula and structure of compounds l Qualitative and quantitative analysis l In petroleum industry analysis of crude petroleum products l Food industry l Analysis of pesticides residues l l Plastic industry Fertilizers analysis

- Slides: 80